
Near-saturated soil hydraulic conductivity and pore characteristics as influenced by conventional and conservation tillage practices in North-West Himalayan region,India
2021-08-17 03:02:50DeepkSinghAlokKumrMishrSridhrPtrSnkrMrippnNishSingh
Deepk Singh ,Alok Kumr Mishr ,Sridhr Ptr ,Snkr Mrippn ,Nish Singh
a ICAR-Indian Institute of Soil and Water Conservation,Dehradun,248195,Uttarakhand,India
b Sam Higginbottom University of Agriculture,Technology and Sciences,Prayagraj,211007,U.P,India
c Hemvati Nandan Bahuguna Garhwal University(A Central University),Srinagar(Garhwal),246174,Uttarakhand,India
Keywords:Near-saturated hydraulic conductivity Macropores Tillage Flow weighted mean pore radius Water-conducting macroporosity
A B S T R A C T Tillage plays an important role in modifying soil hydraulic properties.The objective of the present study was to evaluate the effect of conservation tillage practices in a maize-wheat cropping system on nearsaturated soil hydraulic properties and pore characteristics in the North-West Himalayan region,India.Three treatments viz.conventional tillage(CT),minimum tillage(MT),and zero tillage(ZT)were evaluated in terms of field saturated hydraulic conductivity(ks),unsaturated hydraulic conductivity k(h),the inverse of capillary length(α),flow-weighted mean pore radius(r0),numbers of pores per square meter(n0)and water-conducting macroporosity(Ɛ).The above hydraulic conductivity and pore characteristics were derived from steady-state water flux(q)measured using hood infiltrometer at 0,-1,and-3 cm pressure head for each treatment after seven years of establishment of this tillage experiment.Results revealed significantly(p<0.05)higher values of ks,k(h),α,andƐin ZT as compared with CT.MT had intermediate values.Higher α values suggested a greater gravity-dominated flow under ZT and MT as compared with CT.Analysis of r0 values indicated better connectivity of pores in ZT and MT as compared with CT.Macropore flow suggested that on average pore radii,>0.50 mm conducted about 63.60,68.01,and 75.97% of total flow(at 0 cm pressure head)in the corresponding water-conducting macroporosity of 0.00030,0.00044,and 0.00069%of soil volume under CT,MT,and ZT,respectively.Overall,zero-tillage based agriculture system was found to improve near-saturated soil hydraulic properties.
1.Introduction
Climate change,declining soil fertility,and soil degradation caused by inappropriate agricultural management practices are imposing serious threats to agricultural production leading to food insecurity for the global growing population(Mondal et al.,2020;Singh & Goyal,2018).There is a need to adopt climate-resilient sustainable and smart agricultural management practices that are capable of addressing these problems(Baranian Kabir et al.,2017;Eze et al.,2020;Lal,2014).But the success of these agricultural management practices depends on soil attributes such as soil hydraulic properties(SHPs)(Patra et al.,2019),organic matter(Lal et al.,2007),and nutrient content(Robinson et al.,2019).Among these,SHPs play a vital role to support sustainable agricultural management practices by regulating movement and retention of water and solute in the soil for creating optimal conditions for plant growth and crop establishment(Chandrasekhar et al.,2018;Weninger et al.,2019).Nevertheless,this is one of the most important properties of soil that can be modified by tillage practices owing to vicissitudes of macro-porosity(size,continuity,and volume)and hydraulic conductivity(Sun et al.,2018).Continual inversion of soil under intensive conventional tillage leads to structural degradation of soil resulting in reduced hydraulic conductivity,decreased available soil water,diminished aquifer recharge,and increased greenhouse gas emissions into the atmosphere(Bhatt et al.,2016;Castellini et al.,2019;Dalin et al.,2017;Patra et al.,2019).In this context,conservation agriculture(CA)is being recommended worldwide to increase the resiliency of agricultural production systems.CA comprising of minimum soil disturbance,crop residue management,and crop diversification provide a climate-resilient and carbon smart system by improving soil biological,chemical,and physical properties(Das et al.,2018;Dikgwatlhe et al.,2014;Parihar et al.,2016;Villarreal et al.,2020).Among these components of CA,conservation tillage(minimum or zero tillage)leads to improvement in soil structure and hydraulic conductivity by modifying soil pore size,continuity,and distribution(Eze et al.,2020;Schwärzel et al.,2011;Schwen et al.,2011;Sokolowski et al.,2020).Therefore,the knowledge of soil structural characteristics considering distribution and geometry of waterconducting porosity and near-saturated hydraulic conductivity under different agricultural management practices may provide insight into the resiliency of such systems.
The hydraulic properties of soil near saturation are very important for water and solute transport processes that normally occur with the highest rates near saturation(Bagarello et al.,2005;Watson&Luxmoore,1986).Field measurements of near-saturated hydraulic conductivity are used to indirectly characterize the soil macroporosity under different soil and land-use management practices(Kabir et al.,2020;Kelishadi et al.,2014).A common method to assess structure-related hydraulic properties is the tension disc infiltrometer(Ankeny,1992;Ankeny et al.,1991;Reynolds et al.,1995;Reynolds & Elrick,1991).However,this method disturbs the soil surface to some extent possibly altering the macropores.As macropores are responsible for more than 70%of the water flux(Bodhinayake & Si,2004;Patra et al.,2019),undisturbed measurement techniques may be more appropriate for accurately estimating the impact of land-use and management practices on soil macrostructure.In this context,hood infiltrometer(a special type of tension infiltrometer developed in recent years)(Schwärzel & Punzel,2007)can measure steady-state infiltration rates under negative pressure heads(up to bubbling point(BP)of soil)without soil disturbance and various water transmission properties e.g.flow weighted mean pore radius,water-conducting porosity can be derived(Patra et al.,2019;Reynolds et al.,1995;Schwärzel et al.,2011)from these measurements.The major advantage of this infiltrometer is that it is an in-situ,portable and non-destructive technique which preserves soil structural property.
Several studies have been conducted worldwide on potential management induced changes in SHPs particularly in relation to tillage systems such as in Canada(Bodhinayake & Si,2004),China(Hu et al.,2012),Italy(Castellini et al.,2019),Germany(Kreiselmeier et al.,2020;Schlüter et al.,2018),USA(Çerçioğlu et al.,2019)and UK(Eze et al.,2020).However,tillage induced changes in SHPs are site-specific(Kargas et al.,2016;Sun et al.,2018)and dependent on climate and cultivation history(Baranian Kabir et al.,2020;Bodhinayake & Si,2004;Kreiselmeier et al.,2019).Also,very few field studies(Patra et al.,2019)have been conducted in India evaluating the effect of conservation tillage practices on near-saturated SHPs.Therefore,the present study investigates the effect of conservation tillage practices on nearsaturated SHPs in a long term field experiment(07 years)in the foothill of the North-West Himalayan Region of India(NWHRI).We hypothesized that the conservation tillage practices enhance macroporosity and increase saturated and near-saturated hydraulic conductivity.Hence,the objective of the study was to quantify the impact of conventional tillage(CT),minimum tillage(MT),and zero tillage(ZT)on a)field saturated(ks)and unsaturated hydraulic conductivity(k(h))and b)pore characteristics including the inverse of capillary length(α),flow-weighted mean pore radius(r0),numbers of pores per square meter(n0),and water conducting macroporosity(Ɛ).
2.Materials and methods
2.1.Experimental site
The experimental site is located at Selakui,ICAR-Indian Institute of Soil and Water conservation Dehradun,Uttarakhand,India(30°20′′57′N and 77°52′′07′E.)in the North-West Himalayan foothill region.This experiment was started in 2011 to assess the effect of tillage management practices on soil erosion and soil organic carbon loss in maize-wheat cropping system under rainfed condition.The experimental site is characterized by a sub-tropical condition with strong monsoonal influence.The mean monthly maximum and minimum temperatures were recorded as 29.2°C and 13.9°C,respectively.May and January are the hottest and coldest month respectively.The region receives an average annual rainfall of 1615 mm of which~81 % occurs in the monsoon season(June-September).Most of the monsoon months are highly humid whereas April and May are the driest months.The soil type of experimental site is categorized as fine mixed hyperthermic Typic Udorthents(Singh et al.,2017;Soil Survey Staff,2014).As per soil taxonomy,the soil belongs to Entisols which are derived from heavy-textured,deep alluvium,yellowish-brown to dark yellowish-brown in colour,granular in structure with few gravels and coarse rock fragments(<2 %)(Bhardwaj,S.P.& Singh,P.N.,1981).At the beginning of the field experiment,the topsoil(0-10)layer had pH(1:2.5,H2O)5.4,EC 0.09 dSm-1,organic carbon 0.61%.The texture of the soil was sandy loam with 54.4%sand,26.4%silt,and 19.2 % clay.The initial soil bulk density was 1.42 g cm-3.
2.1.1.Treatments
The field experiment was conducted in rainfed maize-wheat cropping systems varying in three different tillage practices such as conventional tillage(CT),minimum tillage(MT),and zero tillage(ZT).These field plots were arranged in three large strips and each strip having an area of 450 m2(75 m×6 m)as shown in Fig.1.All the activities in the CT plot were undertaken following local farmers’practice.In general,six passes of tractor-drawn tyne cultivator followed by planking was carried out to till the soil for seedbed preparation,and seeds were sown by manual broadcasting in both crops.In the MT plot,seedbed preparation was performed by three passes of tyne cultivator followed by planking.Escort®multiple crop planter was used for sowing wheat seed and for maize manually row broadcasting was done.In the ZT plot,direct sowing of crops was done using Escort® multiple crop planter.As maize stubble is fed to animals in the region,only 25 cm stubble was left on the field following farmers’practice.An estimated average residue of 5.09,5.58,and 6.94 t ha-1yr-1from stubble,grass,and root mass,was added to CT,MT,and ZT treatments,respectively,in 7 years of the experiment.
2.2.Field and laboratory measurements
2.2.1.Hood infiltrometer measurements
Steady-state infiltration rates were measured in CT,MT,and ZT plots,at pressure head 0,-1,and-3 cm in the last week of February 2018(at the maximum crop growth stage of wheat)using a hood infiltrometer with five replications following the procedure described by Schwärzel and Punzel(2007).We conducted the infiltration experiment in actively growing wheat fields to account for any potential effect of crop roots on near-saturated SHPs.All infiltration experiments were conducted on visibly dry soil.The descending order of three supply pressure head(h)was adopted from close to saturation down to the BP of the soil.Furthermore,the BP of soil for every experimental location was also measured.A hood infiltrometer is used to measure infiltration up to the BP of soil.BP of soil is reached when the supply potential(h)inside the hood is sufficient to draw air from the largest saturated pore and that supply potential(h)inside the hood cannot be kept stable any more(Schwärzel & Punzel,2007).
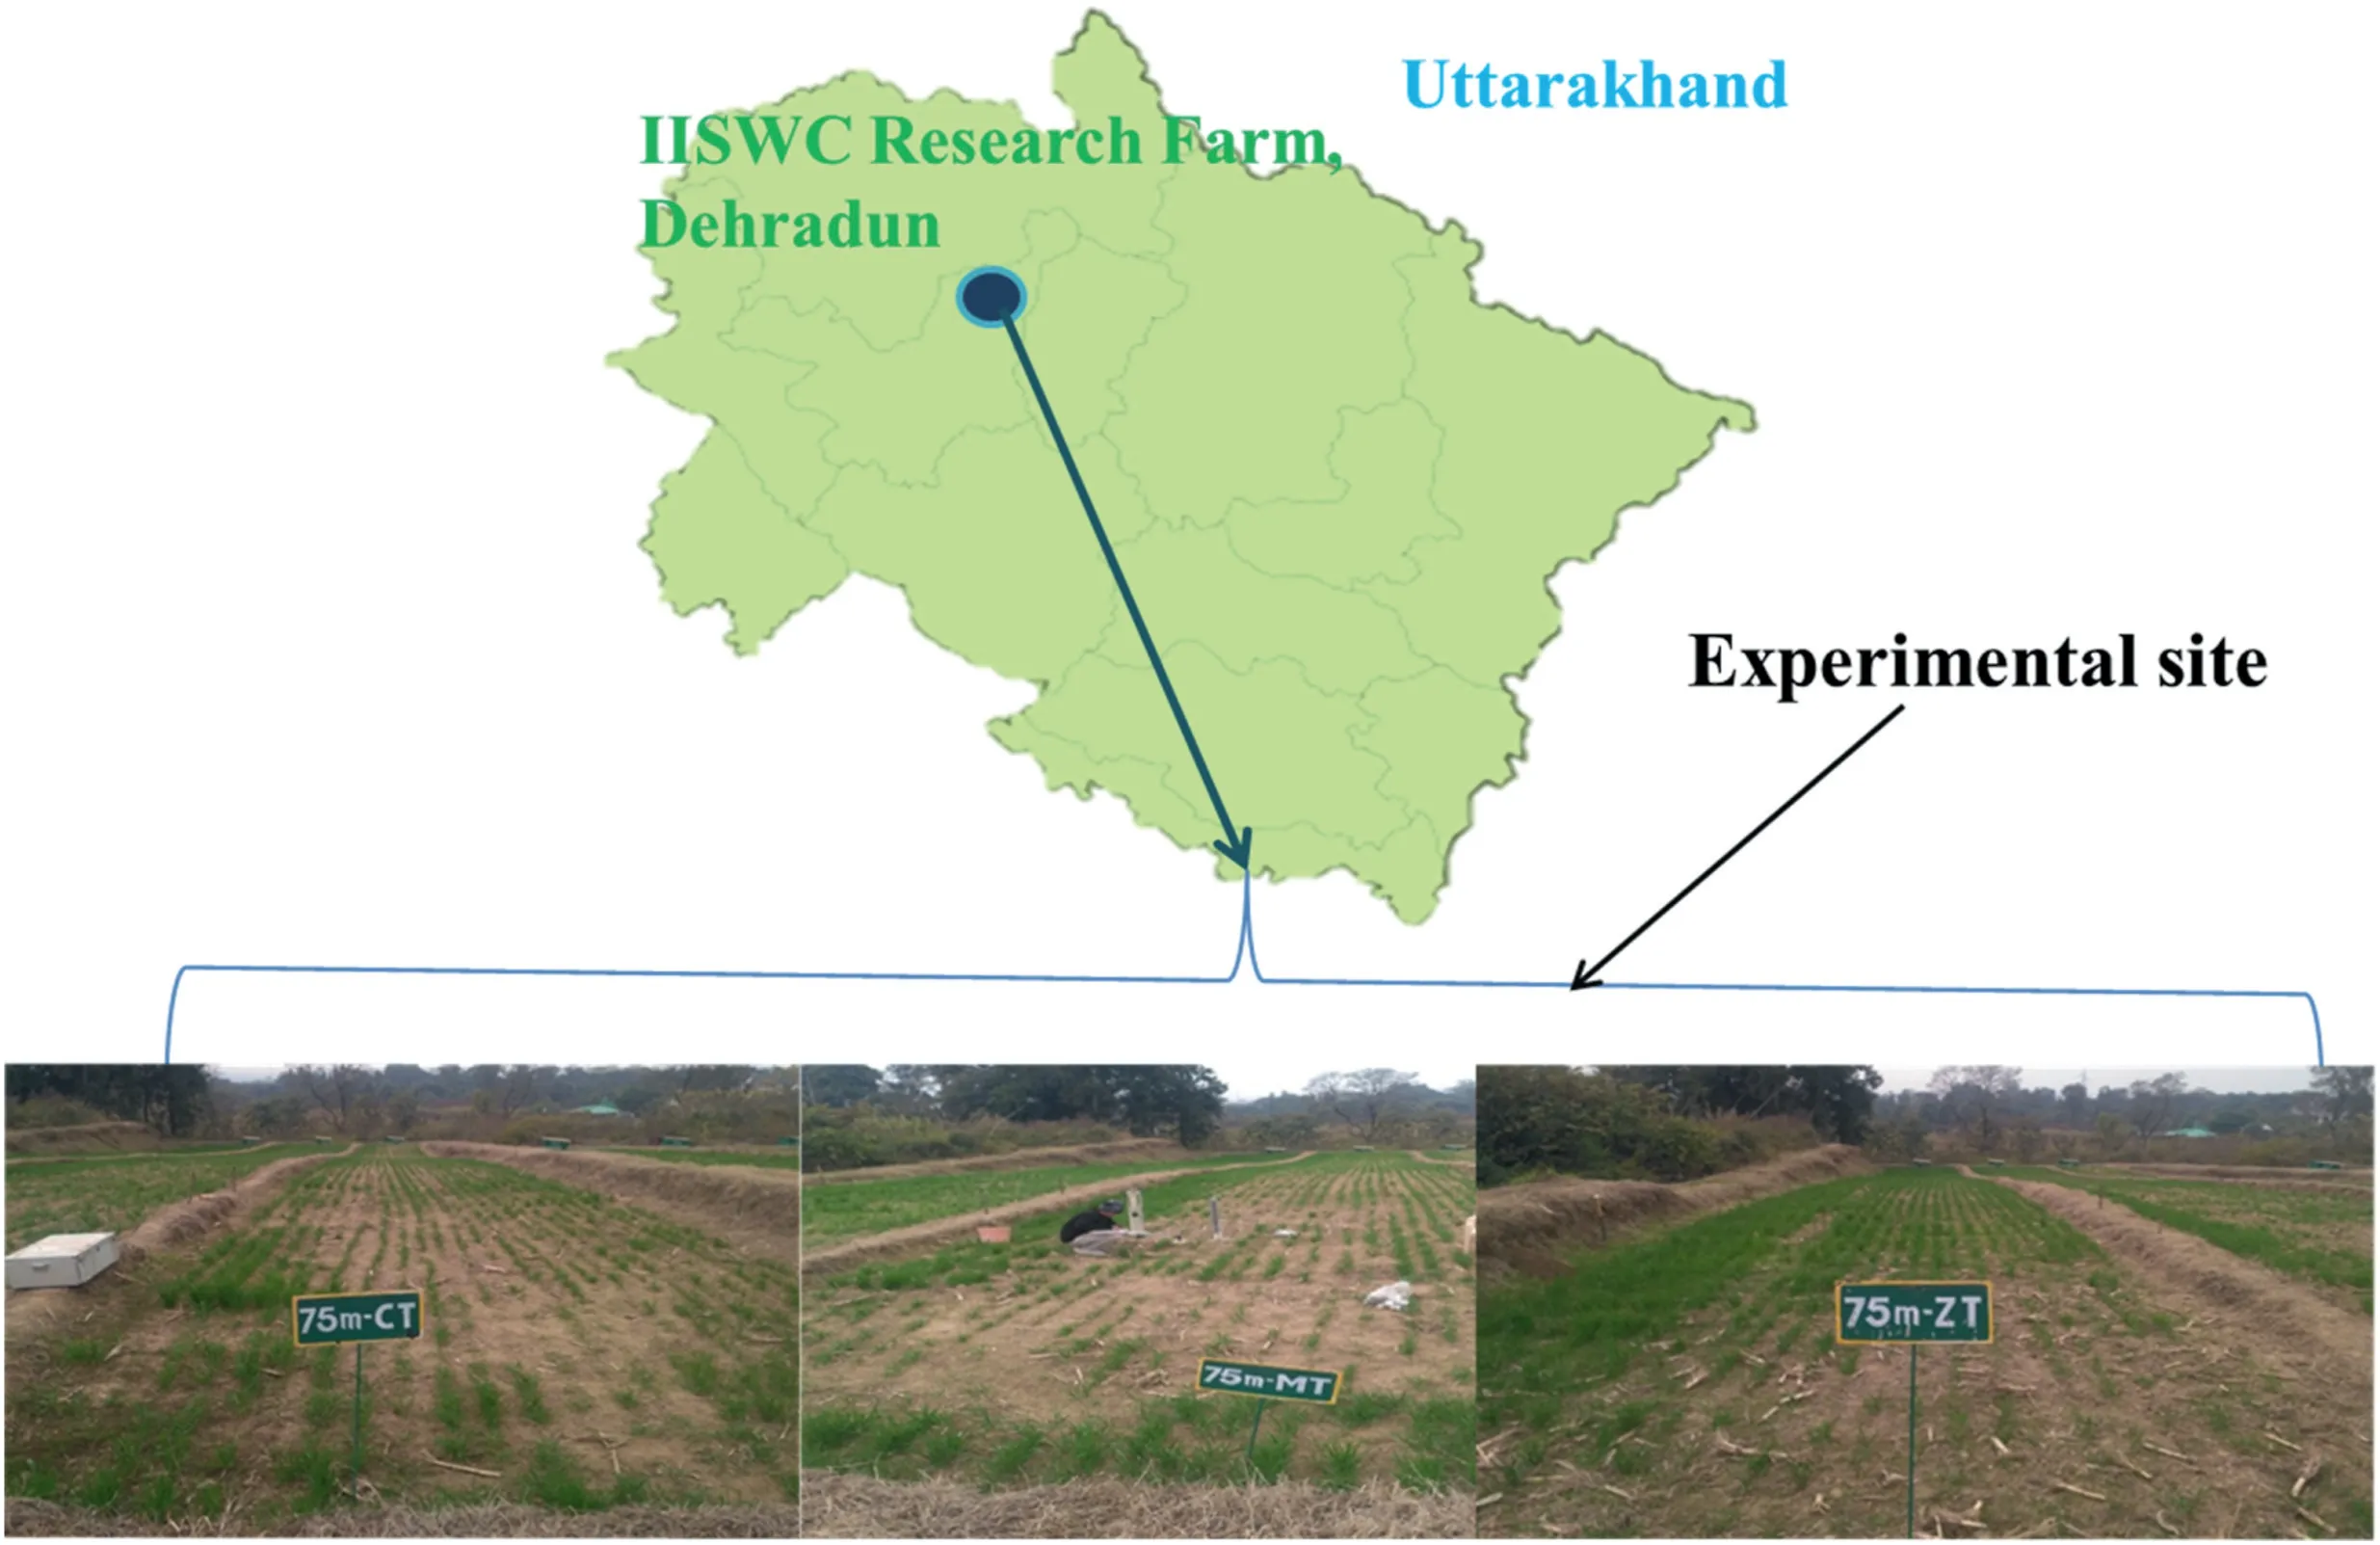
Fig.1.Over view of the experimental plots at ICAR-Indian Institute of Soil and Water Conservation,Research Farm,Dehradun.Treatments are conventional tillage(CT),Minimum tillage(MT)and Zero tillage(ZT).
2.2.2.Soil sampling and analysis
Soil cores and excavated samples were collected from beneath the hood after each set of infiltration experimental sites to determining the bulk density and soil aggregate mean weight diameter in the topsoil(0-5 cm).A Core method was used to determine the bulk density of soil using a stainless-steel core(5 cm internal diameter and 5 cm height).Collected core samples from each location were oven-dried at 105°C for 24 h to obtained dry weight.Recorded dried soil weight was dividing by core volume to find out the bulk density of soil(Blake & Hartge,1986).
Soil aggregate analysis was performed with wet sieve methods using the Yoder apparatus(Yoder,1936).Dried samples were broken either by hand or natural failure to get a range of less than 10 mm in size.Loose pant roots,leaves,and gravel or pebbles available in aggregate samples were carefully removed.Less than 10 mm of aggregate size soil samples were passed through a 10 mm sieve and retained on an 8 mm size sieve.100 g dry soil samples,thus prepared,were uniformly spread to the uppermost sieves(4 mm diameter)in a set of sieves with diameter 0.125,0.25,0.50,1.0,2.0,and 4.0 mm.The samples were kept for 25 min on the wet sieves for capillary rewetting and thereafter,a nest of sieves was shaken in a water drum for 30 min with the help of an electric motor and pulley arrangement.Water stable aggregates of different sieves were collected separately in different size range i.e.0.0-0.125,0.125-0.25,0.25-0.50,0.50-1.0,1.0-2.0,2.0-4.0 and 4.0-8.0 mm and oven-dried at 65-70°C until constant weight was achieved.Mean weight diameter(MWD)was calculated using the formula given by Kemper and Rosenau(1986):
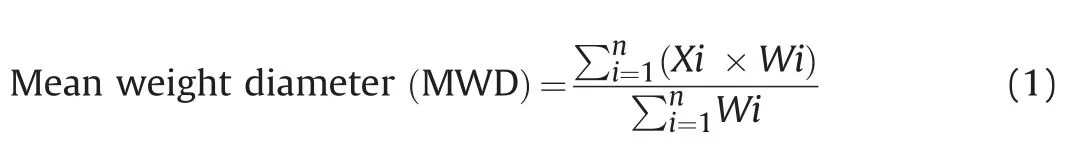
Where Xiis the mean diameter in mm of a given sieve size,Wi is the retained weight(g)of aggregate on the ithsieve and n is the number of aggregate size fraction.
Also,soil samples(0-10 cm depth)were collected from the vicinity of each infiltration site to determine soil particle size distribution(PSD),organic carbon(SOC),and soil pH.Collected samples were air-dried,gently ground to pass through a 2 mm sieve for further analysis.PSD was determined by a method described by Piper(1966).Further,a textural class was determined as per the United States Department of Agriculture(USDA)system(Soil Survey Staff,2014).The SOC was determined using the Walkley and Black method(Walkley & Black.,1934).Soil pH(1:2.5,H2O)was determined using a digital pH meter(Model:Orion 5-star Thermo Scientific,Thermo Fisher Scientific Inc.USA).
2.3.Data analysis
The collected data from the infiltration experiment were analyzed by the following procedure.Firstly,Wooding’s analytical approach was performed to draw a relation between hydraulic conductivity and pressure head(Wooding,1968).Afterward,the same hydraulic conductivity data was used to calculate the flowweighted mean pore radius following the procedure of Reynolds et al.(1995).The water-conducting porosity was estimated using the procedure proposed by Bodhinayake and Si(2004).
2.3.1.Calculation of saturated and near-saturated hydraulic conductivity from infiltration experiments
The saturated and unsaturated hydraulic conductivities[(ksand k(h)(mm hr-1),respectively)]were estimated following the procedure adopted by Ankeny et al.(1991)and Reynolds and Elrick(1991)from the measured steady-state infiltration rates.Steadystate unconfined infiltration rate from a circular source with a constant pressure head at the soil surface,assuming an initially dry soil,can be estimated analytically according to Wooding(1968):

where q(h)(mm3hr-1)is steady-state infiltration rate,r(mm)is the radius of the hood,k(h)(mm hr-1)is the hydraulic conductivity corresponding to inlet matric suction h and α(mm-1)is the inverse of capillary length.In the above equation,the first and second term on the right-hand side stands for the flow of water caused by gravitational force as well as capillary force and geometry of supply source,respectively.
Based on Wooding’solution(Wooding,1968)from the above equation,estimates are obtained for the parameters in Gardner’s exponential model(Gardner,1958)of the unsaturated hydraulic conductivity function:

where ks(mm hr-1)is the saturated hydraulic conductivity and h(cm)is the matric suction.Hence,Wooding’s solution has two unknown parameters such as k(h)or ksand α.These parameters were first calculated using multiple head method at two sets of paired head values of 0 and-1 cm.,-1 and-3 cm.The means of predicted parameters were used as first approximations for the best-fit predictions.The following equation was found after substituting Eq.(3)into Eq.(2):

By substituting hiand hi+1in place of h in above equations we get,
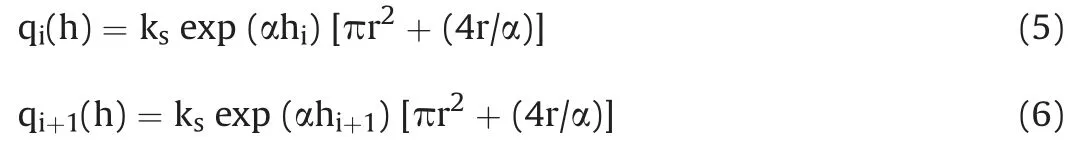
Fitting parameter α was obtained by solving the above two equations
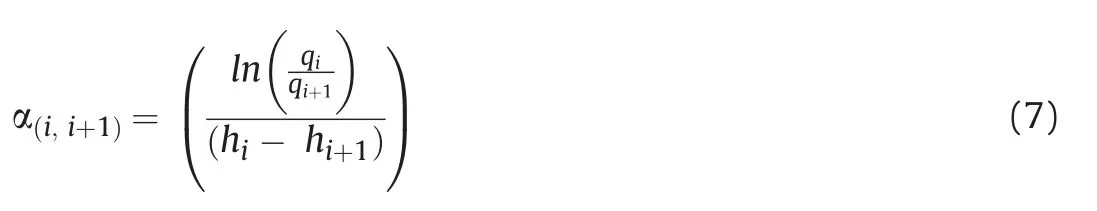
A piece wise estimation was adopted for calculation of k(h)for different pressure head i.e.0,-1 and-3 cm as α varies due to the variation of water potential in structured soil(Ankeny et al.,1991;Clothier & Smettem,1990).The following equations were used to estimate k(h)with respect to pressure heads 0,-1 and-3 cm,represented hereafter as k(0),k(-1)and k(-3),respectively.
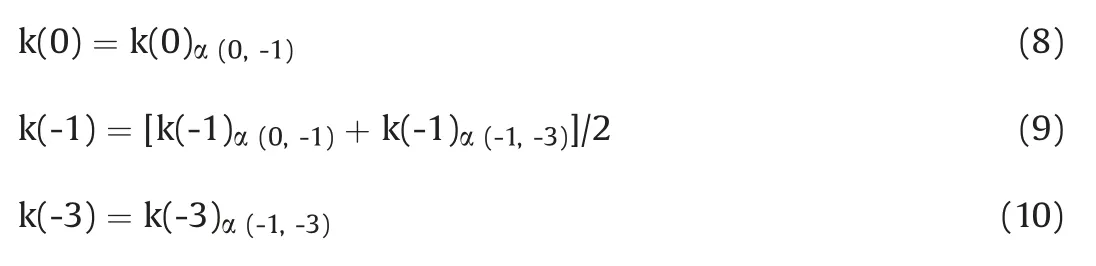
The k(0)was considered as the saturated hydraulic conductivity(ks).
2.3.2.Soil pore characteristics
2.3.2.1.Flow weighted mean pore radius.An important soil structure parameter derived from the hood infiltration measurement is the flow-weighted mean pore radius(r0)(mm)which represents an effective equivalent mean pore radius that is conducting water at a certain supply pressure head.This parameter has been used to characterize tillage-induced changes in water-conducting macropores and mesopores(Bodner et al.,2008;Patra et al.,2019;Reynolds et al.,1995;Schwen et al.,2011).The r0is represented as(Reynolds & Elrick,1991):

Where,σ(g hr-2)is the surface tension of water,k0(mm hr-1)is the soil hydraulic conductivity corresponding to supply potential(h0),ρ(g mm-3)is the density of water,g(mm hr-2)is the acceleration due to gravity,and φ0(mm2hr-1)is the matric flux potential of soil that is measured over the pore water pressure head range,where pores are considered to be water-conducting.Following Gardner(1958),φ0is defined by:
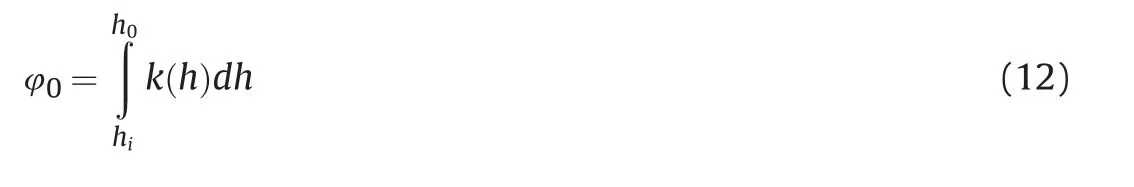
where h0(cm)is the soil surface pressure head and hi(cm)initial pore water pressure head in the unsaturated soil.
Moreover,According to Reynolds et al.(1995),the matric flux potential of soil is split into two parts viz.residual flux potential(φr)and tension flux potential(φt).The values of φrwere estimated by following Wooding’s(1968)relationship:
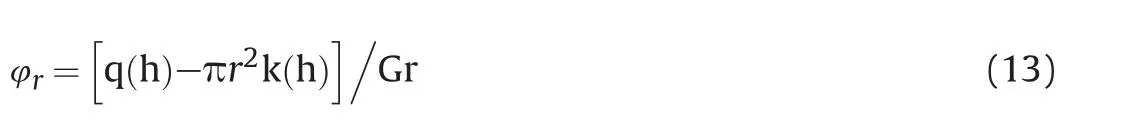
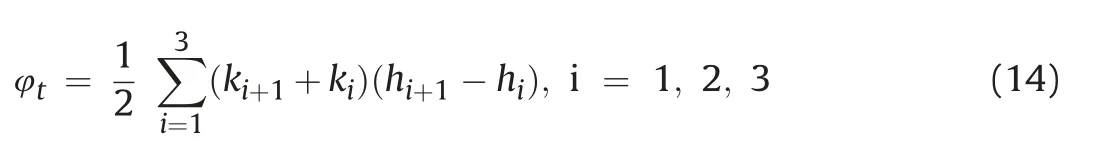
where,k(h)(mm hr-1)and q(h)(mm3hr-1)is the hydraulic conductivity and steady-state flow rate at the lowest supply head of the sequence(-3 cm in our case),respectively,G is a dimensionless shape factor(4·219)(Reynolds&Elrick,1991)and r is the radius of the hood.The φtvalues were determined by numerically integrating k(h)vs.h curve using the cubic spline technique(Iovino et al.,2016;Patra et al.,2019)as given in the following equation,
The number of pores per unit soil surface area(n0)was calculated by using poiseuille’s law:
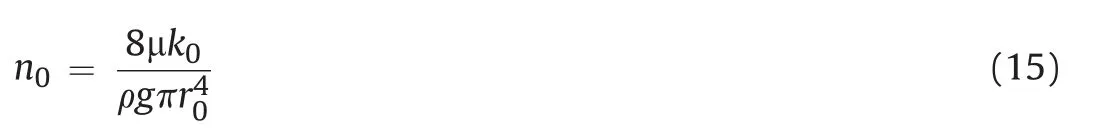
Where,μ(g mm-1hr-1)is the dynamic viscosity of water,in this experiment,it was considered as 3.60 g mm-1hr-1at 20°C water temperature(Kestin et al.,1978;Marvin,1971;Nagashima,1977),k0(mm hr-1)is the soil hydraulic conductivity corresponding to pore radius(r0),ρ(g mm-3)is the density of water,g(mm hr-2)is the acceleration due to gravity.
Furthermore,the classical capillary rise equation was used to estimate maximum equivalent pore radius(rmax)(mm)at a specific soil water pressure head(h)(Reynolds et al.,1995;Vomocil,1965):
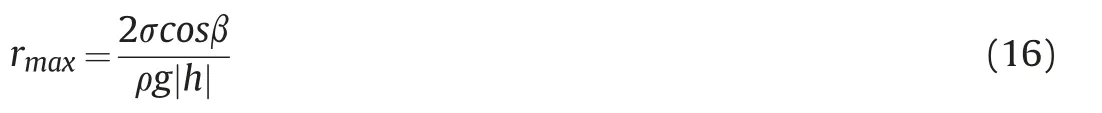
Where σ(g hr-2)is the surface tension of water,β is the contact angle between the water-air interface and the solid phase,ρ(g mm-3)is the density of water,and g(mm hr-2)is the acceleration due to gravity.The value of ρ was considered 0.001 g mm-3,g was 1.27×1011mm hr-2and σ was set at 9.4×10⁸g hr-2at 20°C water temperature.,β was assumed to be 0(Buczko et al.,2006;Schwen et al.,2011).
The rmaxis represented as a maximum equivalent pore radius for water storage;whereas r0is based on the average equivalent pore radius considering the entire range of pore sizes contribution towards the water transmission.In the capillary approach,it is assumed that the flow in pores is laminar,full of water,and not interconnected,whereas water transmission is greatly influenced by entrapped air bubbles,small unwetted zones,tortuosity,and bottleneck,etc(Reynolds et al.,1995).Therefore,the index r0,which primarily accounts for flow impedances,is preferable to rmaxin characterizing the ability of a soil to transmit water to the deeper layers(Iovino et al.,2016;Reynolds et al.,1995).
2.3.2.2.Water-conducting porosity.To characterize the waterconducting porosity of the soil,infiltration rate differences at two adjacent pressure heads were required(Bodhinayake & Si,2004;Buczko et al.,2006;Schwen et al.,2011;Watson&Luxmoore,1986).According to the proposed procedure of Bodhinayake et al.(2004),water-conducting porosity was estimated from the hydraulic conductivity in the pressure head interval corresponding to the two pore radii r1and r2given by:
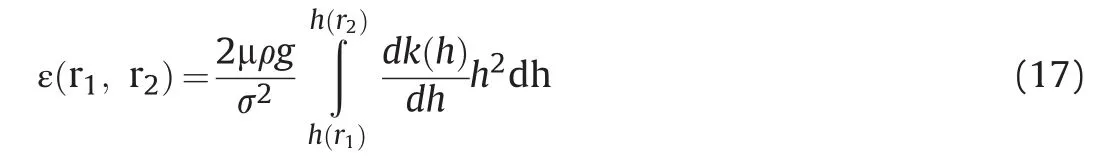
where,ε(r1,r2)(mm3mm-3)is the water-conducting porosity of soil corresponding to the two pore radii r1and r2,μ is the dynamic viscosity of water(g mm-1h-1),taken here as 3.60 g mm-1hr-1(Kestin et al.,1978;Marvin,1971;Nagashima,1977).
An analytical solution of the above(17)equation was developed by Bodhinayake et al.(2004)to calculate the water-conducting porosity by using Gardner’s exponential relationship(Eq.(2)).The solution is given as:
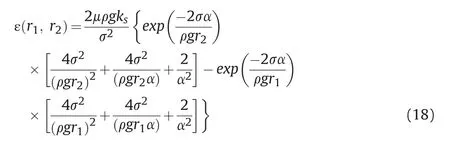
Where,ε(r1,r2)is the water-conducting porosity in a given pressure head range(mm3mm-3),and α is Gardner’s inverse capillary length scale(mm-1).
The pore radius at 0 cm pressure head was assumed as 2.50 mm as the same can not be derived from equation(16).This may be a reasonable approximation to represent the macropores created by earthworm and other soil faunas.Moreover,careful visual inspection of the infiltration surface did not reveal any bigger pores.Bodhinayake and Si(2004)and Patra et al.(2019)have made a similar assumption for their experiments using a tension infiltrometer and hood infiltrometer,respectively in different agricultural land uses.
2.4.Statistical analysis
Data were checked for normality using the Shapiro-Wilk test(Alva& Estrada,2009).Natural log-transformation was performed for ks,k(h),and alpha values wherever necessary.One-way analysis of variance(ANOVA)was done to test statistical significant differences at p 0.05 among the treatment mean values for parameters such as SOC,PSD,water-conducting porosity,ks,k(h),and alpha.Multiple comparisons of means were done by the least significant difference test(LSD(Webster,2007);).All statistical analyses were performed using SPSS(16)software.
3.Results and discussion
3.1.Soil physical properties
Results for PSD and SOC of the top layer of soil(0-10 cm)for different treatments are presented in Table 1.The dominant soil texture classes among the treatments were sandy loam.The sand,silt,and clay fractions did not show a significant difference(p<0.05),suggesting that the treatments had intrinsically similar soil texture(Table 1).Similar soil textural composition among the treatments indicates that the changes in SHPs may be mainly governed by tillage treatments and soil management practices.The results revealed that the SOC was significantly affected by different tillage practices.The values followed the trend;zero tillage(ZT)>minimum tillage(MT)>conventional tillage(CT).The mean SOC value was found to be significantly higher(p<0.05)under treatment ZT(0.858±0.08%)as compared with MT(0.748±0.04)and CT(0.706±0.02).However,there was no significant difference(p<0.05)in SOC between CT and MT.The higher SOC content in conservation tillage practices may be attributed to crop residue retention and subsequent stratification of SOC(Zhao et al.,2015).Moreover,the increased amount of SOC content in conservation tillage practices over conventional tillage was also indicated through the significantly lower bulk density(Fig.2).The bulk density differed significantly(p<0.05)between conservation tillage practices and conventional tillage.The CT treatment had by far the highest bulk density(1.47 g cm-3)as compared to ZT(1.30 g cm-3)and MT(1.36 g cm-3),whereas,ZT and MT treatments were not statistically significant(p<0.05)(Fig.2).Other studies show similar findings where a greater bulk density value in CT have been reported as compared with ZT and MT(Alletto & Coquet,2009;Patra et al.,2019).These variations in the bulk density are likely because of the combined effect of soil organic carbon,interaggregate pore changes,crop root density,and different tillage management practices.Cavalieri et al.(2009)reported a similar trend for the maize-wheat cropping system and they emphasized that higher amounts of organic carbon resulted in smaller bulk densities in zero tillage as compared to conventional tillage.Also,SOC may be exposed by intensive mechanical manipulation of soil leading to accelerated microbial decay in conventional tillage,thus lowering the SOC.Compaction of soil by frequent use of machinery can further contribute to higher bulk density in CT plots(Patra et al.,2019).Further,our study area is located in a high rainfall region that may lead to the generation of runoff causing soil erosion as well as soil compaction more in tilled soil.
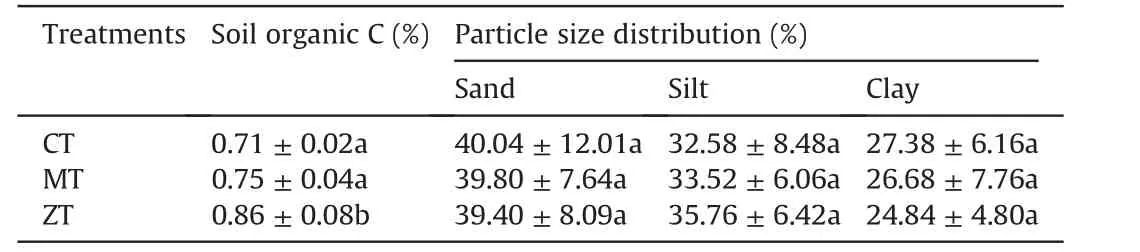
Table 1 Soil organic carbon and particle size distribution under different treatments.Statistical comparison indicates if changes among the treatments are significantly different at p≤0.05 that is shown by different letters.Same letters are not significantly different.Values in parenthesis(±)denote the standard deviation of five replications.Treatments are conventional tillage(CT),Minimum tillage(MT)and Zero tillage(ZT).
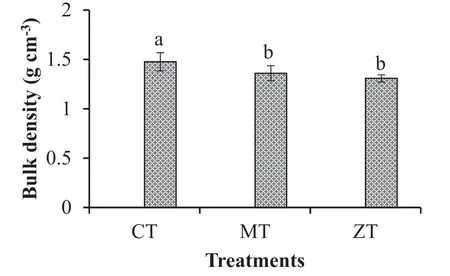
Fig.2.Soil bulk density under different treatments.Statistical comparison indicates if changes among the treatments are significantly different at p≤0.05 that is shown by different letters.Same letters are not significantly different.Vertical bars of each column represent standard deviation of five replications.Treatments are conventional tillage(CT),Minimum tillage(MT)and Zero tillage(ZT).
Moreover,comparisons of aggregate mean weight diameter(AMWD),as affected by different treatments,are presented in Fig.3.The AMWD differed significantly among the tilled and untilled treatments(p<0.05).The AMWD values were significantly greater in the ZT than in the MT and CT(p<0.05)likely as a result of higher soil organic content which may have enhanced aggregate stability and percentage of stable aggregate(Parihar et al.,2016;Six et al.,1999).Patra et al.(2019)also observed a positive relationship of AMWD with soil organic content.Overall,conservation tillage practices were found to improve the soil’s physical properties as compared to conventional intensive tillage practices.
3.2.Saturated and near-saturated hydraulic conductivity
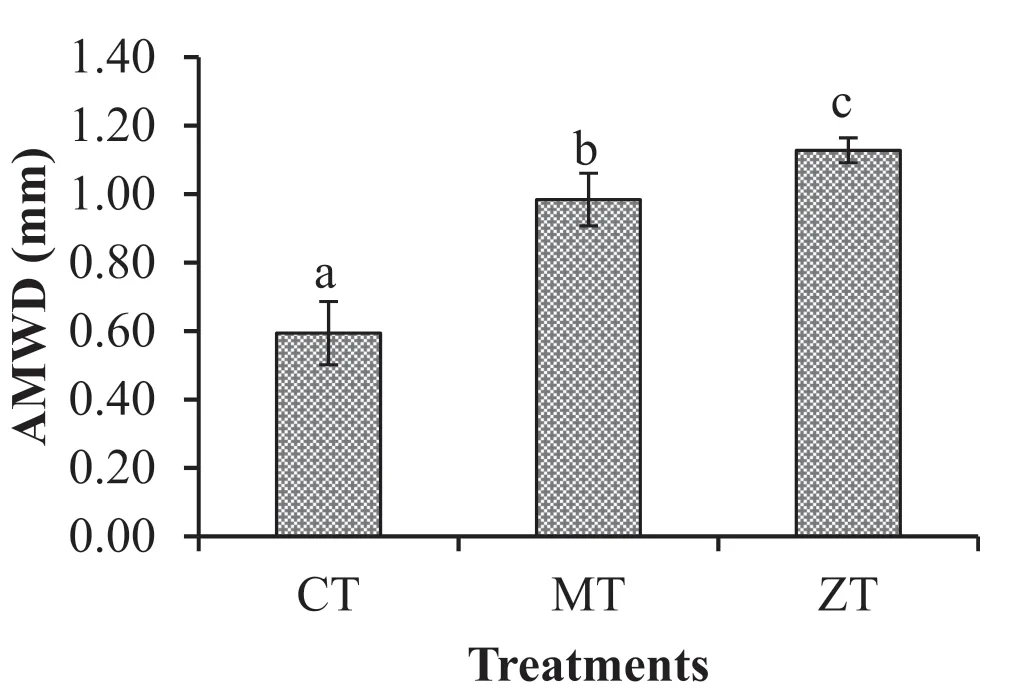
Fig.3.Aggregate mean weight diameters(AMWD)under different treatments.Statistical comparison indicates if changes among the treatments are significantly different at p≤0.05 that is shown by different letters.Same letters are not significantly different.Vertical bars of each column represent standard deviation of five replications.Treatments are conventional tillage(CT),Minimum tillage(MT)and Zero tillage(ZT).
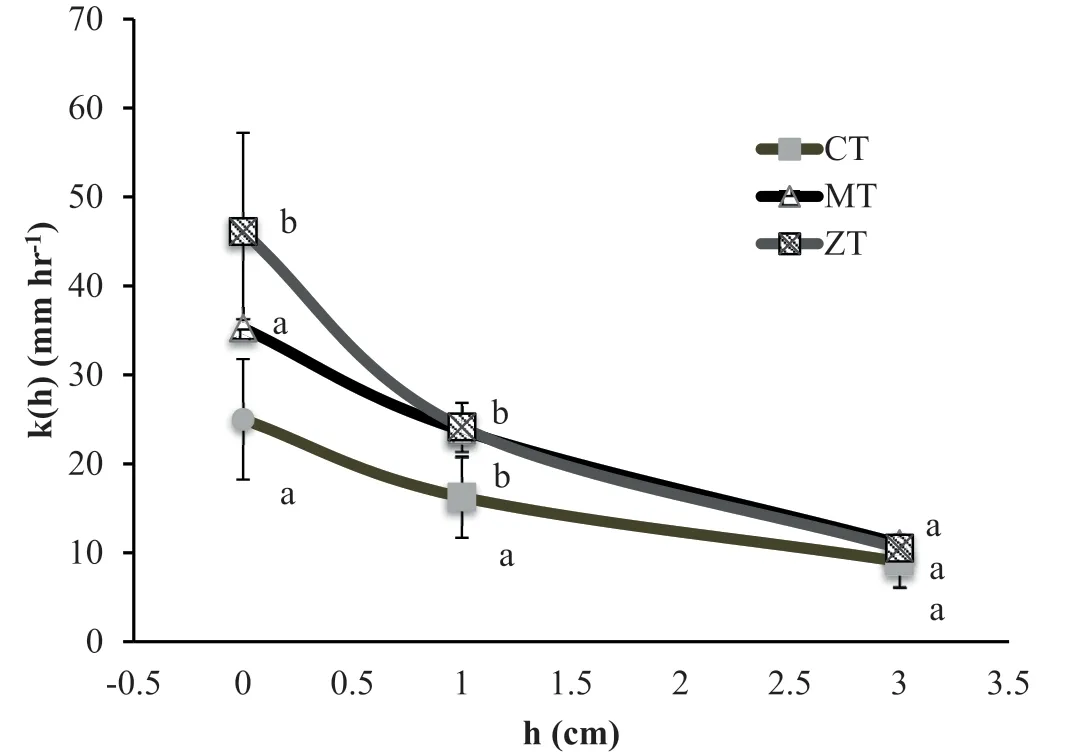
Fig.4.Hydraulic conductivity k(h)vs.supply pressure head(h)curves for different treatments.Statistical comparison indicates if changes among the treatments are significantly different at p≤0.05 that is shown by different letters.Same letters are not significantly different.Vertical bars represent standard deviation of five replications.Treatments are conventional tillage(CT),Minimum tillage(MT)and Zero tillage(ZT).
The saturated,(ks),and unsaturated soil hydraulic conductivity,k(h),values derived from the measured steady-state infiltration rates at 0,-1,and-3 cm pressure heads using Wooding’s(1968)analytical solution for different tillage practices are presented in Fig.4.The mean field saturated hydraulic conductivity(k(0))value was the highest under ZT(46.11 mm hr-1)followed by MT(35.25 mm hr-1),and CT(25 mm hr-1).A similar trend was also observed for k(-1)values with the highest value in ZT(24.13 mm hr-1),followed by MT(23.75 mm hr-1)and CT(16.25 mm hr-1).However,for k(-3)values,MT had the highest value(11.03 mm hr-1)followed by ZT(10.50 mm hr-1)and CT(9.01 mm hr-1).These trends signify differences in soil structural changes induced by the different tillage practices in near-saturated conditions.The mean k(0)value in ZT was significantly(p<0.05)higher than both MT and CT.However,mean k(-1)values in both ZT and MT were significantly(p<0.05)higher than CT.No significant(p<0.05)difference was found between CT and MT for k(0)values and between ZT and MT for k(-1)values.The k(-3)values were not statistically different(p<0.05)for all three tillage practices.Fig.4 also shows that the hydraulic conductivities decreased with the increase in supply pressure heads in all tillage treatments.The sharpest drop in hydraulic conductivity was observed in ZT followed by MT and CT.This indicated that as matric suction head decreases the number and size of water-conducting pore reduces.Conversely,this means that the size and continuity of pores increased in the order ZT>MT>CT as the soil hydraulic condition approached saturation.Similarly,Castellini and Ventrella(2012)reported that as matric suction decreased from-2 to-10 cm the k(h)values decreased nearly an order of magnitude.Bodner et al.(2008)found a four-fold decrease in k(h)values when the pressure head decreased from-2 to-15 cm.Patra et al.(2019)also observed the decreasing trend of k(h)in different conservation agricultural practices as pressure head reduced from 0 to-4 cm.
The characteristic changes in SHPs in conservation agricultural systems may be influenced by various factors such as soil types,crop rotation,fertilization,crop residue retention,and climatic factors.However,in the present study,different tillage practices(i.e.CT,MT,and ZT)were the main influencing factors(beside marginally higher crop residue retention in MT and ZT)whereas other factors remained the same Hence,the higher values of saturated and near-saturated hydraulic conductivity in conservation tillage practices(i.e.ZT and MT)in our study may,thus,be primarily attributed to higher residue retention and uncompacted topsoil layer(avoiding extensive use of machinery)providing a favorable condition for a better growth of soil fauna and earthworms leading to increased creation of soil macropores(Zhao et al.,2015).However,in CT the soil is subjected to intensive manipulation and inversion which might have destroyed the networks and continuity of macropores resulting in a reduction in pore size and hydraulic conductivity(Bodhinayake et al.,2004).Additionally,our experiment was conducted in a high rainfall zone which may produce higher overland flow causing higher soil erosion as well as soil compaction in intensively tilled soil thereby further decreasing hydraulic conductivity in CT.These findings are supported by several previous studies.Patra et al.(2019)found that ZT treatment had a larger k(h)value at saturation with greater variation as compared to MT and CT treatments.Kreiselmeier et al.(2020)showed higher k(h)values in conservation tillage practices as compared with conventional tillage.
The inverse of macroscopic capillary length(α)was derived from the q(h)vs.h relationship(Eq.(6)).It is a shape parameter of q(h)function which indicates the flow behavior in a porous medium and measures the relative importance of capillary and gravitational forces(Reynolds & Elrick,1991).Results(Fig.5)showed significantly(p<0.05)larger α values in conservation tillage practices(i.e.ZT and MT)than CT.The trend of α values among the treatments was ZT>MT>CT(Fig.5).This shows that the flow of water at near saturation in ZT treatment was more controlled by gravitational force as compared with MT and CT treatments signifying the role of macropores in infiltration processes,particularly under near-saturated conditions.
Furthermore,macropore flow or tension flux potential(φt)for the whole pressure head ranges(i.e.,from 0 to-3 cm)was analyzed to comprehend the impact of conservation tillage practices on water flux in near-saturated condition.Values are presented in Fig.6.The φtfollowed a similar trend as hydraulic conductivity,k(h),values,The highest value of φtwas found in ZT and differed significantly(p<0.05)from CT.The CT treatment has by far the lowest φtas compared to ZT and MT,whereas,ZT and MT treatments were not significantly different.Similar trends were also presented by other studies(Iovino et al.,2016;Schwen et al.,2011),where a higher φtvalue was reported for ZTcompared to CT and MT.These variations in the φtare likely because of the combined effect of soil organic carbon and interaggregate pore leading to higher infiltration flux in ZT.Additionally,we also observed higher AMWDs in conservation tillage practices which might increase the interaggregate pore space thereby contributing to higher infiltration flux as compared with CT.
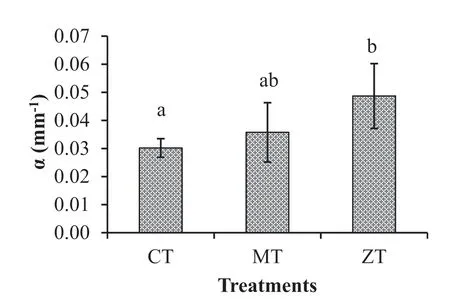
Fig.5.Inverse of capillary length(α),mm-1 of pooled data of 0 to-3 cm of different treatments.Statistical comparison indicates if changes among the treatments are significantly different at p≤0.05 that is shown by different letters.Same letters are not significantly different.Vertical bars of each column represent standard deviation of five replications.Treatments are conventional tillage(CT),Minimum tillage(MT)and Zero tillage(ZT).
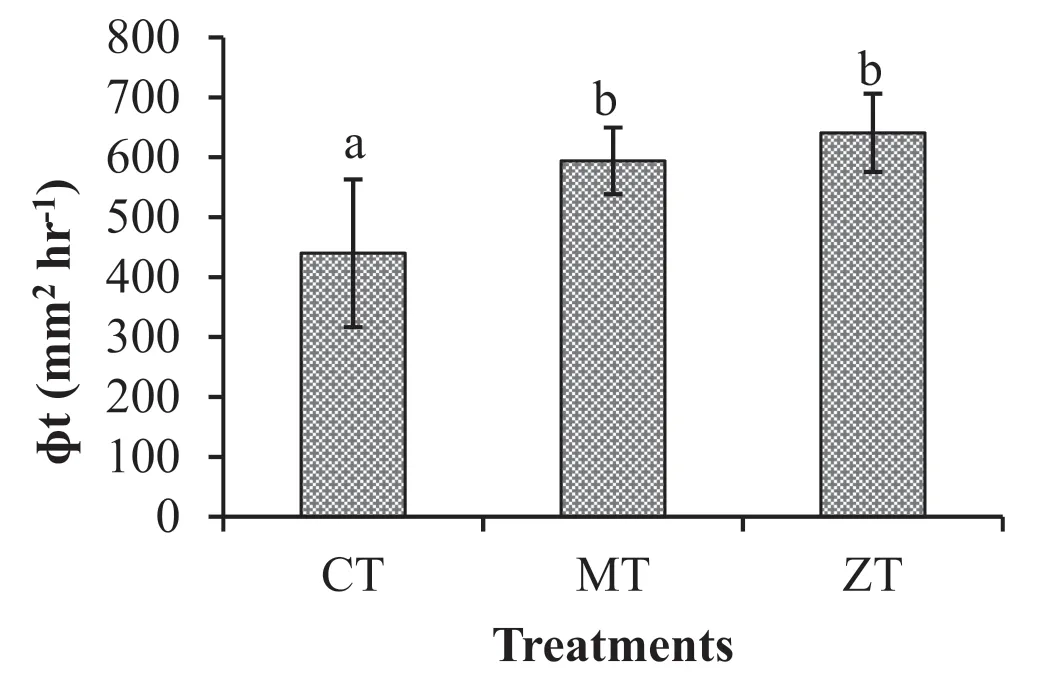
Fig.6.Total flux potential(φt)(0 to-3 cm)of different treatments.Statistical comparison indicates if changes among the treatments are significantly different at p≤0.05 that is shown by different letters.Same letters are not significantly different.Vertical bars of each column represent standard deviation of five replications.Treatments are conventional tillage(CT),Minimum tillage(MT)and Zero tillage(ZT).
3.3.Pore-conductivity relationship
The flow-weighted mean pore radius(r0)vs.pressure head(h)relationship for different tillage practices is presented in Fig.7.The r0values were highest in ZT at all pressure heads followed by MT and CT.It can be observed that the r0values in ZT and MT were relatively closer to rmaxvalues at all pressure heads.This indicated greater connectivity of pores in conservation tillage practices as compared with CT.Hence,trends of pore network continuity were in the order to ZT>MT>CT.The enhanced pore connectivity in the conservation tillage practices may be attributed to improved soil aggregation,higher overall porosity(Schlüter et al.,2020),and a greater number of bigger biopores created due to enhanced biological activity.The relationship between k(h)and r0values for different treatments are presented in Fig.8.Results revealed that conservation tillage treatments(ZT and MT)had higher hydraulic conductivity,k(h),values for the corresponding flow weighted mean pore radius(r0)values particularly at the greater end of k(h)values than the conventional tillage treatment(CT).This may be indicative of a higher contribution of interaggregate flow in conservation tillage practices(Patra et al.,2019).Consistently lower r0values were observed at the lower end of k(h)values under CT because of decreased size of soil pores which may be due to high bulk density and low AMWD(cf.Figs.2 and 3).MT showed an intermediate effect and values of k(h)and r0lying between the ZT and CT treatments.

Fig.7.Flow weighted mean pore radius(r0)and maximum water filled pore radius(rmax)vs.supply pressure head(h)for different treatments.Vertical bars represent standard deviation of flow weighted mean pore radius of five replications.Treatments are conventional tillage(CT),Minimum tillage(MT)and Zero tillage(ZT).
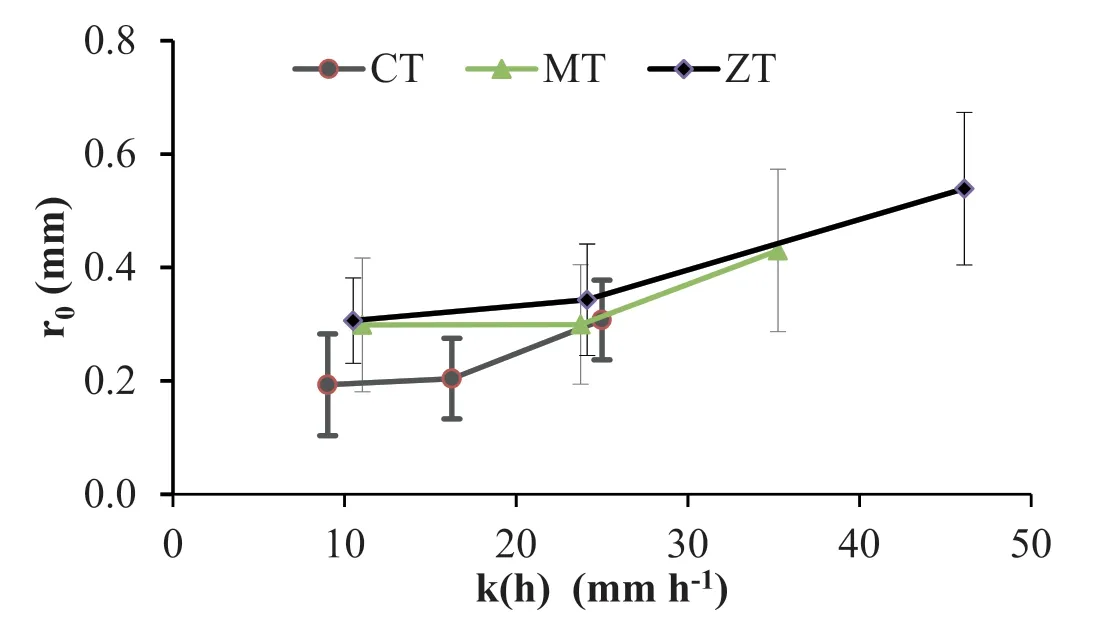
Fig.8.Flow weighted mean pore radius(r0)vs.hydraulic conductivity k(h)for different treatments.Statistical comparison indicates if changes among the treatments are significantly different at p≤0.05 that is shown by different letters.Same letters are not significantly different.Vertical bars represent standard deviation of five replications.Treatments are conventional tillage(CT),Minimum tillage(MT)and Zero tillage(ZT).
Fig.9 shows the relationship between the number of pores(n0)and flow weighted mean pore radius(r0)values.In CT,the flow occurred in the smallest pore-size range but with the greatest number of these pores sizes(Patra et al.,2019;Schwen et al.,2011).Soil compaction and structural breakdown lead to alteration of soil macropore to micropore which may be the potential causes for low numbers of macropores values in CT treatment.This implies that the use of agricultural machinery to manipulate the soil might destroy soil macropores in conventionally intensive tillage treatment(CT)and reduced the near-saturated hydraulic conductivity of the corresponding pore-size(Fig.8).In ZT and MT,generally flow occurred in the bigger pore-size resulting in higher hydraulic conductivity.
3.4.Water conducting porosity
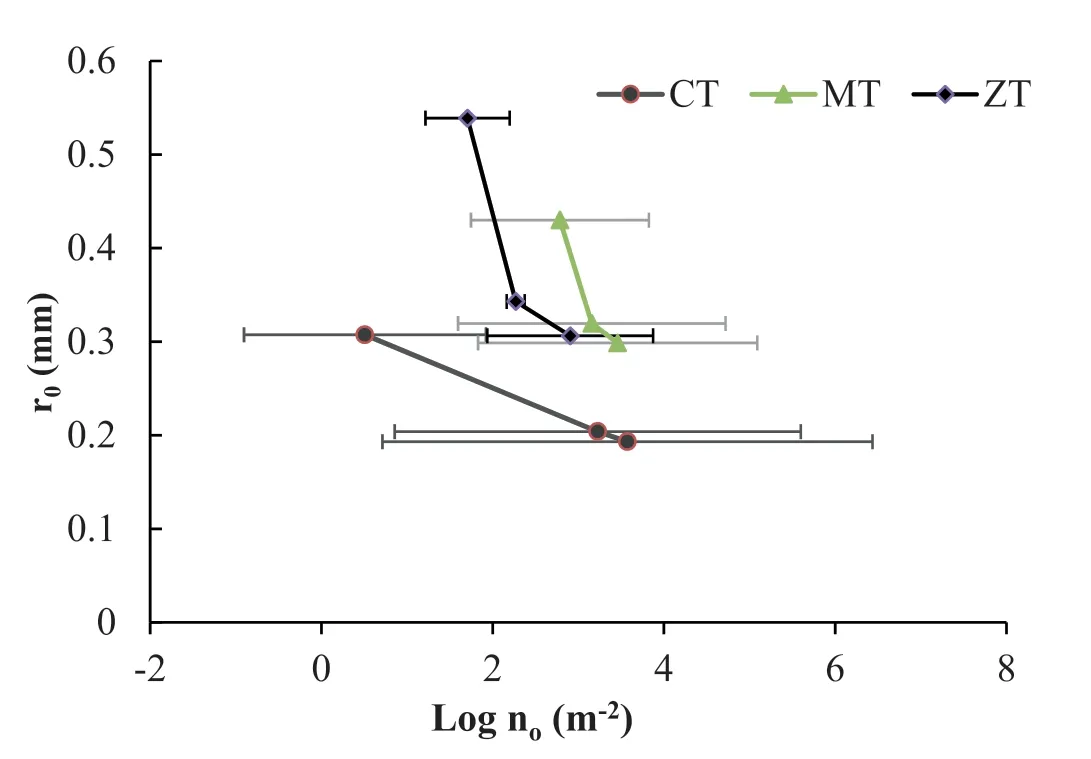
Fig.9.Flow weighted mean pore radius(r0)vs.number of flow weighted mean pores(n0)for different treatments.Horizontal bars represent standard deviation of numbers of pores values of five replications.Treatments are conventional tillage(CT),Minimum tillage(MT)and Zero tillage(ZT).
The impact of different tillage practices on the water-conducting porosity(Ɛ)in the total supply pressure head range of 0 to-3 cm is shown in Table 2.As mentioned earlier,the maximum pore radius was assumed to be 2.5 mm at 0 cm pressure head to account for bio pores formed by earthworms,dead root channels,and other soil fauna(Bodhinayake&Si,2004).The pore radius 1.49 and 0.50 mm were calculated at respective pressure head such as-1 and-3 cm.Results revealed that the water-conducting porosity(% soil volume)of the different treatments varied from 0.00069 % in ZT to 0.00030%in CT in the entire pore radius interval of 0.50-2.50 mm(Table 2).The value ofƐin MT treatment was observed to be 0.00044%at the same pore range,and it was significantly(p<0.05)lower than the ZT treatment,whereas,it was not statistically significant(p<0.05)as compared to CT treatment.A similar trend was also observed for the 0.50-1.49 mm pore radius range among all the treatments.Water conducting porosity among the treatments increased as follows:ZT>MT>CT.The highestƐwas observed in ZT treatment which was significantly(p<0.05)different from the MT and CT treatments.This trend was also reflected in hydraulic conductivity value(Fig.4).Although the range of values observed for water-conducting porosity in this experiment seems very small,these values are well comparable with the values reported in other studies.Patra et al.(2019)reported a similar trend for the maizewheat cropping system where the water-conducting macroporosity values varied between 0.00062 and 0.00017 %,in conservation and conventional tillage treatments,respectively.Villarreal et al.(2020)found water-conducting porosity varying from 0.0049 to 0.0061 % under different crop cycle.Daraghmeh et al.(2008)observed water-conducting porosity ranging from 0.059 to 0.0027 % in a long-term wheat cropping system.Cameira et al.(2003)observed the water-conducting porosity(pore>0.5 mm radius)in silty loam soil with maize-wheat crop rotation varying from 0.009 to 0.027 % under CT and MT,respectively.The water conductivity macroporosity values reported by Patra et al.(2019)are closer to our reported values whereas the values reported by Villarreal et al.(2020),Daraghmeh et al.(2008),and Cameira et al.(2003)are in a higher side.This may be attributed to the different methodologies adopted to estimate the water-conducting porosity in these studies.Our study and the study by Patra et al.(2019)used the method of Bodhinayake et al.(2004)whereas the other authors used the method of Watson and Luxmoore(1986).Watson and Luxmoore(1986)estimated water-conducting porosity from the differences in infiltration rates between two pressure heads by using the minimum equivalent pore radius assuming a single pore size.This method is reported to overestimate the water-conducting porosity(Bodhinayake et al.,2004;Buczko et al.,2006).However,the method by Bodhinayake et al.(2004)considers a range of pore sizes and is found to be more accurate.
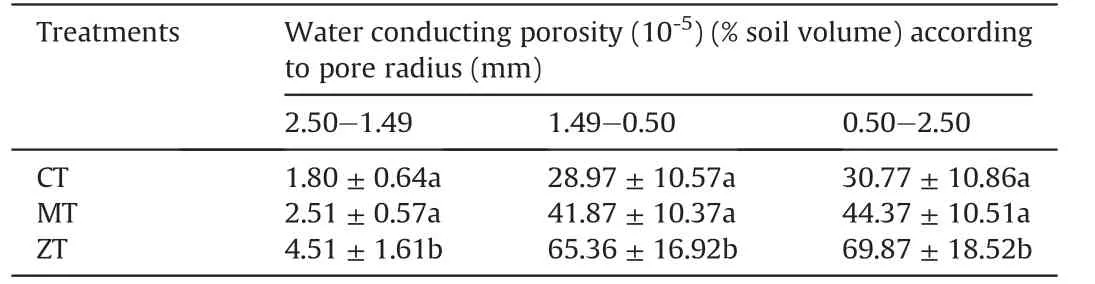
Table 2 Estimated water conducting porosity(% soil volume)in each pore radius interval under different treatments.Statistical comparison indicates if changes among the treatments are significantly different at p≤0.05 that is shown by different letters.Same letters are not significantly different.Values in parenthesis(±)denote the standard deviation of five replications.Treatments are conventional tillage(CT),Minimum tillage(MT)and Zero tillage(ZT).
Furthermore,the water flux transmitting through each pore radius interval to total flow was determined as the k(h)difference for each h range divided by the calculated k(h)at 0 cm pressure head(h).The percentage of water flux transmitting through eachpore size class such as macropores(radius>0.50 mm)and meso+micropores(radius<0.50 mm)with respect to total flow under different tillage practices are presented in Fig.10.Results revealed that although macropores comprised very little proportion of the total soil volume(to the order of 10-4),a very large percentage of water flux transmitted through them.This small portion might have significantly governed the water flow behavior such as runoff and infiltration,especially under saturated and nearsaturated conditions.The transmission of average flow through macropores(>0.50 mm)were about 63.30,68.01,and 75.97 % of total flow at 0 cm water pressure head with corresponding waterconducting porosity of 0.00030,0.00044,and 0.00069 % of total soil volume in the CT,MT and ZT treatments,respectively.The water flux values at smaller pore range i.e.meso+micropores(<0.50 mm)in CT were significantly higher than ZT,whereas,no(p<0.05)significant difference was observed with MT.This is due to the use of agricultural machinery to manipulate the soil that might have changed the soil macropore to smaller pores(i.e.mesopore+micropore)in conventionally intensive tillage treatment(CT)(Schwen et al.,2011).But in the case of larger pore range i.e.macropores(>0.50 mm),the water flux values were significantly higher in conservation agricultural treatment(ZT)than conventional intensive tilled treatment(CT).However,no statistically significant difference was observed between ZT and MT treatments.These estimates are well comparable with the findings reported by previous studies for the transmission of water flux through the different pore ranges to the total flow at near saturation condition in conservation agriculture(Bodhinayake et al.,2004;Buczko et al.,2006;Daraghmeh et al.,2008;Patra et al.,2019).It suggests that converting conventional intensive tillage practices to conservation agricultural practices improved the SHPs.
4.Conclusion
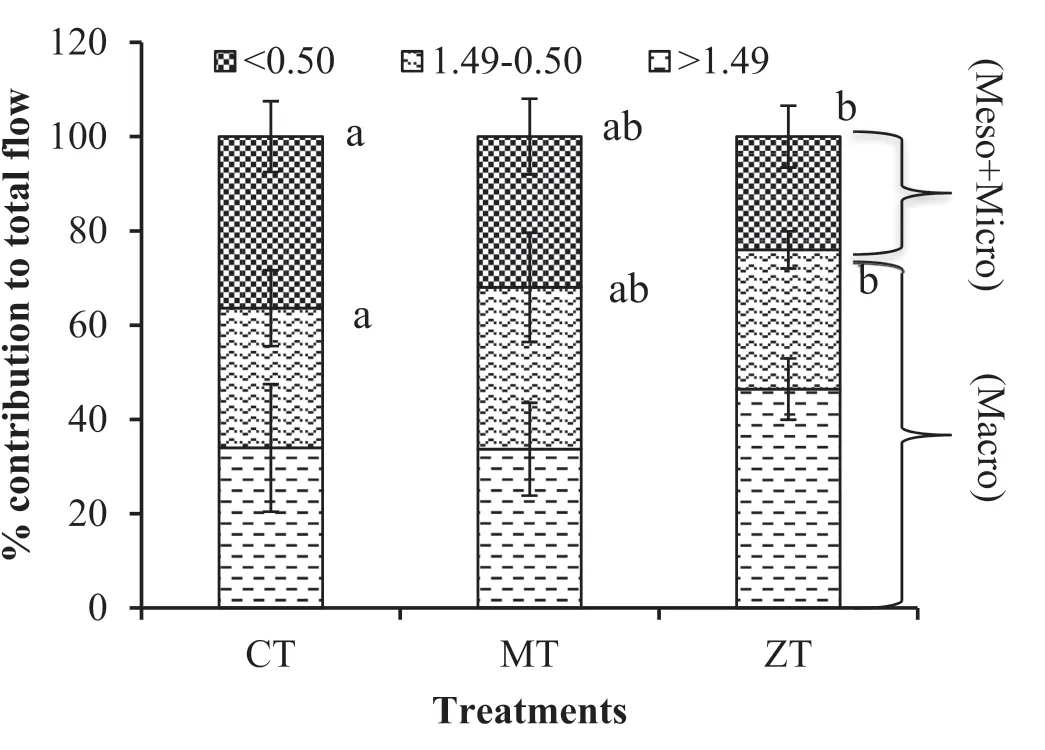
Fig.10.Contribution to total flow at 0 cm supply pressure head from the following pore radius ranges:<0.50 mm,1.49-0.50 mm and>1.49 mm under different treatments.<0.50 mm radius means the flow occurs in meso+microspores and>0.50 mm(0.50-1.49 and>1.49 mm)radius denotes the flow occurs in macropores.Statistical comparison indicates if changes among the treatments are significantly different at p≤0.05 that is shown by different letters.Vertical bars represent standard deviation of five replications.Treatments are conventional tillage(CT),Minimum tillage(MT)and Zero tillage(ZT).
Tillage is an important factor affecting soil hydraulic properties.This study evaluated the impact of three types of tillage practices i.e.conventional intensive tillage(CT)and conservation tillage practices(zero-tillage(ZT)and minimum tillage(MT))on nearsaturated soil hydraulic properties in the North-Western Himalayan region.Results showed significantly higher nearsaturated hydraulic conductivity in ZT and MT as compared with CT.A higher number of better-connected macropores were found to improve hydraulic conductivity in conservation tillage practices.The greater number of biopores due to better biological activity and improved soil aggregation were attributed to be reasons for the higher number of macropores in conservation tillage practices.Despite macropores comprised of very little proportion of the total soil volume,a very large percentage of water flux transmitted through them.The transmission of average flow through macropores(>0.50 mm)was about 63.30,68.01,and 75.97%of total flow with corresponding water-conducting porosity of 0.00030,0.00044,and 0.00069 % of total soil volume in CT,MT,and ZT treatments,respectively.This shows the sensitivity of soil structural changes in near-saturated conditions induced by different tillage practices.Overall,the findings of this study confirm our hypothesis that conservation tillage practices enhance macroporosity and increase saturated and near-saturated hydraulic conductivity and may help in reducing runoff,soil erosion in the high rainfall areas of the North-Western Himalayan region.
Declaration of competing interest
The authors declare no conflict of interest.
Acknowledgments
The authors are thankful to the Director of ICAR-Indian Institute of Soil and Water Conservation,Dehradun,India for supporting the work and providing necessary laboratory facilities for soil analysis.
 International Soil and Water Conservation Research2021年2期
- International Soil and Water Conservation Research的其它文章
- Predictions of soil and nutrient losses using a modified SWAT model in a large hilly-gully watershed of the Chinese Loess Plateau
- Potential of conservation tillage and altered land configuration to improve soil properties,carbon sequestration and productivity of maize based cropping system in eastern Himalayas,India
- Carbon sequestration benefits of the grain for Green Program in the hilly red soil region of southern China
- Crop productivity,soil health,and energy dynamics of Indian Himalayan intensified organic maize-based systems
- Determinants of adoption of multiple sustainable agricultural practices among smallholder farmers in Nigeria
- Wear of the working parts of agricultural tools in the context of the mass of chemical elements introduced into soil during its cultivation