Somatic TP53 mutations and comparison of different TP53 functional domains in human cancers: data analysis from the IARC TP53 database and the National Cancer Institute GDC data portal
Juan Du, Hong-Jian Gong*, Han Xiao*
1Institute of Maternal and Child Health, Wuhan Children’s Hospital, Tongji Medical College, Huazhong University of Science and Technology, Wuhan, China
P53 gene mutations have been known to be highly related to the majority of human cancers.The colocation of biologists and bioinformaticians have constructed many databases for cancer research.Although the relationship between the presence of TP53 mutation and cancers has been reported in various studies, few reports TP53 mutation distribution in different functional domains.Hence, we use 2 databases (The TP53 Mutation Database of the International Agency for the Research on Cancer and The Genomic Data Commons data portal) to compare survival rate with and without TP53 mutations in a certain cancer, as well as to find most frequent mutation sites in different functional domains of the TP53 protein.Our study shows that most somatic mutations of TP53 and high mutation rate sites are concentrated in the DNA-binding domain, and the survival of certain cancers varies with and without P53.
Key words: Somatic mutations, TP53 domains, Mutation distribution, Tumor site distribution
Background
TheP53gene is one of the most classic tumor suppressors in human tumor.Primarily acting as a transcription factor,TP53is activated in response to a variety of stressors to regulate the expression of genes that control proliferation and senescence, DNA repair,and cell death [1].Although these tumor suppressive mechanisms have been identified, recent data indicates thatTP53may also limit formation of cancers by regulating metabolism, regulating reactive oxygen species levels, enhancing autophagy, or enhancing ferroptosis, altering the expression of non coding RNAs[2].The most frequent mutation gene in human cancer isTP53, andTP53mutation present in about 50% of tumors.
Many experimental, clinical and preclinical data from the past few years have demonstrated that the transfer of new genetic information (transgene) into many cells and tissues is possible, including hematopoietic progenitors and differentiated cells [3, 4].Several viral and non-viral systems have been used to promoteTP53reconstitution, and delivery of wide typeTP53by multiple viral vectors, which has been reported to successfully inhibit the growth of various malignant cells, which has led to the commercialization of vector andP53delivery based therapeutic approaches [5-7].Scientists are still working to discover new and better ways to performP53gene therapy to achieve the cure of cancers caused byP53gene abnormalities.
TP53mutation in tumor was distributed in different functional domains.The transcriptional activation domain (TAD) help to recruit and activate the core transcriptional machinery directly and indirectly through mediators [8].The proline-rich domain mediates interactions between proteins in signal transduction and is required forTP53to trigger apoptosis and growth inhibition [9].The DNA binding domain (DBD) provides an essential scaffold for the DNA binding surface andTP53mutations mainly occur in the DNA binding domain [10].The tetramerization domain (TD) helpsTP53form a tetramer and thenTP53can function as a transcription factor, and many posttranslational modifications that are considered important regulators ofTP53activity are dependent on its tetramerization structure [11].The multifunctional C-terminal domain (CTD) facilitatesTP53binding to chromatin and DNA, and controlsTP53DNA complex stability by promoting cooperative contacts between theTP53core DNA binding regions [12].
TwoTP53databases were utilized to draw conclusions:TP53mutations as potential prognostic markers for specific cancers [13].One of them is International agency for research on cancer (IARC)TP53database, in whichTP53mutation data reported in literature publicly since 1989 or available in other public databases were compiled.This database provides current knowledge onTP53variations in human cancer[14].It also has retrieval systems that allow flexible retrieval of data for different purposes.It’s versionis currently updated to R20, July 2019.The Genomic Data Commons (GDC) data portal is a research project of the National Cancer Institute, which is a platform containing data from several large cancer genomic research projects such as the Cancer Genome Atlas [15].It’s version is currently updated to 27.0 (October 29,2020).
This study aims to use IARCTP53database and GDC data portal to retrieve the relationship between cancers andTP53mutations.Getting data from them and then analyze comparingTP53mutation distribution and effects on tumors between different functional domains.P53gene therapy is a treatment based on theTP53mutation sites, and GDC data portal provides a large amount of information on the mutation sites ofTP53in cancer.Using most common tumors related toTP53mutation as an example, this study demonstrates how to find the most frequent mutation sites and other information in a certain cancer through this database.
Material and methods
Data sources
Data were obtained from the Cancer (IARC)TP53database R20 (July 2019)(https://P53.iarc.fr/Scope.aspx) [14].The database copyright is vested in WHO’s International Agency for Research on Cancer, Lyon, France [2019].The data contained herein may be freely used, downloaded and reproduced.Select the appropriate data, and use GraphPad Prism 7.0 tool to map and analyze the data.Among somaticTP53mutation data, get data in differentTP53function domains though specifying codon number.
Various cancer studies data were obtained from GDC V27.0 (October 29, 2020) of the National Cancer Institute (portal.gdc.cancer.gov/).
Results
Structure and mutation distribution of TP53
The humanP53gene is located at chondriosome17P13 and consists of 11 exons (boxes) and 10 introns (bold lines).Black boxes indicate no coding and the color represent coding region, and the first exon is not encoded (Figure 1A).The wild-typeP53protein consists of 393 amino acid residues and contains multiple functional domains.They are respectively tumor proteinP53(TP53) N-terminal TAD (residues 1-61), which is located in the coding regions of exons 2, 3 and part of exon4;TP53proline-rich domain (pro-Rich)(residues 63-97), which is located in part of exon4;TP53central DBD (residues 98-293), which is located in exons 5, 6, 7, part of exon 4 and 8;TP53TD (residues 326-356), which is located in part of exon 9 and 10;TP53CTD (residues 369-393), which is located in part of exon 10 and 11 (Figure 1B).Each functional domain has its own specific function and works together to ensure thatTP53exerts normal functions.
The mutation rates of somaticTP53mutations varied greatly among different exons, with relatively few mutations in exons 2, 3 and 11, low mutation rates in exons 4, 9 and 10, and the highest mutation rates in exons 5, 6, 7 and 8 (Figure 1C).The percentage of mutations is 3.89% on exon4, 28.51% on exon5,13.39% on exon6, 24.86% on exon7, 23.12% on exon8,1.26% on exon9, and 1.14% on exon10.The highest rate of codon mutation is at the following sites: the percentage of mutations is 4.8% on 175thresidue, 3.12%on 245thresidue, 6.79% on 248thresidue, 2.59% on 249thresidue, 6.55% on 273thresidue, 2.59% on 282thresidue (Figure 1D).All these high mutation rate codons are located in the DBD.The sum of codon mutation rates of TAD account for 1.03%, pro-Rich 1.23%, DBD 92.6%, TD1.49%, CTD0.14% (Figure 1E).DBD account for the majority, higher than 90%.The mutation distribution ofTP53in both exons and functional domains is concentrated in the central DNA-binding domain.
Mutation effect of TP53
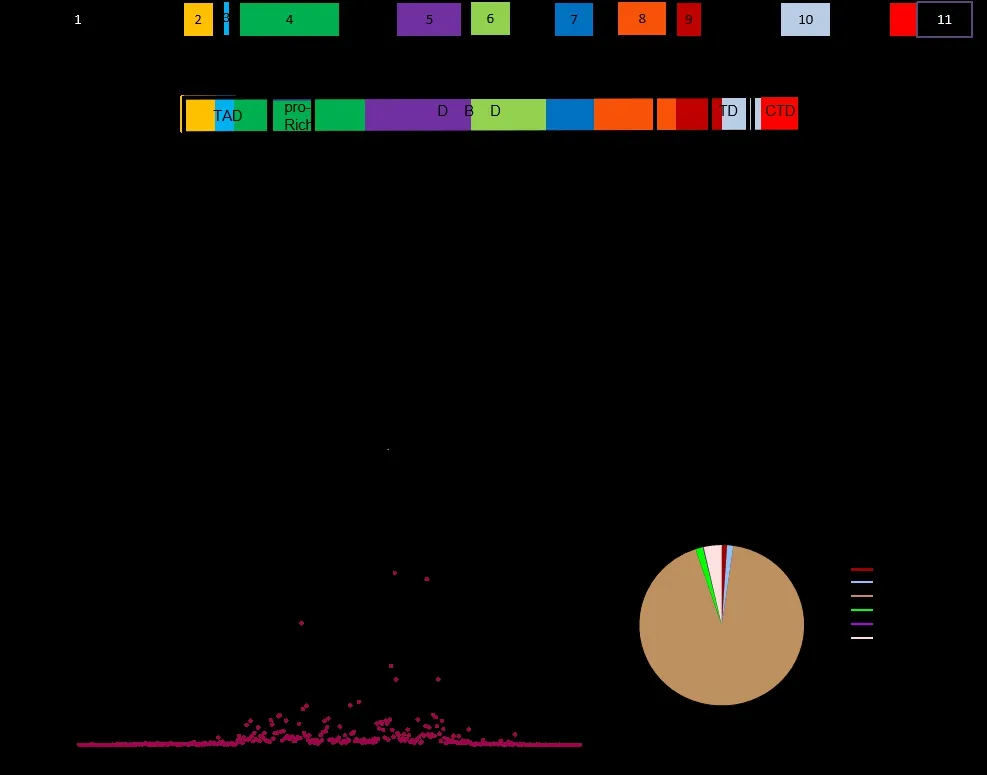
Figure 1 Structural characteristics and mutation distribution of human TP53.(A) Schematic diagram of the human TP53 gene.TP53 contains 11 exons (boxes) and several introns (bold lines).Coloured boxes represent coding exons; black boxes represent non-coding exons.The numbers in brackets below represent amino acid residues.(B)Map of full-length the domain structure of the human P53 protein.TP53 contains 393 amino acid residues, five functional domains.(C) Intron/exon distribution of somatic mutations.Histogram is used to show the percentage of mutations in specific introns and exons.Data from IARC TP53 Database (R20, July 2019).(D) The codon distribution of somatic mutation.Histogram is used to show the case number of mutations in specific codon positions.The numbers in the histogram represent codon positions with a high mutation rate.(E) The sum of codon mutation rates of somatic mutations in different domains.Data from IARC TP53 Database (R20, July 2019).
Definition of mutation effects: Based on predicted effects on protein sequences (missense, nonsense,frameshift ins/del, ...) categorized mutation ratio: the number of mutations per category divided by the total number of selected mutations (% is shown) (definition from IARCTP53Database).In cancers, the most common genetic alteration ofTP53is missense mutation, and missense mutation are classified as“supertrans (P53variants exhibiting higher than wild type levels of transactivation)”, “functional”, “partially functional”, and “nonfunctional” [16].The missense mutation rate of full-length somaticTP53mutations is 73.07%, frameshift is 9.07%, nonsense is 8.19%, silent is 3.59%, splice is 2.5%, intronic is 0.74%, large deletion is 0.17%, and other is 2.25% (Figure 2A).Mutation type of different functional domains ofTP53is statistically analyzed.It is found that the mutation effect of DBD is the most similar to the full length, and the missense mutation rate of DBD is 79.11% (Figure 2D).The mutation effect of TD: 30.41% missense,19.46% frameshift, 45.26% nonsense, 1.95% silent,0.24% splice, and 2.43% other (Figure 2E).The mutation effects of other 3 functional domains (TAD,pro-Rich, CTD) are similar, rates of missense mutation and frameshift mutation are higher, followed by nonsense mutation (Figure 2B, C, F).
Missense mutation assessment of TP53
Missense mutation ofTP53is most common in cancers,and the proportion of missense mutations is highest among full-lengthTP53mutation effects.What about the effect of missense mutations on protein function?Sorting intolerant from tolerant (SIFT) can use multiple sequence alignment technology to evaluate point mutations existing in protein sequences and predict the effect of point mutations on protein functions.Definition of SIFT: proportion of missense mutations classified according to their predicted deleterious/damaging or neutral/tolerated effect based on SIFT algorithm: number of mutations of each class divided by the total number of missense mutations selected (% is shown) (definition from IARCTP53Database).
SIFT analysis showed that among full-length somaticTP53missense mutations: 92.89% are damaged and 6.87% are tolerated (Figure 3A).The SIFT of different functional domains ofTP53are statistically analyzed.It is found that DBD SIFT analysis is the most similar to the full length: damaged are 94.88% and tolerated are 4.94% (Figure 3D).SIFT analysis of TD: 70.40% are damaged and 29.60% are tolerated (Figure 3E).The SIFT of other three functional domains (ATD, pro-Rich,CTD) are similar, rates of tolerated are higher than the rate of damaged (Figure 3B, C, F).
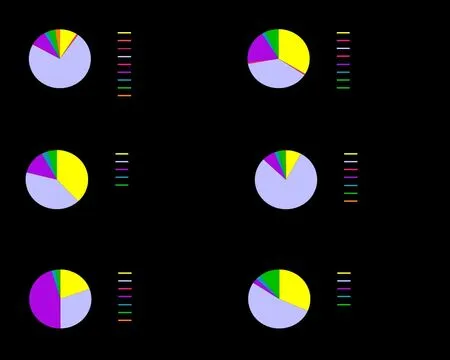
Figure 2 The proportion ofmutation effect of somatic TP53 mutationin different domains.(A) Pie charts is used to show the proportion of mutation effect of full-length somatic TP53 mutation found in 28866 cases.(B-F) Pie charts are used to show the proportion of mutation effect of somatic TP53 mutation in different domains.Data from IARC TP53 Database (R20, July 2019).FS, frameshift; NA, not available.
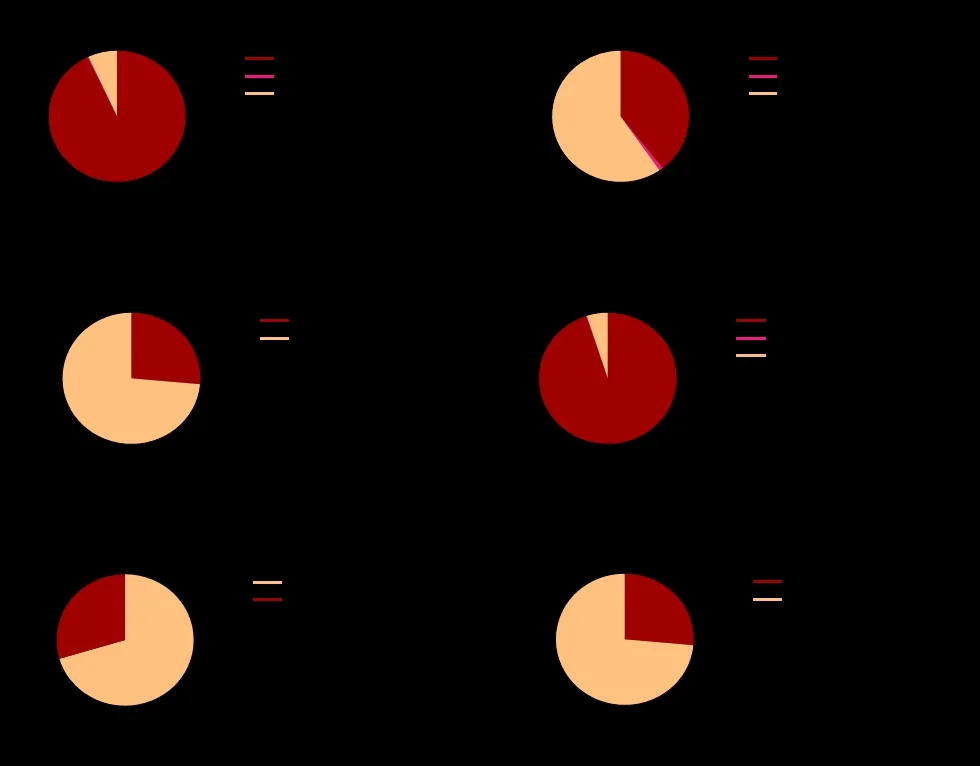
Figure 3 The proportion of SIFT of somatic TP53 mutation in different domains.(A) Pie charts is used to show the proportion of SIFT of full-length somatic TP53 mutation found in 21092 cases.(B-F) Pie charts are used to show the proportion of SIFT of somatic TP53 mutation in different domains.Data from IARC TP53 Database (R20, July 2019).NA, not available.
The above three groups of figures draw the following conclusions.Among somaticTP53mutations, DBD has the highest mutation rate (92.6%), followed by TD;mutation effect and SIFT analysis showed that DBD and full-lengthTP53are very similar: their missense mutation accounted for more than 70%, and damaging rate is higher than 95%; mutation effect and SIFT analysis showed that ATD, pro-Rich, and CTD are very similar: their missense mutation rate is about 45% and frameshift mutation rate is about 35%, and damaging rate is lower than 40%; mutation effect and SIFT analysis of TD showed that missense mutation rate is 30.41%, nonsense mutation rate is 45.26% and damaging rate is 70.40%.
Tumor distribution of TP53 mutation
The somatic mutation rate varies greatly among different functional domains ofTP53, and mutation effect and SIFT also differ greatly.Next, the difference of tumor site distribution in each functional domain will be statistically analyzed.SomaticTP53mutations may cause the occurrence of a variety of tumors, and there are differences in the proportion of distribution of these tumor types.About 10% rate both in lung and breast tumors, 8.10% rate in ovary tumor, about 6% rate in esophagus, brain and colorectum tumor, and mutation rates in other tumors are also shown in Figure 4A, listing only the top 15 tumors.Tumor distribution of different functional domains of SomaticTP53mutations is statistically analyzed.Tumor distribution of DBD is the most similar to the full length: about 10% rate both in breast and lung tumors, 7.78% rate in ovary tumor,about 6.65% rate both in brain and esophagus tumors(Figure 4D).The tumor distribution percentage of lung,breast and ovary tumors are high in other functional domains.The tumor distribution has difference in different functional domains, but also has some similarities among them (Figure 4B-F).
Survival estimates of TP53 mutation in cancers
Based on the aboveTP53tumor site distribution, we selected cancers with the highest proportion of tumour distribution ofTP53mutations for survival analysis with or without somaticTP53mutation.In bronchus and lung cancer (Figure 5A), around 5th year and 14th year survival rates are roughly the same with or without somaticTP53mutation.At other time in 19 years, the survival rate of cases withoutTP53mutation (S1) is higher than that of cases withTP53mutation (S2).Around 8th year S1 and S2 survival rates are both lower than 40%, and around 14th year are both lower than 20%.Around 10th year the survival rate of S1 is higher than that of S2, and are both lower than 40% and higher than 20%.

Figure 4 The proportion of tumor distribution of somatic TP53 mutation in different domains.(A) Pie charts are used to show the proportion of tumor distribution of full-length somatic TP53 mutation found in 28866 cases.(B-F) Pie charts are used to show the proportion of tumor distribution of somatic TP53 mutation in different domains.Data from IARC TP53 Database (R20, July 2019).
In breast cancer (Figure 5B), survival rate in cases withoutTP53mutation (S1) is slightly higher than in cases withTP53mutation (S2) in the first 11 years and around 20 years later, and in S2 is slightly higher than in S1 in the middle of these years.Overall, breast cancer has a higher survival rate than lung cancer, with a 5th year survival rate of 80% and an 18th year survival rate of 40%.Around 10th year the survival rate of S1 is lower than that of S2, and are both higher than 50%.
In ovary cancer (Figure 5C), around 5th year cases withoutTP53mutation (S1) and cases withTP53mutation (S2) survival rates are similar, and survival rate in S2 is higher than in S1 between 5 and 14 years.The survival rates of ovary cancer in S1 and S2 are both lower than 40% after 5 years, and lower than 20% after 7 years.Around 10th year the survival rate of S1 is lower than that of S2, and are both lower than 20%.
In esophagus cancer (Figure 5D), survival rates in cases withoutTP53mutation (S1) and cases withTP53mutation (S2) around 3 year are roughly the same, and in S2 is slightly higher than in S1 before 2.5 years, but in S1 is higher than in S2 after 4 years.Due to the small sample size of S1, we can only conclude that the survival rates of S1 and S2 are close to 40% around 2.5 year.
In brain cancer (Figure 5E), survival rates in cases withTP53mutation (S2) are higher than in cases withoutTP53mutation (S1).Around 2th year, the survival rate of S2 is twice that of S1, and S1 is lower than 40% but S2 is higher than 60%.Around 5th year,S1 is around 20% and S2 is around 40%.Around 10th year the survival rate of S2 is higher than that of S1, and S1 is slightly lower than 20% and S2 is slightly higher than 20%.

Figure 5 Survival estimates of select cancers of somatic TP53 mutation.(A-E) Comparison of survival estimates between TP53 mutation cases (S2 yellow curve) and non TP53 mutation cases (S1 blue curve) among five different tumors.Data from GDC Data Portal.(F) Prevalence of somatic TP53 mutations by tumor site.Data from IARC TP53 Database (R20, July 2019).
Among these 5 cancers, breast has the highest survival rate and ovary has a lower survival rate.Breast cancer survivors reaching 40% survival rate experience the longest time, while the esophagus cancer experience the shortest time.They are different in cancer survival rate with and withoutTP53mutations, then we wanted to know whether the trend of the difference was related to prevalence of somaticTP53mutations by tumor site.Proportion of tumors that carry a somaticTP53mutation extracted from publications contained in the Somatic dataset have been showed in Figure 5F.Unfortunately, the close connection between them cannot be seen from the data.
TP53 mutant codon and prediction of mutant damage in cancers
Because of the high rate of somaticTP53mutation in cancers,P53gene therapy is promising in the future for the treatment of these cancers.However, when the corresponding cancer is clinically diagnosed, whichTP53codons are high mutation rates? And how about the risk of these codon mutations? In all these cancers,each site mutant damage is shown in the Figure 6.Most frequent somaticTP53mutation codons are showed in Table 1, and all these most frequent sites are in the central DBD.In lung cancer, high-damaged mutation sites accounted for 39% of all mutation sites, and most frequent somaticTP53mutation site isTP53R158L of 2.69% mutation rate.In breast cancer, high-damaged mutation sites accounted for 42% of all mutation sites,and most frequent somaticTP53mutation site isTP53R175H of 4.99% mutation rate.In ovary cancer, highdamaged mutation sites accounted for 42% of all mutation sites, and most frequent somaticTP53mutation site isTP53R175H of 3.71% mutation rate.In esophagus cancer, high-damaged mutation sites accounted for 39% of all mutation sites, and most frequent somaticTP53mutation site isTP53R175Hof 6.25% mutation rate.In brain cancer, high-damaged mutation sites accounted for 26.96% of all mutation sites, and most frequent somaticTP53mutation site isTP53R273C of 13.91% mutation rate.When applying gene therapy tools forTP53to the treatment of a certain cancer, the National Cancer Institute GDC data portal can be used to findTP53mutation sites and sites with high frequency of mutations in this cancer, as well as the damaged magnitude corresponding to these sites.
Discussion
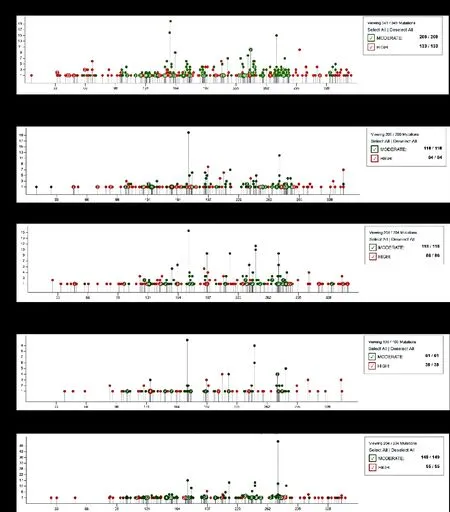
Figure 6 Prediction of mutation damage of somatic TP53 mutation in select cancers.(A-E) Prediction of mutation damage of somatic TP53 mutation in five different tumors.Red dots represent high-damage mutation sites and green dots represent moderate-damage mutation sites.Data from GDC Data Portal.
TP53is divided into 5 functional domains by structure and function, and each exerts its important effects and enablesTP53to exercise normal functions in vivo.WhenTP53is mutated,TP53cannot perform its normal biological functions, leading to inactivation of a series of biological responses, and ultimately result in the occurrence of many cancers.The relationship betweenTP53mutation and cancers has been studied for many years, andP53gene therapy based on their relationship has been increasingly investigated in recent years.IARCTP53Database includes many kinds of information aboutTP53mutation in tumors.The information comparingTP53mutations in different functional domains leds to a number of conclusions: the sum of codon mutation rate of DBD is highest at more than 90%; The mutation effect of full-lengthTP53and DBD is mostly missense mutation, and TD is mainly missense and nonsense mutation, then ATD, pro-Rich,CTD are principally missense and frameshift mutation;SIFT analysis showed that more than 90% ofTP53fulllength and DBD missense mutations are damaged,70.40% of TD mutations are damaged, and less than 40% of ATD, pro-Rich, CTD mutations are damaged;lung, breast and ovary tumors are high incidence in fulllengthTP53and allTP53domains.On the whole,mutation type, mutation effect and tumor distribution in different functional domains have common and For one cancer, they analyze the involved genes and gene mutations, survival analysis and so on.The first step in gene therapy is to find out the relationship between cancer and defective genes, and this data portal provides a lot of data for reference and application.In this study, we used five most common cancers related toTP53mutations as examples, then utilize the data portal to analyze the survival rate and most frequent somaticTP53mutation codons.Cancers’ survival rates with and withoutTP53mutation have some difference.These five cancers’ most frequent somaticTP53mutation codons are in DNA binding domain.Above all,TP53DNA-binding domain mutation distribution is most similar with full-length, and have drastic effects on cancers.

Table 1 Most frequent somatic TP53 mutations in tumors
Conclusion
In this study, 2 databases are used to analyze the relationship betweenTP53and cancer.Most somatic mutations ofTP53are concentrated in the central DBD,as are sites of high mutation rate.Mutation effects were mainly missense, nonsense and frameshift mutations.The main sites of cancer associated with site mutations in different domains ofTP53are: lung, breast, ovary,esophagus, brain.The survival of these several cancers varies with and withoutP53.This difference and the prevalence of somaticTP53mutations by tumor site are not relevant.TheTP53mutant codon damage in 5 cancers was finally analyzed, and showed that all these most frequent sites are in the DBD.
- Medical Data Mining的其它文章
- Unsatisfied methodological qualities assessment of systematic reviews/Meta-analyses on Chinese medicine for stroke and their risk factors
- A study on the rule of Chinese medicine use against influenza virus based on data mining
- Based on data mining, the drug law of clinical treatment of chronic urticaria

