Structure and genetic diversity of natural populations of Guadua weberbaueri in the southwestern Amazon, Brazil
Glória da Silva Almeida Leal · Fabrício Assis Leal · Hugo Teixeira Gomes · Anderson Marcos de Souza ,4 · Sabina Cerruto Ribeiro · Jonny Everson Scherwinski-Pereira
Abstract The Brazilian state of Acre has an extensive natural reserve of bamboo, making it one of the largest in loco gene banks. The aim of this study was to characterize the structure and genetic diversity of Guadua weberbaueri Pilg. in two populations, one native (FAPB) and the other anthropized (FAPBA), using ISSR markers. The results show that the FAPB population exhibited higher values for all estimates of population diversity. However, the FAPBA population also showed high heterozygosity, corroborated by estimated gene flow (Nm = 3.9) between the populations. The study of the association between Nei’s genetic distances and the geographic distances between the populations were significantly correlated ( r = 0.45, p = 0.01), corroborated by the dendrogram revealing two distinct groups corresponding to the collection sites, without mixing classes between populations in the same group. As for the coancestry coeffi cient, pairs of individuals in the first distance class were positive and significant, indicating that plants that are geographically closer share common alleles with a frequency greater than by chance, which means that there is a tendency that geographically closer individuals are related. Individuals presented similar genetic structure when the geographical distance between them was up to 56 m for FAPB and up to 156 m for FAPBA. It was concluded that anthropized environments exhibit less genetic diversity than native environments, inferring risks for species conservation if appropriate and planned management techniques are not adopted.
Keywords Guadua · Bamboo · Genetic diversity · Amazon rainforest · Anthropized and native populations · Underutilization plants
Introduction
The Amazon Rainforest (Amazonia) has the highest biological diversity on the planet and considered one of the world’s most important ecosystems (Forzza et al. 2012). In Brazil, the state of Acre occupies an important position in Amazonia because of its richness and endemism of species, and more than halfof its territory is dedicated for the protection of biodiversity (Acre 2006). The forests harbor a large number of plant species with economic potential (Daly 2004), of which bamboo is considered to be one of the world’s most prominent non-timber forest products.
Acre has the world’s largest native bamboo reserves, constituting the largest in loco gene bank and attracting international attention for its production potential (Pereira and Beraldo 2007). However, the structure and genetic diversity of their populations are still largely unknown (Gonçalves et al. 2010). This information is important and fundamental for adopting appropriate genetic conservation and management strategies. Moreover, maintaining the genetic and evolutionary variability of species is dependent on genetic conservation, which is one of the greatest challenges for species ofeconomic interest in the Amazon (Yeeh et al. 1996; Toro and Caballero 2005). The predatory exploitation of forest resources in areas where bamboo occurs can compromise its genetic diversity. Additionally, Brazilian forest laws do not provide specifications for the management of forests dominated by bamboo, regardless of the type of forest. Research on the structure and genetic diversity of Acre bamboo reserves is largely non-existent or little known.
In Brazil, the only existing research addressed the development of microsatellite markers for Aulonemia aristulata (Döll) McClure and the cross-amplification in bamboo species (Abreu et al. 2011). Research to evaluate the genetic structure and diversity of bamboo populations is of major importance for supporting sustainable management, without detriment to the forest communities in which they are located. The objective of this research is to characterize the diversity and genetic structure of Guadua weberbaueri Pilge. with and without anthropic interference in an area of mixed forest with palm and bamboo species in the Western Brazilian Amazon.
Materials and methods
Characterization of the study area
The study area is located in the Riozinho da Liberdade Extractive Reserve between 7° 30′ and 9° 00′ S and 71° 15′ and 72° 30′ W. The region has an average annual temperature of 23 °C, ranging from 17 to 38 °C. Annual rainfall is approximately 2000 mm (Acre 2006). According to the new Brazilian Soil Classification System, Luvisols, Argisols, Cambisols, and Gleisols are predominant in the Riozinho da Liberdade sub-basin (EMBRAPA 2011). The vegetation is represented by Open Ombrophilous Forest, characterized by the abundance of palm trees, vines or bamboos (Bernarde et al. 2011).
Collection of plant material
The plant material (leaf tissue taken from the middle section of adult leaflets) for DNA extraction was collected from adult plants of G. weberbaueri in an open forest with a mix of palm and bamboo species (FAPB) and an anthropized open forest with palm and bamboo populations (FAPBA). In 1985, the area where the FAPBA population now occurs, was cleared of native vegetation for agricultural cropping. After three years of cultivation, the area was abandoned and is now in the process of natural restoration, which includes palm and bamboo species. For the identification of the bamboo, leaves, flowers, culms and seeds were collected, prepared in exsiccates and sent to the botanical identification herbarium of the Federal University of Acre. The scientific name was standardized according to APG III ( 2009).
For each FAPB and FAPBA study population, a 14.5 ha area was delimited, and 10 sampling points systematically established every 100 m to install 20 m × 50 m plots. Of these points, three were randomly selected for measuring culms and collecting plant material for DNA extraction. The material was placed in polyethylene plastic bags containing five grams of silica gel and stored in polystyrene boxes. Subsequently, the samples were transported to the laboratory where they were stored at − 80 °C until DNA extraction.
The diameter and height of the plants were measured using a tape measure and telescopic rod, respectively. Heights were stratified into 2-m classes. The geographic coordinates of the bamboo culms were obtained by GPS receiver (Garmin Gpsmap 76csx), and the Cartesian coordinates (XY) used to analyze the spatial genetic structure.
Extraction and amplification of DNA using the molecular marker ISSR (Inter Simple Sequence Repeats)
DNA extraction was according to Mogg and Bond ( 2003) and quantified by both spectrophotometer estimation and 1% agarose gel with ethidium bromide (10 μL/100 mL TBE). The gels were photographed under UV light using a photo documentation system. For DNA amplification, a final concentration of 5 ng/IU was used.
Reactions for DNA amplification were performed in a thermocycler where 37 cycles were carried out, consisting of a 5-min initiation step at 94 °C, followed by denaturation at 94 °C for 45 s, a step for binding the ISSR primer to the DNA template (annealing) at 56 °C for 45 s and a final extension step at 72 °C for 7 min (Tian et al. 2012).
The volume ofeach amplified sample was 13 μL: 3 μL of DNA added to 10 μL of PCR reaction mix [1.3 μL of 10 × buffer (consisting of 500 mM Tris–HCl pH 8.0, 200 mM KCl, 2.5 mg mL−1BSA, 200 mM Tartazine and 1% Ficoll), 1.3 μL dNTP + 1.3 μL BSA (2.5 mM dNTP, 2.5 mg BSA/mL), 0.246 μL Taq polymerase (5 U/μL) and 3 μL primer (1.2 mM), and the final volume completed with ultrapure water. The amplification products were submitted to electrophoresis in 1.5% agarose gel stained with 15 μL/100 mL ethidium bromide in 1 × TBE solution (0.1 M Tris base, 1 M boric acid and 0.5 M EDTA) at 200 V for two and a half hours.
The gels were then photographed under UV light in which the 1 kb DNA ladder was used to estimate the molecular size of the amplified fragments. Initially, 57 primers were tested on 12 DNA samples randomly selected from the total set of 579 individuals. Of those tested, the eight primers that presented the best resolution and most polymorphic fragments of DNA were used (Table 1).
Data analysis
Based on the photographs of the gels, the absence (0) or presence (1) of the amplified ISSR fragments for the construction of the binary matrix were recorded, submitted to statistical analyses, including descriptive analysis of the data (number of bands, number of polymorphic bands and number ofexclusive bands). The optimal number of polymorphic bands was analyzed in the GENES program (Cruz 2001) according to the bootstrap method. To be considered ideal for estimating genetic diversity, the stress value—which indicates the fit between the original matrix and the simulated matrix—should be lower than 0.05.
The genetic diversity parameters: percentage of polymorphic loci (P), number ofeffective alleles (ne), number of alleles observed (na), Nei’s genetic diversity (He), Shannon index (I) and gene flow were calculated using the POPGENE program (see 1.32, Yeh et al. 1997). To estimate the polymorphic information content (PIC), the formula PIC = 2 Pi (1−Pi) was used, where Pi is the frequency of amplified polymorphic fragments and 1-Pi is the frequency of the null allele. The PIC indicates the ability ofeach marker to be found in two different states (absence/presence), in two plants randomly taken from the population. Thus, it can vary between 0 (monomorphic markers) to 0.5, for those present in 50% of the plants and absent in the other 50% (Roldán-Ruiz et al. 2000).
The analysis of molecular variance (AMOVA) was estimated using the ARLEQUIN v.3.1 program (Excoffi er et al. 2007) to determine the structuring of genetic variability within and among populations. Genetic similarity among populations was calculated based on the Jaccard coeffi cient with the aid of the NTSYS v. 2.11X program (Rohlf 2000). The similarity matrix obtained was used to construct a dendrogram using the unweighted pair group method with arithmetic mean (UPGMA). The consistency of these groupings was verified through the TFPGA v.1.3 program (Miller 1997). NTSYS was also used to obtain the correlation between geographic and genetic distances and between populations, and its significance was evaluated by the Mantel test (10,000 permutations).
The organization of genetic diversity was also evaluated through Principal Component Analysis (PCA) and Principal Coordinates Analysis (PCoA) using Euclidean distance, in order to represent the genetic distances between the populations. In this analysis, the GeneAIEx v.6.4 program (Peakall and Smouse 2006) was used.
The genetic coancestry coeffi cient, aimed at analyzing the pattern of spatial structure between the populations, was obtained by the kinship coeffi cient between pairs of individuals for each of the distance classes. These estimates were made using the SPAGeDI program, version 1.2 (Hardy and Vekemans 2002), with eight distance classes being preestablished. For this, coeffi cients were calculated based on the correlation between the genetic distances and the spatial connectivity matrices. Additionally, 95% confidence intervals were constructed for the average coancestry coeffi cient estimated for distance class. To test the occurrence of spatial genetic structure within each distance class, 10,000 permutations were used.
Results and discussion
The primers produced 81 fragments, with minimum and maximum numbers 7 and 12 for primers UBC850 andUBC855, respectively. PIC values ranged from 0.37 to 0.50 for FAPBA and 0.40 to 0.50 for FAPB, indicating that the markers presented high informativity. According to Duarte et al. ( 2015), the PIC (polymorphic information content) defines the effi ciency of the markers, where values greater than zero already detect polymorphism between individuals.
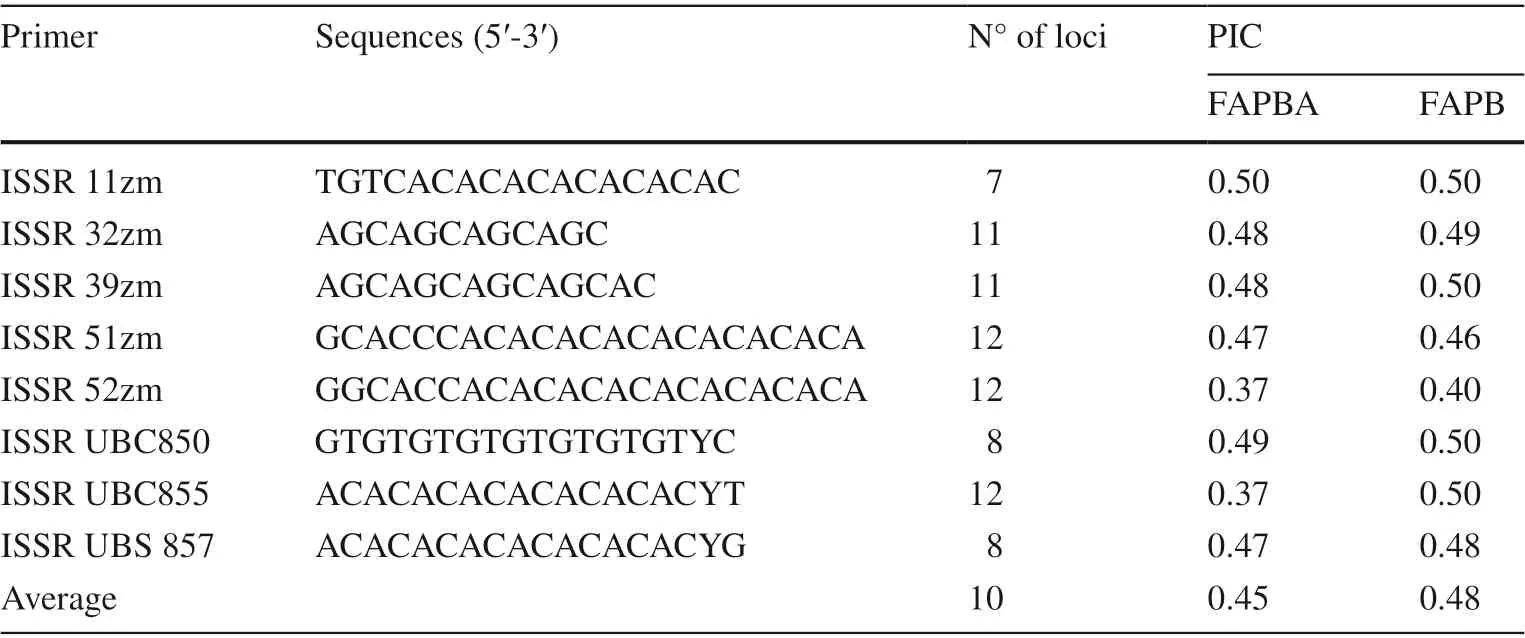
Table 1 ISSR primers selected for amplification with their base sequences, number of amplified fragments (loci) and Polymorphism Informational Content (PIC)
These results confirm the numbers of polymorphic fragments for the FAPB (97.5%) and FAPBA (93.8%) populations, corroborating that, although the number of ISSR primers (8) reproduced fewer bands, they provided a higher percentage of polymorphic loci and are thus suffi cient to safely analyze the genetic diversity of G. weberbaueri, since the observed stress value (0.02) was lower than 0.05. It is also noted that, from the number of 600 marks (60 loci), the correlation exceeded 0.9 (Fig.1).
According to Boza et al. ( 2013), highly polymorphic markers are useful in identifying genetic diversity. Furthermore, Gonçalves et al. ( 2014) argue that the use of large numbers of markers may make research unfeasible due to increased costs, without leading to a significant increase in accuracy of the data. Other research using ISSR markers for studies of genetic diversity in bamboo populations also obtained high polymorphism, (albeit with values lower than those found for the species covered in this study), such as Tian et al. ( 2012) for the genus Dendrocalamus (87.6%); Mukherjee et al. ( 2010) for the genera Bambusa, Dendrocalamus, Melocanna, Oxytenanthera, Phyllostachys, Pleioblastus and Schizostachyum (97%), and Muñoz et al. ( 2010) for Guadua (88.9%).
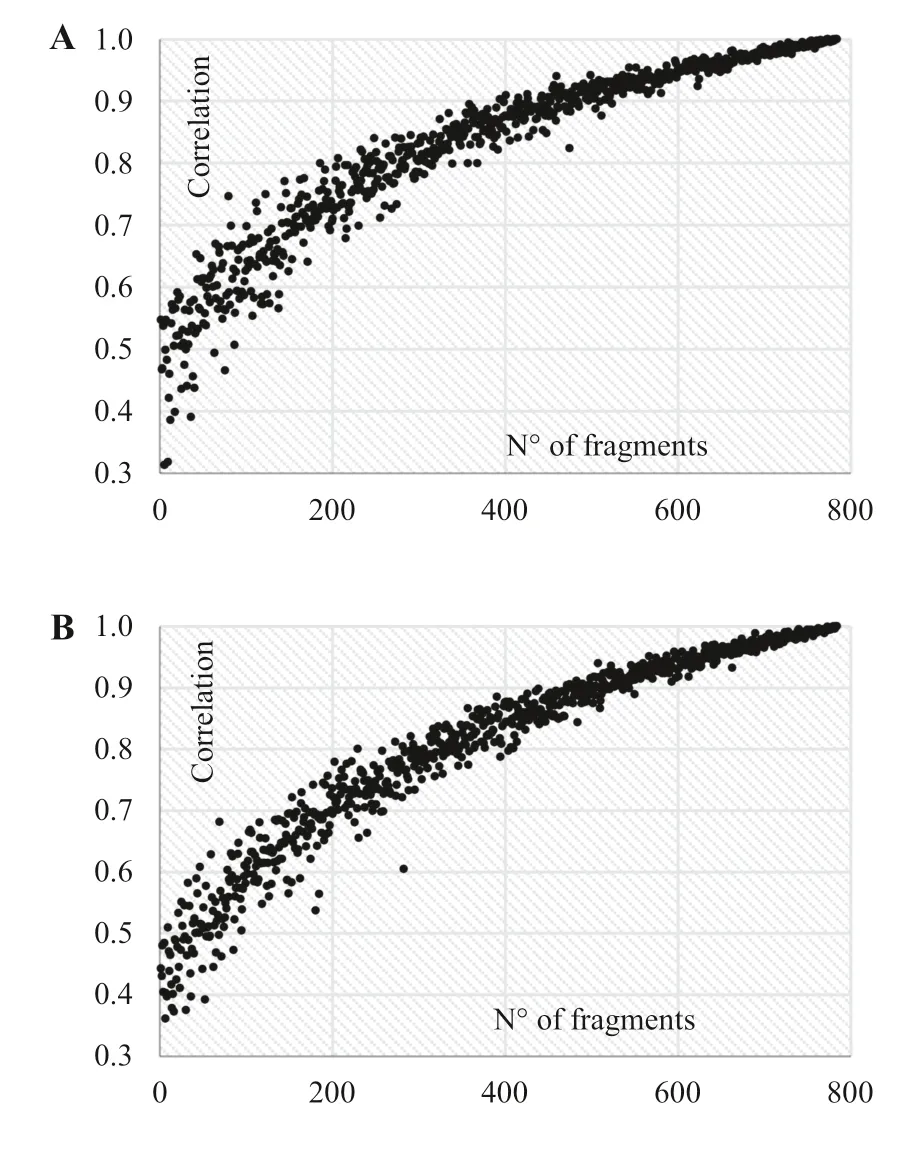
Fig.1 a Correlation between the number of polymorphic fragments and the stress value (r) obtained through the bootstrap method. Open forest with palm and bamboo (anthropized)—FAPBA population and b open forest with palm and bamboo (native)—FAPB population
Genetic differentiation among populations was significant at a 5% significance level ( p-value < 0.001), where the FAPB population presented higher values for all estimates of population diversity compared to the FAPBA population (Table 2). These results confirm that the FAPB population (He= 0.34, I = 0.50) has greater genetic diversity than the FAPBA population (He= 0.27, I = 0.41).
Tian et al. ( 2012) evaluated the genetic diversity in seven populations of giant bamboo ( Dendrocalamus giganteus Munro), assuming the Hardy Weinberg equilibrium, and obtained an average of Nei’s diversity index of 0.04 (Nei 1978) and Shannon index of 0.06. Yang et al. ( 2012) studied 12 populations of Dendrocalamus membranaceus Munro, a species in decline due to commercial overexploitation, and obtained Heand I averages of 0.16 and 0.25, respectively. These values are lower than those found in the present study, evidencing greater genetic diversity in populations of G. weberbaueri. Muñoz et al. ( 2010), found a higher value of He(0.54) in populations of Guadua angustifolia in Colombia.
According to Muñoz et al. ( 2010), variability is introduced continuously in populations. Specifically in the case of bamboo populations, they exhibit high diversity due to the presence of heterozygous individuals and their allogamous nature, i.e. reproducing by cross fertilization. Another factor to be considered is reproduction via seeds which may also explain the increase in genotypic variability in populations of G. weberbaueri. Regarding anthropized environments, according to Yang et al. ( 2012), these are subject to variations in the genetic diversity of their populations. Moraes et al. ( 2005) evaluated the genetic diversity in populations of aroeira ( Myracrodruon urundeuva M. Allemao) under conditions of low and high intensity of anthropization, and found lower genetic diversity in populations with the highest anthropization, attributed to inbreeding due to the low population density.
With regards to the percentage of polymorphic loci (P %), all height classes (Table 2) in both study populations had P % ≥ to 80% polymorphism, except class 8 m–12 m of the FAPBA; none of the populations exhibited exclusive bands. The variation in genetic diversity was significant ( p-value < 0.001) among height classes (3.7%), where most variation occurred within the total set of 579 individuals evaluated (96.3%). When compared, most height classes of the FAPB population exhibited higher values, both in the Shannon index (except for the 12–16 m class) and Nei’s index (except for the 0–4 m class), and showed the same He= 0.28. Aguiar et al. ( 2013) found similar results when evaluating the genetic diversity of tree species at different successional stages. They observed greater geneticvariability in the population at a more advanced stage of succession, concluding that the lower genetic diversity in the initial stages of regeneration is a result of seed replacement by a few remaining matrices near the area. Martins et al. ( 2008) noted that anthropized areas in the Amazon will require continuous genetic input during successive generations to reestablish the levels of genetic diversity observed in primary forests.
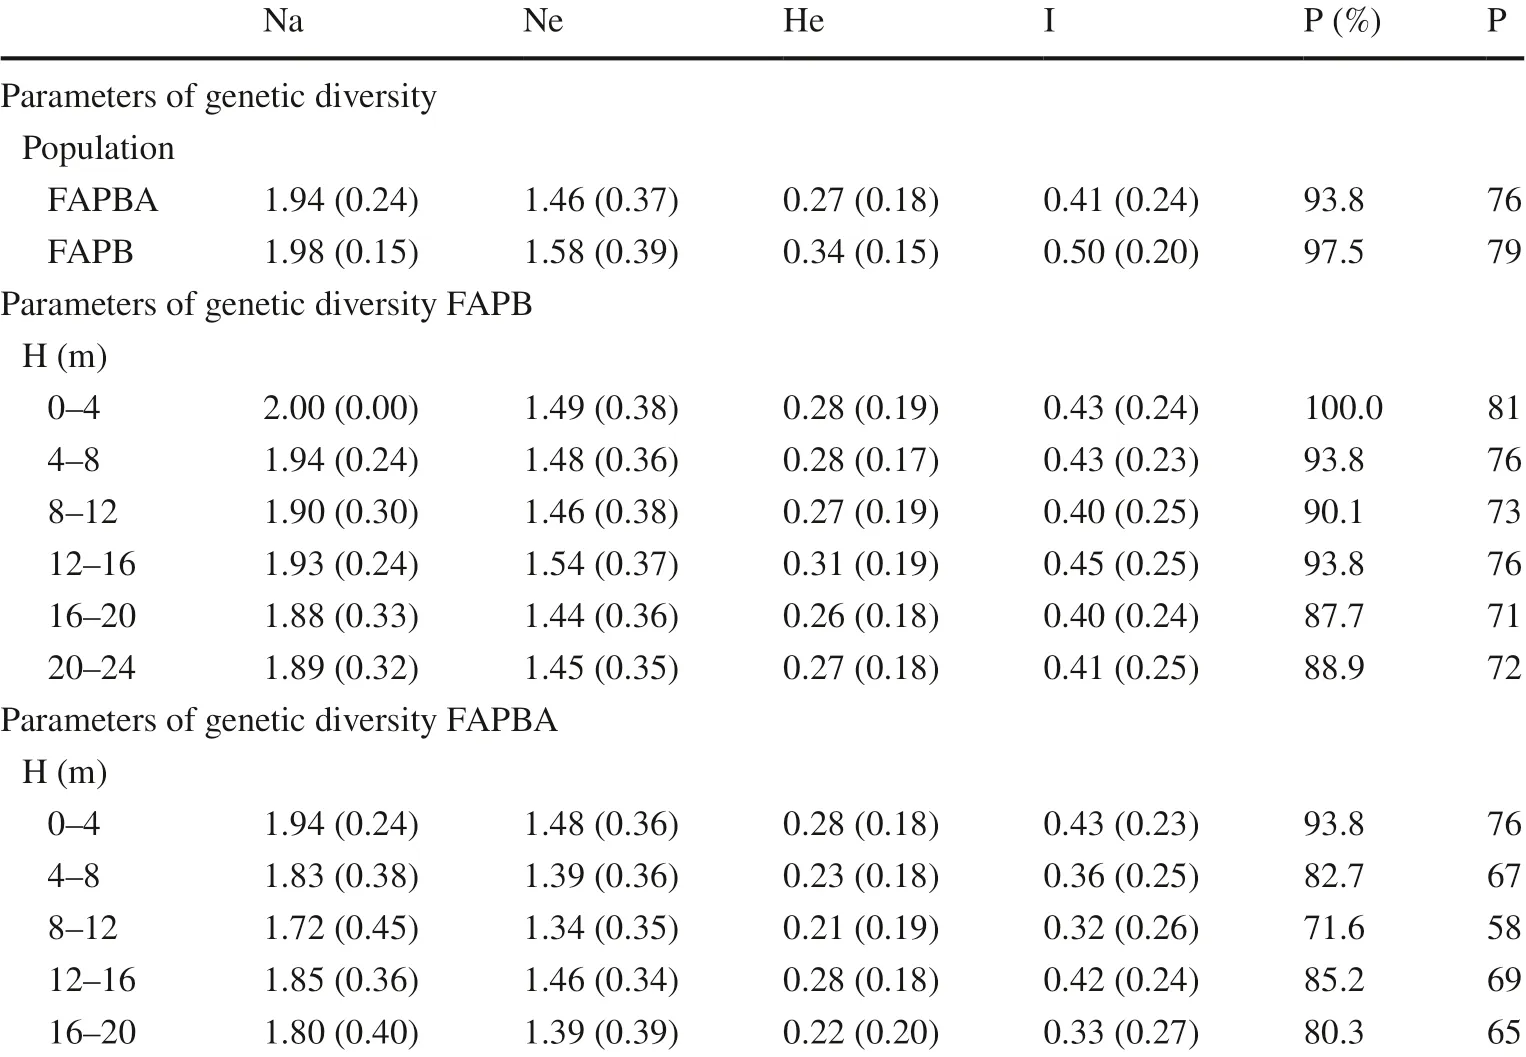
Table 2 Distribution of the genetic variability of the FAPB and FAPBA populations in different height classes based on ISSR markers
Reis et al. ( 2009) also found variations in diversity and genetic structure by height class, studying guanandi ( Calophyllum brasiliense Cambess), and concluded that its high genetic diversity can be attributed to the high population density among individuals sampled in their respective height classes. Comparatively, in this study, there were no variations in density per class but rather at the population level, in which the FAPB showed 518 culms and the FAPBA 279. Bem et al. ( 2015) and Ramos et al. ( 2016) confirm that population size has a direct influence on the genetic structure and diversity of populations.
Considering the FAPB and FAPBA populations, the analysis of molecular variance revealed that most of the variation in genetic diversity occurred significantly ( p < 0.01) within the populations (81%), whereas only 19% was due to differences among individuals between populations, indicating a good structuring within populations. Nybom ( 2004), Jeong et al. ( 2010), and Yang et al. ( 2012) confirm that most of the genetic variation occurs within the population and, in the specific case of bamboo, this may be related to its long vegetative phase (20 to 150 years), accounting for 10 to 20% of that variation when cross-hybridization occurs, and up to 50% in the case of self-crossing.
The FAPBA population showed lower genetic diversity than the FAPB population, however, with high heterozygosity, explained by its sexual reproduction system which presents ample seed production with dispersion by wind (Kageyama et al. 2003 ). Pollen grains of wind-dispersed species travel greater distances, which ensures a high frequency of migration between populations per generation (Hamrick 1991), a fact corroborated with the value of the estimated gene flow (Nm = 3.99) among the G. weberbaueri populations.
With a geographic distance of 3.5 km, the genetic distance between the populations of G. weberbaueri was 0.12 km and the estimated Nei identity was 0.89. Nei ( 1978) classified the genetic distance as low when the distance is less than 0.05; average when it is between 0.05 and 0.15, and high when greater than 0.15. Therefore, the genetic distance between the populations in this study was average. The association between Nei’s genetic distances and the geographic distances between populations, estimated by the Mantel test, were significantly correlated ( r = 0.45, p = 0.01). The main coordinate analysis (PCoA) obtained by Euclidean distance (Fig.2), relating the FAPB and FAPBA populations, showed that the first two axes account for 32% of the total variation, revealing significant genetic variation among populations even with the approximation of individuals from different populations, which indicates the existence of proximity between them.
With regards to height classes of G. weberbaueri in natural and anthropized environments (Table 3), the genetic distance between the classes ranged from 0.02 (N1 and N2) to 0.25 (N1 and A4, N5 and A5), with a mean genetic distance of 0.14, considered average by Nei ( 1978). The Mantel test showed that the correlation between genetic distance and geographical distance was significant ( r = 0.43; p < 0.01).
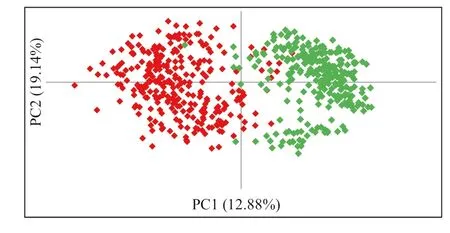
Fig.2 Principal coordinate analysis of 579 culms of Guadua weberbaueri based on ISSR markers. Populations under study: native (FAPB—left) and anthropized (FAPBA—right)
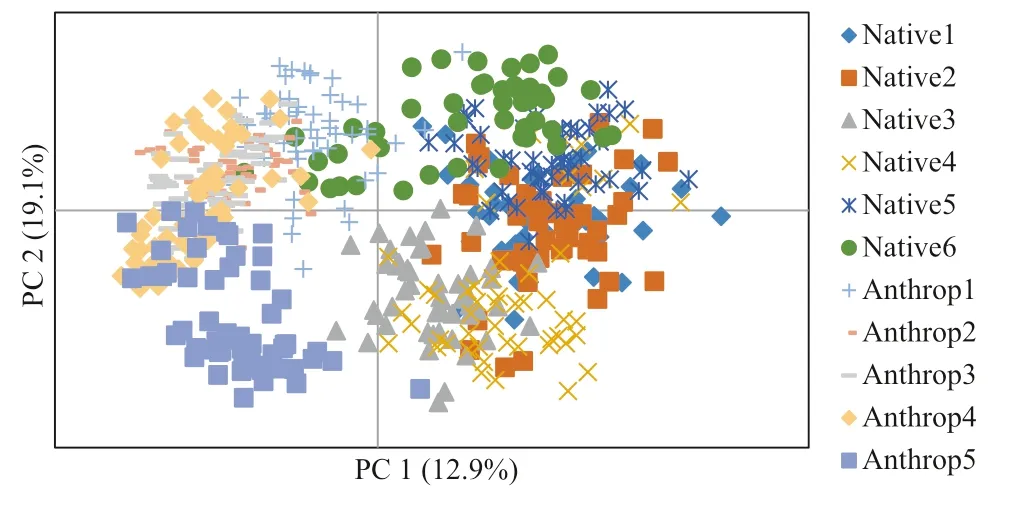
Fig.3 Principal Component Analysis of Guadua weberbaueri culms by vertical stratification, based on ISSR markers; each sample set comprises the respective height classes (m): Native 1 (0–4); Native 2 (4–8); Native 3 (8–12); Native 4 (12–16); Native 5 (16–20); Native 6 (20–24); Anthrop 1 (0–4); Anthrop 2 (4–8); Anthrop 3 (8–12); Anthrop 4 (12–16); Anthrop 5 (16–20)
The Principal Component Analysis (Fig.3) corroborates these results, and it is possible to verify that no height class group is isolated, as well as closer proximity between classes of different population, such as native 6 with anthrop (1, 2, 3, and 4).
The existence of significant genetic diversity among height classes can also be observed in the UPGMA dendrogram, constructed based on the values obtained from Nei’s genetic identity (Nei 1978). The formation of two distinct groups, native and anthropic is clear (Fig.4) and correspond to the collection sites, without mixing height classes among populations in the same group. The cophenetic correlation coeffi cient was 0.89, and the branches that separate the groups exhibit high consistency, having a bootstrap with all values equal to 100%.
In the correlation chart for the coancestry coeffi cient (CC) (Fig.5), eight spatial distance classes of G. weberbaueri individuals were estimated, with a variation in the spatialdistribution pattern among the populations evaluated and a 95% confidence interval.

Table 3 Estimates of identity (upper diagonal) and genetic distance (lower diagonal) calculated by the Nei method (1978), among the populations of Guadua weberbaueri (minimum and maximum values in bold)
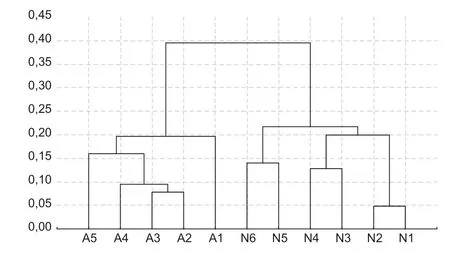
Fig.4 Dendrogram obtained by UPGMA method based on Nei’s genetic identity among the populations of Guadua weberbaueri in different height classes (m), respectively: N1 (0–4); N2 (4–8); N3 (8–12); N4 (12–16); N5 (16–20); N6 (20–24); A1 (0–4); A2 (4–8); A3 (8–12); A4 (12–16); A5 (16–20). N refers to the native area and A refers to the anthropized area
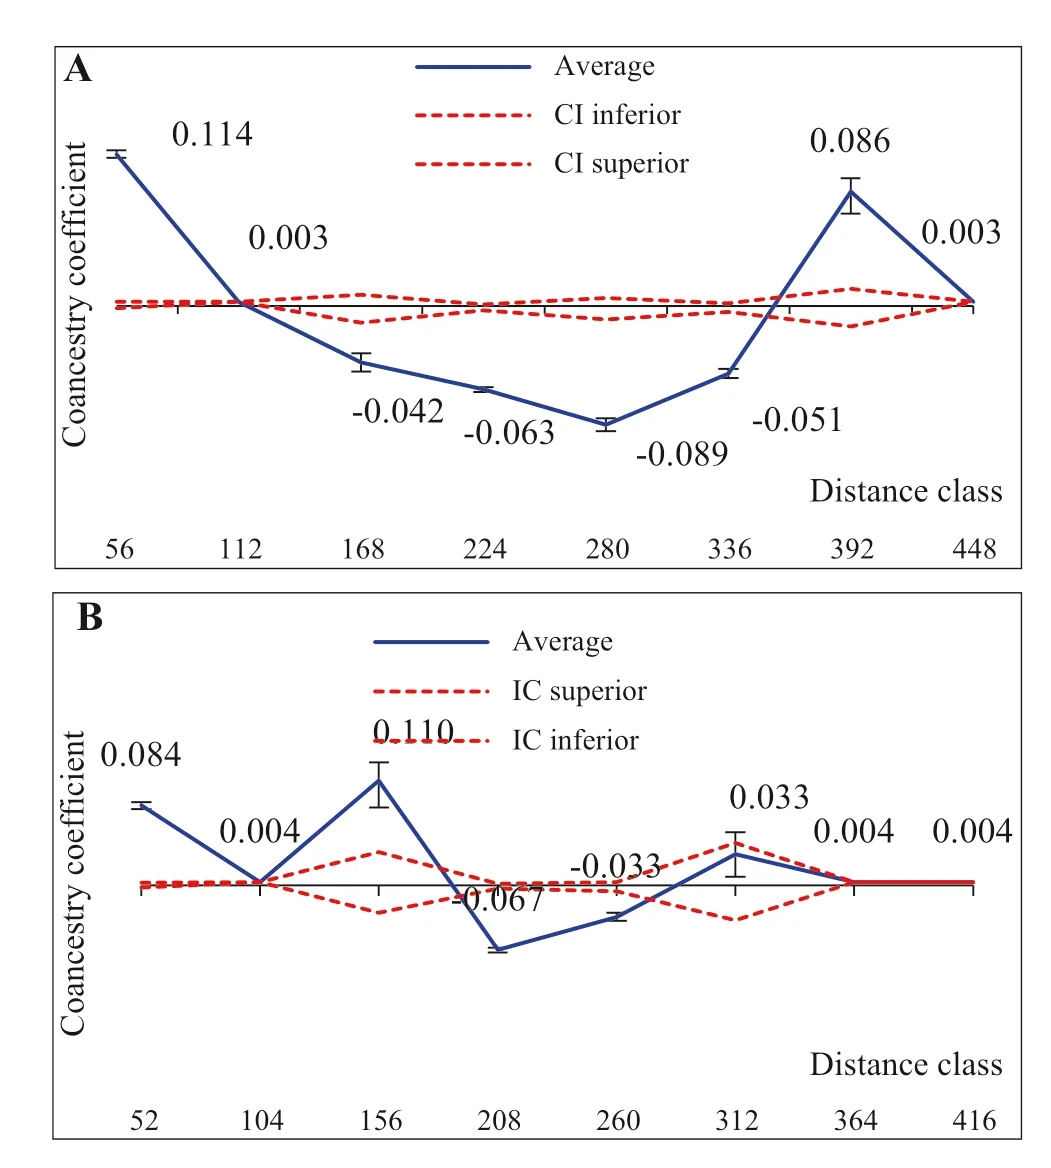
Fig.5 a Correlogram for the coancestry coeffi cient for distance classes of Guadua weberbaueri culms sampled in FAPB areas and b FAPBA, with 95% confidence interval
In the FAPB population, the pairs of first-class individuals were positive and significant at 5% ( p < 0.01; Fig.5 a), indicating that plants up to 56 m apart share common alleles with a frequency greater than by chance, showing that closer individuals tend be related. The value of the coancestry coeffi cient (Өxy= 0.11), which is close to that expected among half-sibling individuals, corroborates this information.
The spatial genetic structuring of the genotypes may be related to wind pollination where closer individuals tend to receive more pollen, resulting in greater genetic similarity between geographically closer individuals. Or, it may be attributed to seed dispersal in the vicinity of the maternal trees (Dyer 2007; Vieira et al. 2010a, b; Zhou and Chen 2010; Buzatti et al. 2012; Wang et al. 2012; Aguiar et al. 2013; Dardengo et al. 2016; Ramos et al. 2016).
In the FAPBA population, the pairs of individuals in the first and third classes had positive values of coancestry coefficient at 5% significance ( p < 0.01, Fig.5 b), similar to that found for the FAPB population. Closer individuals tend to be related, observing that the CC value estimated for the first class (Өxy= 0.08) and third class (Өxy= 0.11) is close to that expected between first-cousins and between half-siblings, respectively.
Individuals presented similar genetic structure when the geographical distance between them was up to 56 m for FAPB and up to 156 m for FAPBA. This suggests that in the anthropized area (FAPBA), where there is lower density of individuals, the possibilities of crosses between relatives may occur at greater distances. This possibly occurs because in the anthropic population, the process of regeneration of the vegetation results from a genetic structure formed by many half-siblings. According to Loveless and Hamrick ( 1984), in smaller populations, the rate of homozygotes tends to increase with self-fertilization as well as the crossing of related individuals that are close, as a function of dispersion of pollen and seeds at short distances.
FAPB classes three to six and FAPBA classes four and five showed a negative coancestry coeffi cient, at 5% significance ( p < 0.01), indicating that spatial genetic differentiation between individuals at greater distances is due to the lower similarity between them. According to the results, it can be inferred that the greater the geographical distance between individuals, the smaller or null the degree of kinship. According to Williams et al. ( 2007) and Wang et al. ( 2013), the spatial genetic structure within populations results from a variety of reproductive and genetic processes, including seed dispersal and spatial distribution of the adults; ecological and landscape-related aspects of the species also need to be considered.
Based on the analyses of diversity and genetic structure using ISSR molecular markers, it was concluded that populations of G. weberbaueri in environments with anthropogenic interference showed loss of genetic diversity compared to an environment with no anthropic interference. Most of the genetic variation is within the populations. The occurrence of spatial genetic structure for the two populations was also observed. Individuals from the population with anthropogenic interference exhibited a genetic structure similar to smaller geographic distances than individuals of the native population, indicating a tendency for these individuals to be related. In the literature, information on the genetic structure and diversity of G. weberbaueri is limited, hence these results provide important information for the conservation of the species. Therefore, it is recommended that germplasm should be collected for conservation purposes, avoiding geographically close individuals, in order to sample the maximum genetic variability in the species.
References
Abreu AG, Grombone-Guaratini MT, Monteiro M, Pinheiro JB, Tombolato AFC, Zucchi MI (2011) Development of microsatellite markers for Aulonemia aristulata (Poaceae) and cross-amplification in other bamboo species. Am J Bot 98:90–92
Acre (2006) Governo do Estado do Acre, Programa Estadual de Zoneamento Ecológico Econômico do Estado do Acre, Fase II. Escala 1:250.000. Rio Branco: SEMA.
Aguiar RV, Cansian RL, Kubiak G, Busnello SLB, Tomazoni TA, Budke JC, Mossi AJ (2013) Genetic variability of Eugenia uniflora L. in forest remnants at different successional stages. Ceres 60:226–233
Iii APG (2009) An update of the angiosperm phylogeny group classification for the orders and families of flowering plants: APG III. Bot J Linn Soc 161:105–121
Bem EAD, Bittencourt JVM, Moraes MLT, Sebben AM (2015) Scenarios of selective logging on genetic diversity and basal area of Araucaria angustifolia populations, with base in Ecogene modeling. Scient Forest 43:453–466
Bernarde OS, Machado RA, Turci LCB (2011) Herpetofauna of Igarape Esperanca area in the Reserva Extrativista Riozinho da Liberdade, Acre-Brazil. Biota Neot 11:117–144
Boza EJ, Irish BM, Meerow AW, Tondo CL, Rodríguez OA, Ventura-López M, Gómez JA, Moore JM, Zhang D, Motamayor JC, Schnell RJ (2013) Genetic diversity, conservation, and utilization of Theobroma cacao L.: genetic resources in the Dominican Republic. Genet Resour Crop Evol 60:605–619
Buzatti RSO, Ribeiro RA, Lemos Filho JP, Lovato MB (2012) Finescale spatial genetic structure of Dalbergia nigra (Fabaceae), a threatened and endemic tree of the Brazilian Atlantic Forest. Gen Mol Biol 35:838–846
Cruz CD (2001) Programa Genes (Versão Windows): aplicativo computacional em genética e estatística. UFV, Viçosa
Daly D (2004) Erythroxylaceae. In: Smith N, Mori SA, Henderson A, et al. (eds) Flowering plants of neotropics. Princeton University Press, The New York Botanical Garden, pp 143–145
Dardengo JFE, Rossi AAB, Silva BM, Silva IV, Silva CJ, Sebbenn AM (2016) Diversity and spatial genetic structure of a natural population of Theobroma speciosum (Malvaceae) in the Brazilian Amazon. Biol Trop 64:1–9
Duarte JF, Carvalho D, Almeida VF (2015) Genetic conservation of Ficus bonijesulapensis RM Castro in a dry forest on limestone outcrops. Biochem Syst Ecol 59:54–62
Dyer RJ (2007) Powers of discerning: challenges to understanding dispersal processes in natural populations. Mol Ecol 16:4881–4882
EMBRAPA (2011) O novo mapa de solos do Brasil: Legenda atualizada escala 1:5.000.000. Rio de Janeiro: Embrapa Solos
Excoffi er L, Laval G, Schneider S (2007) ARLEQUIN a software for population data analysis. Version 3.1. Geneva: University of Geneva. https://cmpg.unibe.ch/softw are/arleq uin3
Forzza RC, Baumgratz JFA, Bicudo CEM, Canhos DAL, Carvalho Junior AA, Coelho MAN, Costa AF, Costa DP, Hopkins MG, Leitman PM, Lohmann LG, Lughadha EN, Maia LC, Martinelli G, Menezes M, Morim MP, Peixoto AL, Pirani JR, Prado J, Queiroz LP, Souza S, Souza VC, Stehmann JR, Sylvestre LS, Walter BMT, Zappi DC (2012) New brazilian floristic list highlights conservation challenges. Bioscience 62:39–45
Gonçalves AC, Vieira FA, Reis CAF, Carvalho D (2010) Conservação de Dimorphandra mollis benth. (Fabaceae) baseada na estrutura genética de populações naturais. Árvore 34:95–101
Gonçalves AO, Pinheiro JB, Zucchi MI, Silva-Mann R (2014) Genetic characterization of the coral tree ( Erythrina velutina Willd.) in areas of low occurrence. Ciênc Agron 45:290–298
Hamrick JL (1991) Correlations between species traits and allozyme diversity: implications for conservation biology. Gen Cons Rare Plants 24:75–86
Hardy O, Vekemans X (2002) SPAGeDi 1.2: a versatile computer program to analyse spatial genetic structure at the individual or population levels. Mol Ecol Notes 2:618–620
Jeong JH, Kim EH, Guo W, Yoo KO, Jo DG, Kim ZS (2010) Genetic diversity and structure of the endangered species Megaleranthis saniculifolia in Korea as revealed by allozyme and ISSR markers. Plant Syst Evol 289:67–76
Kageyama PY, Sebbenn AM, Ribas LA, Gandara FB, Castellen M, Perecim MB, Vencovsky R (2003) Diversidade genética em espécies arbóreas tropicais de diferentes estágios sucessionais por marcadores genéticos. Sci For 64:93–107
Loveless MD, Hamrick JL (1984) Ecological determinants of genetic structure in plant populations. Annu Rev Ecol Syst 15:65–95
Martins K, Ribas LA, Moreno MA, Wadt LHO (2008) Genetic consequences of tree species natural regeneration in an anthropogenic area, Acre State, Brazil. Acta Bot Bras 22:897–904
Miller MP (1997) Tools for population genetics analyses (TFPGA) 1.3: A Windows program for the analysis of allozyme and molecular population genetic data, p 157
Mogg RJ, Bond JM (2003) A cheap, reliable and rapid method ofextracting highquality DNA from plants. Mol Ecol Notes 3:666–668
Moraes MT, Kageayama PY, Sebbenn AM (2005) Diversity and spatial genetic structure in two populations of Myracrodruon urundeuva Fr. All under different antropic conditions. Árvore 29:281–289
Mukherjee AK, Ratha S, Dhar S, Debata AK, Acharya PK, Mandal S, Panda PC, Mahapatra AK (2010) Genetic relationships among 22 taxa of bamboo revealed by ISSR and EST-Based random primers. Biochem Genet 48:1015–1025
Muñoz JE, Londoño X, Rugeles P, Posso AM, Vallejo FA (2010) Diversidad y estructura genética de Guadua angustifolia en la Ecorregión Cafetera colombiana. Rec Nat y Amb 61:45–52
Nei M (1978) Estimation of average heterozygosity and genetic distance from a small number of individuals. Genetics 89:583–590
Nybom H (2004) Comparison of different nuclear DNA markers for estimating intraspecific genetic diversity in plants. Mol Ecol 13:1143–1155
Peakall R, Smouse PE (2006) Genalex 6: genetic analysis in excel. Population genetic software for teaching and research. Mol Ecol Notes 6:288–295
Pereira MAR, Beraldo AL (2007) Bambu de corpo e alma. Bauru, SP: Canal 6 Projetos Editoriais, p 240
Ramos SLF, Dequigiovanni G, Sebbenn AM, Lopes MTG, Kageyama PY, Macêdo JLV, Kirst M, Veasey EA (2016) Spatial genetic structure, genetic diversity and pollen dispersal in a harvested population of Astrocaryum aculeatum in the Brazilian Amazon. BMC Genet 17:1–10
Reis CAF, Souza AM, Mendonça EG, Gonçalvez FR, Melo RMG, Carvalho D (2009) Diversidade e estrutura genética espacial de Calophyllum brasiliense camb. (Clusiaceae) em uma floresta paludosa. Árvore 33:265–275
Rohlf FJ (2000) Numerical taxonomy and multivariate analysis system version 2.11. Applied Biostatistics, New York.
Roldán-Ruiz I, Dendauw J, Van Bockstaele E, Depicker A, De Loose M (2000) AFLP markers reveal high polymorphic rates in ryegrasses ( Lolium spp.). Mol Breed 6:125–134
Tian B, Yang HQ, Wong KM, Liu AZ, Ruan ZY (2012) ISSR analysis shows low genetic diversity versus high genetic differentiation for giant bamboo, Dendrocalamus giganteus (Poaceae: Bambusoideae), in China populations. Gen Resour Crop Evol 59:901–908
Toro MA, Caballero A (2005) Characterization and conservation of genetic diversity in subdivided populations. Philos Trans R Soc B-Biol Sci 360:1367–1378
Vieira FA, Carvalho D, Higuchi P, Machado EL, Santos RM (2010a) Spatial pattern and fine-scale genetic structure indicating recent colonization of the palm Euterpe edulis in a Brazilian Atlantic forest fragment. Bioch Gen 48:96–103
Vieira FA, Santana JAS, Santos RM, Fajardo CG, Coelho GAO, Carvalho D (2010b) DNA extraction protocols and cpDNA primers to Ficus bonijesulapensis (MORACEAE). Rev Caatinga 23:69–74
Wang JL (2004) Application of the one-migrant-per-generation rule to conservation and management. Cons Biol 18:332–343
Wang R, Compton SG, Shi YS, Chen XY (2012) Fragmentation reduces regional-scale spatial genetic structure in a wind-pollinated tree because genetic barriers are removed. Ecol Evol 2:2250–2261
Wang EJ, Glor RR, Losos HB (2013) Quantifying the roles ofecology and geography in spatial genetic divergence. Ecol Lett 16:175–182
Williams DA, Muchugu E, Overholt WA (2007) Colonization patterns of the invasive Brazilian peppertree, Schinus terebinthifolius, in Florida. Heredity 98:284–293
Yang HQ, An MY, Bu ZJ, Tian B (2012) Genetic diversity and differentiation of Dendrocalamus membranaceus (Poaceae: Bambusoideae), a declining bamboo species in Yunnan, China, as Based on inter-simple sequence repeat (ISSR) Analysis. Int J Mol Sci 13:4446–4457
Yeeh Y, Kang SS, Chung MG (1996) Evaluation of the natural monumento populations of Camellia jamponica (Thearaceae) in Korea based on allzyme studies. Bot Bull Acad Sin 37:141–146
Yeh FC, Yang RC, Boyle TBJ, Ye ZH, Mao JX (1997) POPGENE, the user-friendly shareware for population genetic analysis molecular biology and biotechnology center. Edmonton, v.10.
Zhou HP, Chen J (2010) Spatial genetic structure in an understorey dioecious fig species: the roles of seed rain, seed and pollenmediated gene flow, and local selection. J Ecol 98:1168–1177
 Journal of Forestry Research2021年2期
- Journal of Forestry Research的其它文章
- Stem taper functions for Betula platyphylla in the Daxing’an Mountains, northeast China
- Leaf phenotypic variation of endangered plant Tetracentron sinense Oliv. and influence of geographical and climatic factors
- Ecological variations of woody species along an altitudinal gradient in the Qinling Mountains of Central China: area-based versus mass-based expression of leaf traits
- Variations in stem radii of Larix principis-rupprechtii to environmental factors at two slope locations in the Liupan Mountains, northwest China
- A review of ecological mechanisms for management practices of protective forests
- Variation of basic density, calorific value and volumetric shrinkage within tree height and tree age of Ugandan grown Eucalyptus grandis wood
