Leaf phenotypic variation of endangered plant Tetracentron sinense Oliv. and influence of geographical and climatic factors
Yang Li · Shan Li · Xueheng Lu · Qinqin Wang · Hongyan Han · Xuemei Zhang · Yonghong Ma · Xiaohong Gan
Abstract To analyze the degree and pattern of phenotypic variation in leaves of Tetracentron sinense Oliv from the perspective of genetic and environmental adaptation and thus contribute to effective evidence-based conservation and management strategies for germplasm resources, we measured 17 morphological and epidermal micromorphological leaf traits from 24 natural populations of T. sinense. Nested analysis of variance, multiple comparison, principal component analysis (PCA), cluster analysis, and correlation analysis were used to explore phenotypic leaf variation among and within populations and potential correlations with geographic and environmental factors. There were significant differences in 17 leaf phenotypic traits among and within populations. The mean phenotypic differentiation coeffi cient of the 17 traits was 56.34%, and the variation among populations (36.4%) was greater than that within populations (27.2%). The coefficient of variation (CV) ofeach trait ranged from 4.6 to 23.8%, and the mean was 11.8%. Phenotypic variation of leaves was related to environmental factors such as average annual sunshine hours, average July temperature, and average annual rainfall. The variation changed along gradients of longitude, latitude, and altitude. The PCA clustered the 24 natural populations into four groups. Our study suggests that phenotypic variation in T. sinense occurred primarily among populations, with moderate levels of phenotypic differentiation among populations and low levels of phenotypic variation within populations. The plant’s poor adaptability to the environment is likely an important contributor to its endangerment. Accordingly, conservation strategies are proposed to protect and manage the natural populations of T. sinense.
Keywords Tetracentron sinense · Leaf phenotypic traits · Phenotypic variation · Natural population · Endangered plant
Introduction
Phenotypic traits are the result of genetic variation and the interaction of genes and the environment (Jia et al. 2015). Detection of genetic variation by measuring phenotypic traits is the oldest and easiest method for testing genetic variation (Schaal et al. 1991; Li et al. 2005). As an important part of genetic diversity, phenotypic diversity can be easily studied using simple observations and experimental design and thus has received a great deal of attention (Ma 1993 ; Garcia et al. 2008; Rabara et al. 2014; Sreekanth et al. 2014; Singh et al. 2015; Xu et al. 2016; Li et al. 2018). Plant phenotypic diversity is a comprehensive manifestation of genetic diversity and environmental diversity and a series of complex intermediate links between phenotype and genotype, such as gene expression, individual development, and regulation (Li et al. 2002, 2005, 2018; Mohamed et al. 2009; Peterson et al. 2011). Thus, phenotypic differences can be important measures of genotypic differences.
Leaf traits are affected by both genetic and environmental factors (Zhang and Luo 2004; Wang et al. 2009) and malleable to environmental changes. When the environment changes, the probability of leaf traits changing increases. Therefore, phenotypic variation of plant leaves within and among populations can better reflect the interaction between plants and their habitats than a genetic study, and we can also obtain information on plant survival, adaptability, adaptation range, and evolution (Heather et al. 2009; Liu et al. 2011; Wang 2013).
Tetracentron sinense Oliv. is the only tall deciduous tree in the family Tetracentraceae and is mainly distributed in central and southwest China. Fossils of T. sinense have been dated from the Cenozoic Eocene, indicating that it is a relict species with an ancient origin and highlighting its importance in the study of ancient flora systems and the origin and evolution of angiosperms. Due to its value as an ornamental and medicinal plant, and for furniture construction, T. sinense has been overharvested, resulting in poor regeneration of the natural population. Thus, it has been listed in Appendix III of the Convention on International Trade in Endangered Species of Wild Fauna and Flora (CITES). At present, the endangered status of T. sinense has been discussed from the perspective of community ecology (Tian et al. 2008), reproduction development (Gan et al. 2013), pollination ecology (Gan et al. 2013), seed genetic quality (Han et al. 2015; Li et al. 2015), phylogeography and genetic diversity (Sun et al. 2015; Han et al. 2017; Li et al. 2018). However, leaf phenotypic variation and environmental adaptation of natural populations of T. sinense in fragmented habitats have not been studied. Nor do we know whether factors that influence phenotypic variation in leaves have led to its becoming endangered. Understanding these issues should help us to better evaluate the survival and adaptive abilities of T. sinense.
In this study, the phenotypic diversity of leaf traits from 24 natural populations in the fragmented habitats of T. sinense were analyzed. To study phenotypic variation of T. sinense leaves in conjunction with the plants’ environment, we asked: What is the extent of phenotypic differentiation of leaf traits within and among natural populations of T. sinense? What factors affect the leaf phenotypic variation of natural populations of T. sinense? By estimating adaptability and adaptative range of T. sinense to its living environment based on the level of leaf phenotypic variation, we hope to provide a knowledge base for designing effective strategies to conserve and manage populations of T. sinense.
Materials and methods
Selection of populations and samples
T. sinense is mainly distributed in central and southwestern China and to a much lesser extent in Bhutan, India, Nepal, Myanmar and Vietnam (Zhang 1999). In field surveys in July to August 2015, we sampled 24 populations across its range in China using the methodology of Li et al. ( 2018) (Table 1, Fig.1). In principle, more than 10 individuals should be sampled for each population; however, fewer than 10 plants were sampled due to deforestation or sampling diffi culties. Individuals with typical growth, no obvious defects, and no pests and diseases were sampled, and each sample was at least 50 m from other samples to avoid phylogenetic relationships between the plants.
Sampling
Three to four branches with leaves in the middle and lower canopy were collected between 12:00 and 14:00 h and brought back to the laboratory. The voucher specimens were deposited in the herbarium of China West Normal University (CWNU). We also recorded the location (latitude, longitude, and altitude) of the population and individuals as well as climate factors (Table 1).
Morphological traits of leaves
The methods of Qi ( 1996) and Wei et al. ( 2010) were used to measure or calculate traits for T. sinense leaves. Ten leaf morphological traits included leaf length (LL, cm), length of longest leaf (LLEST, cm), width of leaf (LW, cm), total leaf length (LLT, cm), petiole length (LPL, cm), leaf area (LA, cm 2 ), leaf circumference (LP, cm), leaf shape index (LSI), leaf base tipping index (LBPI), and leaf tip tipping index (LTPI) as described by Han et al. ( 2017) for 15 mature leaves from each individual (Fig.2).
Measurement of micromorphological traits of leaf epidermis
To measure the micromorphological traits of leafepidermises, three mature leaves were selected for each individual, and two 1-cm 2 squares were cut from both sides of the midrib. The epidermal pieces were then stained with a saff ron solution (Liu et al. 2009) and observed and photographed from three angles with a Moticam Pro 285A digital microscopic imaging system. The lower epidermal stomata andupper epithelial cells were counted to calculate the lower epidermal stomatal density (SD, per/mm 2 ) and upper epidermal cell density (UECD, per/mm 2 ). Three stomatal apparatuses were selected for each field of view of the lower epidermis, and three epidermal cells were selected for each field of view of the upper epidermis. The stomatal apparatus length (SL, μm), stomatal apparatus width (SW, μm), upper epithelial cell perimeter (UECP, μm), and upper epithelial cell area (UECA, μm 2 ) were then measured using the Motic Images Plus 2.0 software, and the upper epithelial cell curvature index (UECUI) calculated (Lu et al. 2012; Zhao et al. 2014).

Table 1 Location and meteorological factors of 24 T . sinense populations
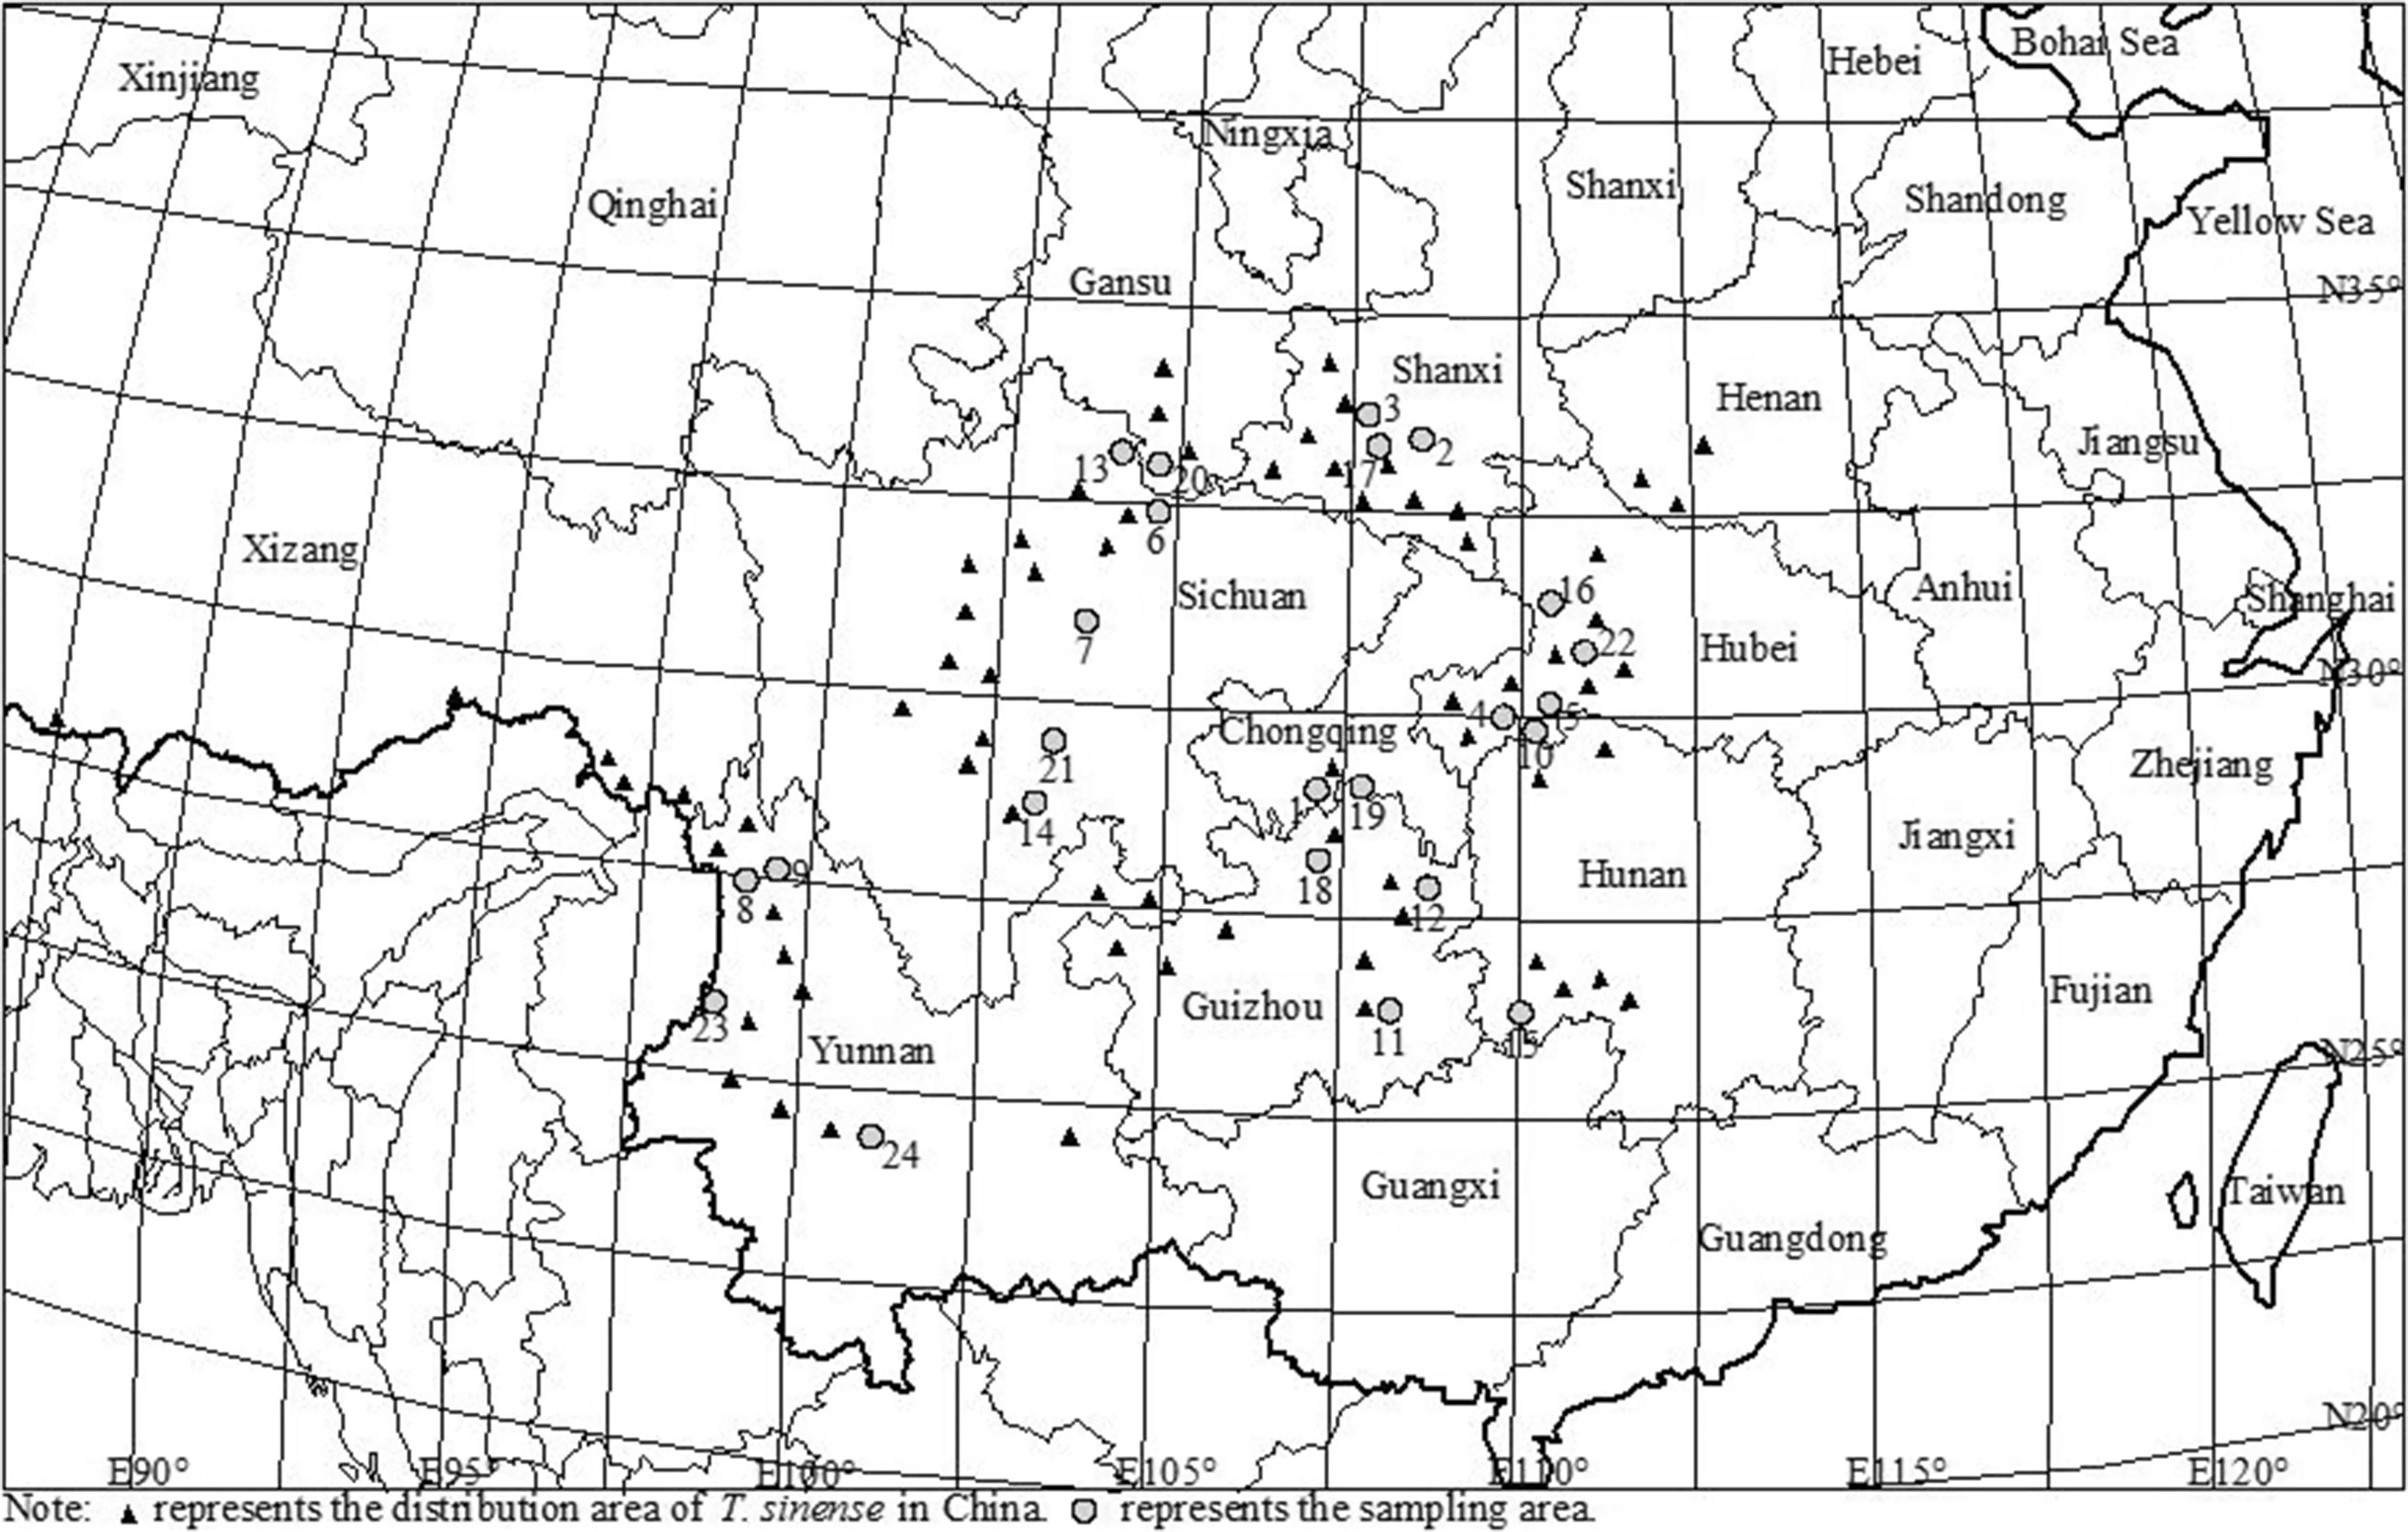
Fig.1 Geographical distribution of the 24 sampled populations of T. sinense
Statistical analyses
The 17 traits were analyzed using a nested variance analysis in SAS 9.3 (Shen 1990). The design test was grouped in one direction (Group represented different T. sinense populations), and the group was divided into subgroups, which represent the different samples in the T. sinense populations, and each subgroup comprised several observations.
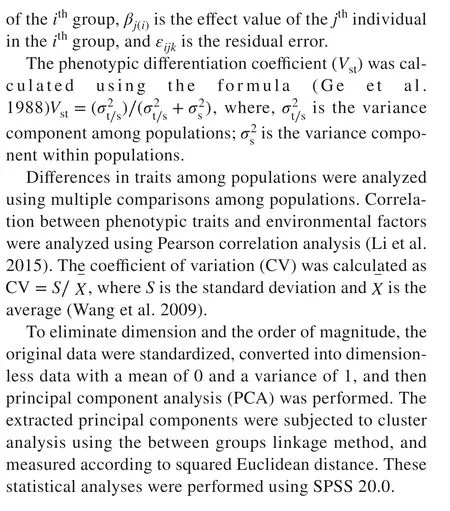
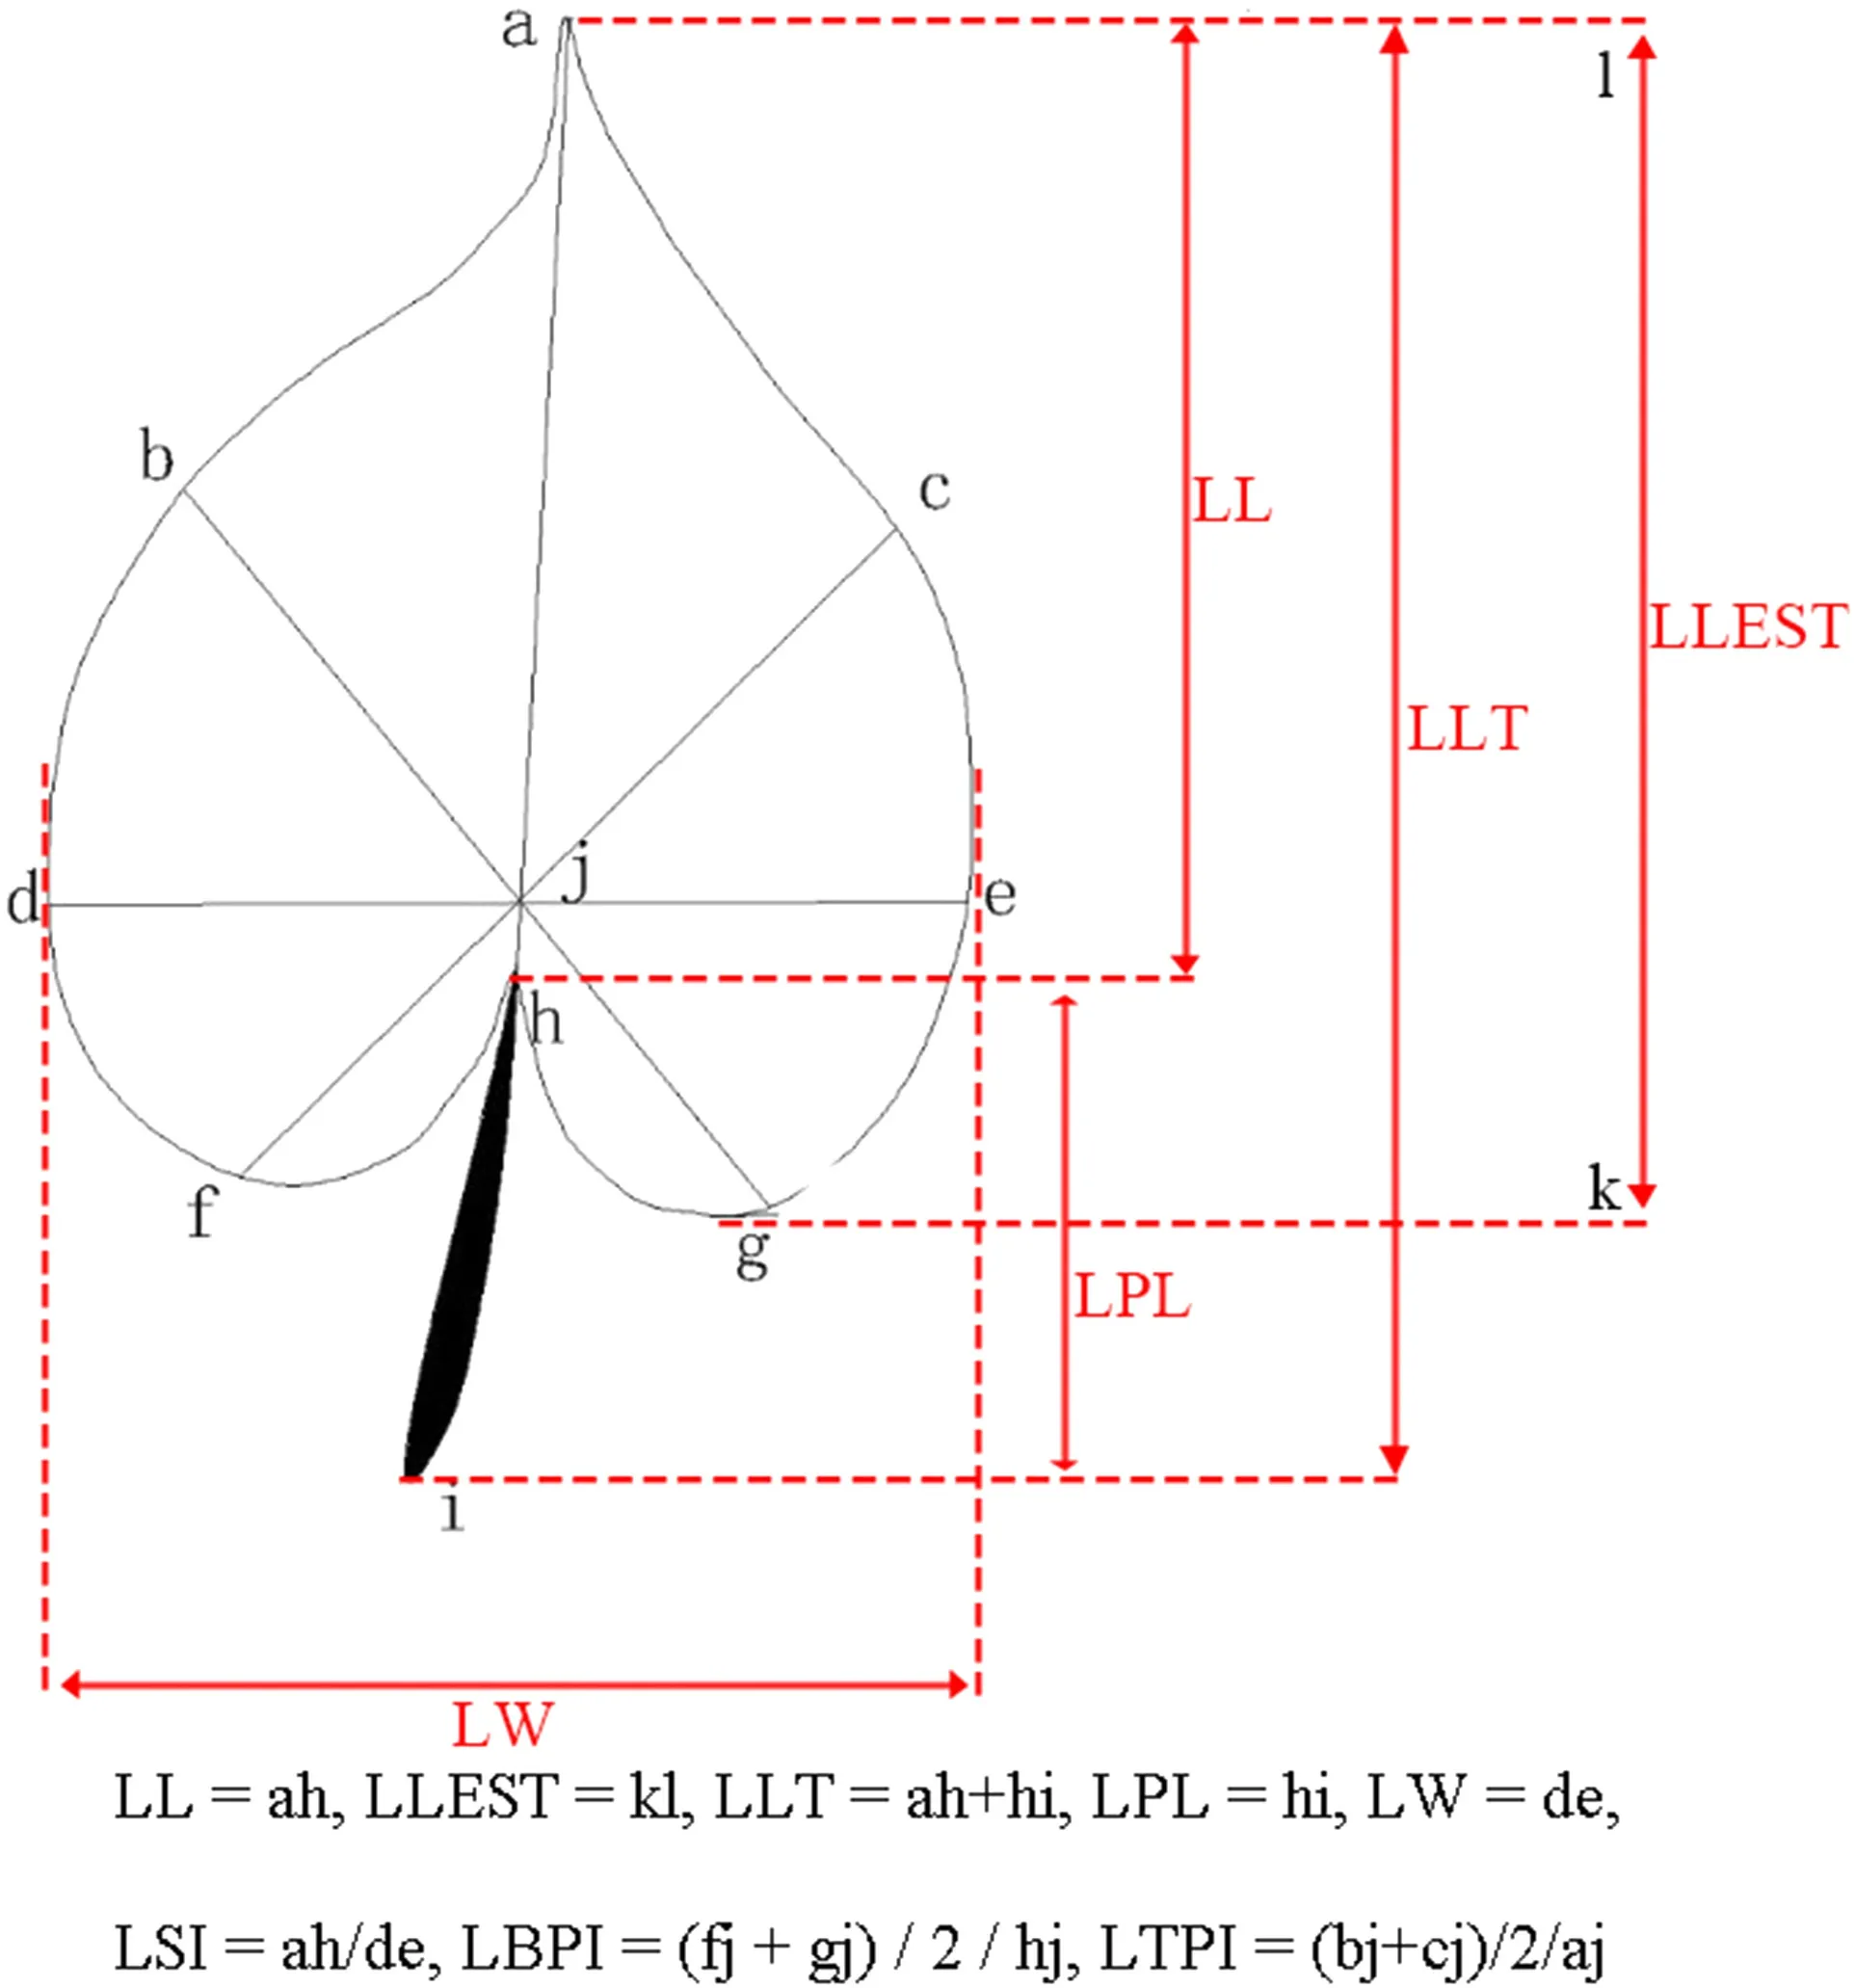
Fig.2 S chematic diagram showing leaf parts measured for eight traits (Han et al. 2017). LL leaf length, LLEST length of longest leaf, LW leaf width, LLT total leaf length, LPL petiole length, LA leaf area, LP leaf circumference, LSI leaf shape index, LBPI leaf base tipping index. LTPI leaf tip tipping index
Results
Phenotypic variation of T. sinense
Nested analysis of variance showed significant differences in the 17 leaf phenotypic traits among and within populations ( F = 2.86 to 120.54; p < 0.01), indicating a certain degree of variation in the morphological and epidermal micromorphological traits of leaves among and within populations (Table 2).
Multiple comparisons further showed that the maximum values for LL and LLEST appeared in the HK population, while the maximum for LLT, LPL, LW, LA, and LP appeared in the BMXS population, indicating relatively larger leaves. The minimum size of leaf traits occurred in the FJS population (Table 3 ), which had relatively smaller leaves. The maximum LSI was found in the LGS population and the minimum in the TJH population, indicating the narrowest leaves in the LGS population and the widest leaves in the TJH population. The maximum values for LBTI and LTPI appeared in the BMXS population and the minimum LBTI appeared in the LGS and minimum LTPI in the FJS populations.
Table 4 shows that the minimum SL and SW were in the GLGS population and the maximum in the TJH population. The minimum SD was in the TJH population and themaximum in the GLGS population. The minimum UECA and UECP were in the ALS population and the maximum in the QZMS population. The minimum UECD was in QZMSn population, the maximum in the ALS population. In addition, the maximum UECUI was in the BH population, and the minimum in the ALS population.

Table 2 Variance analysis of phenotypic traits among and within T. sinense populations
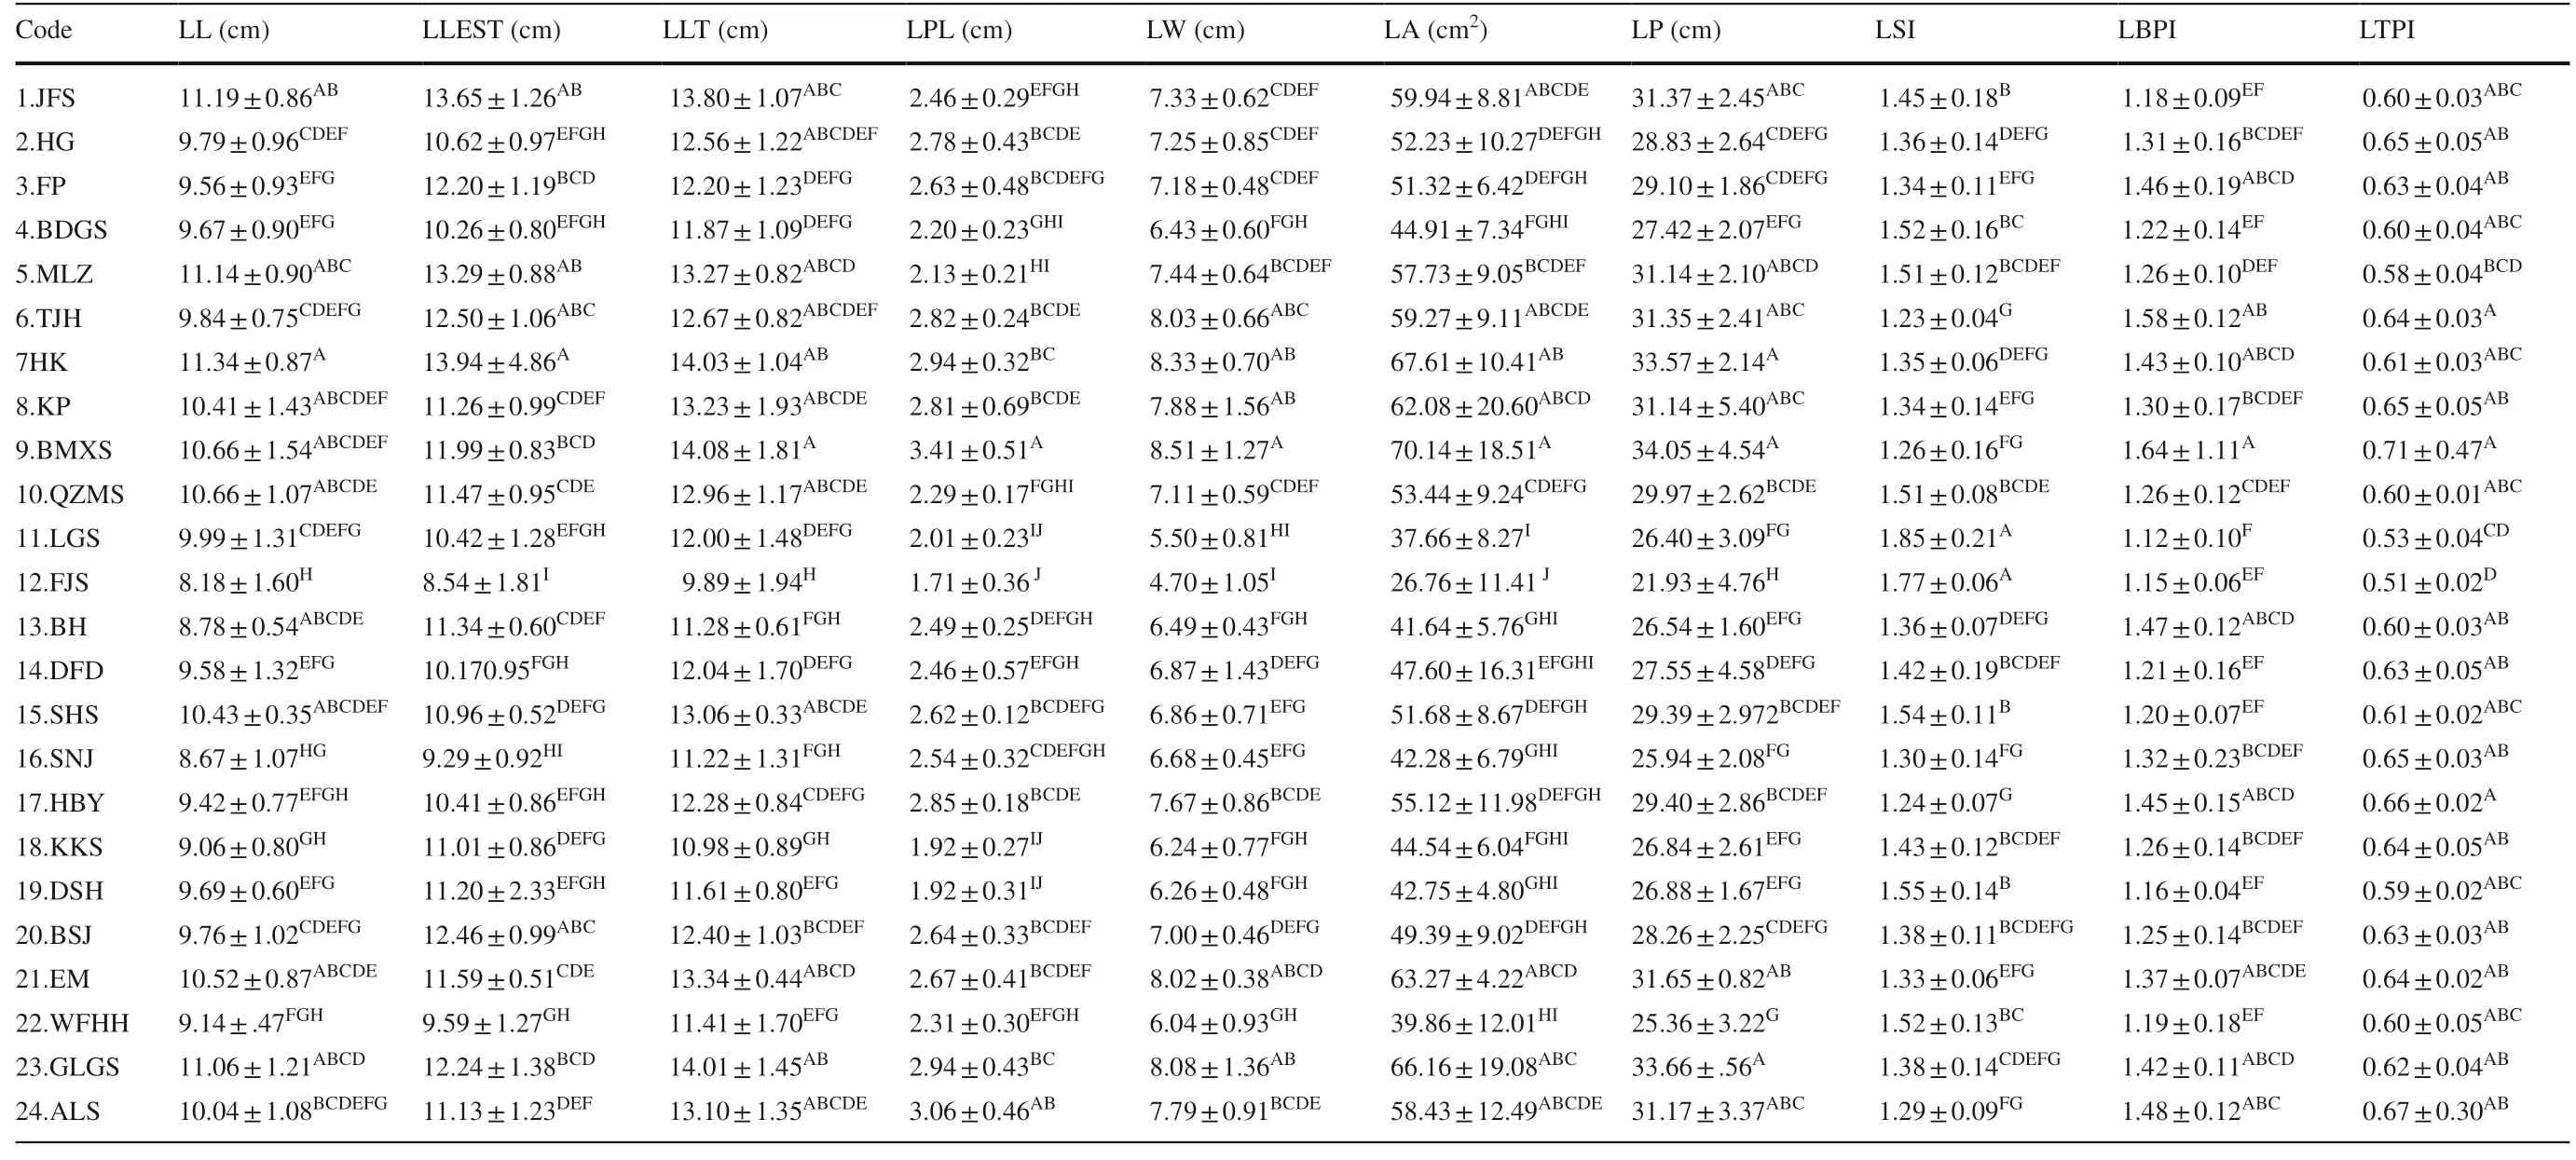
Table 3 Mean, standard deviation and multiple comparison of 10 leaf morphological traits
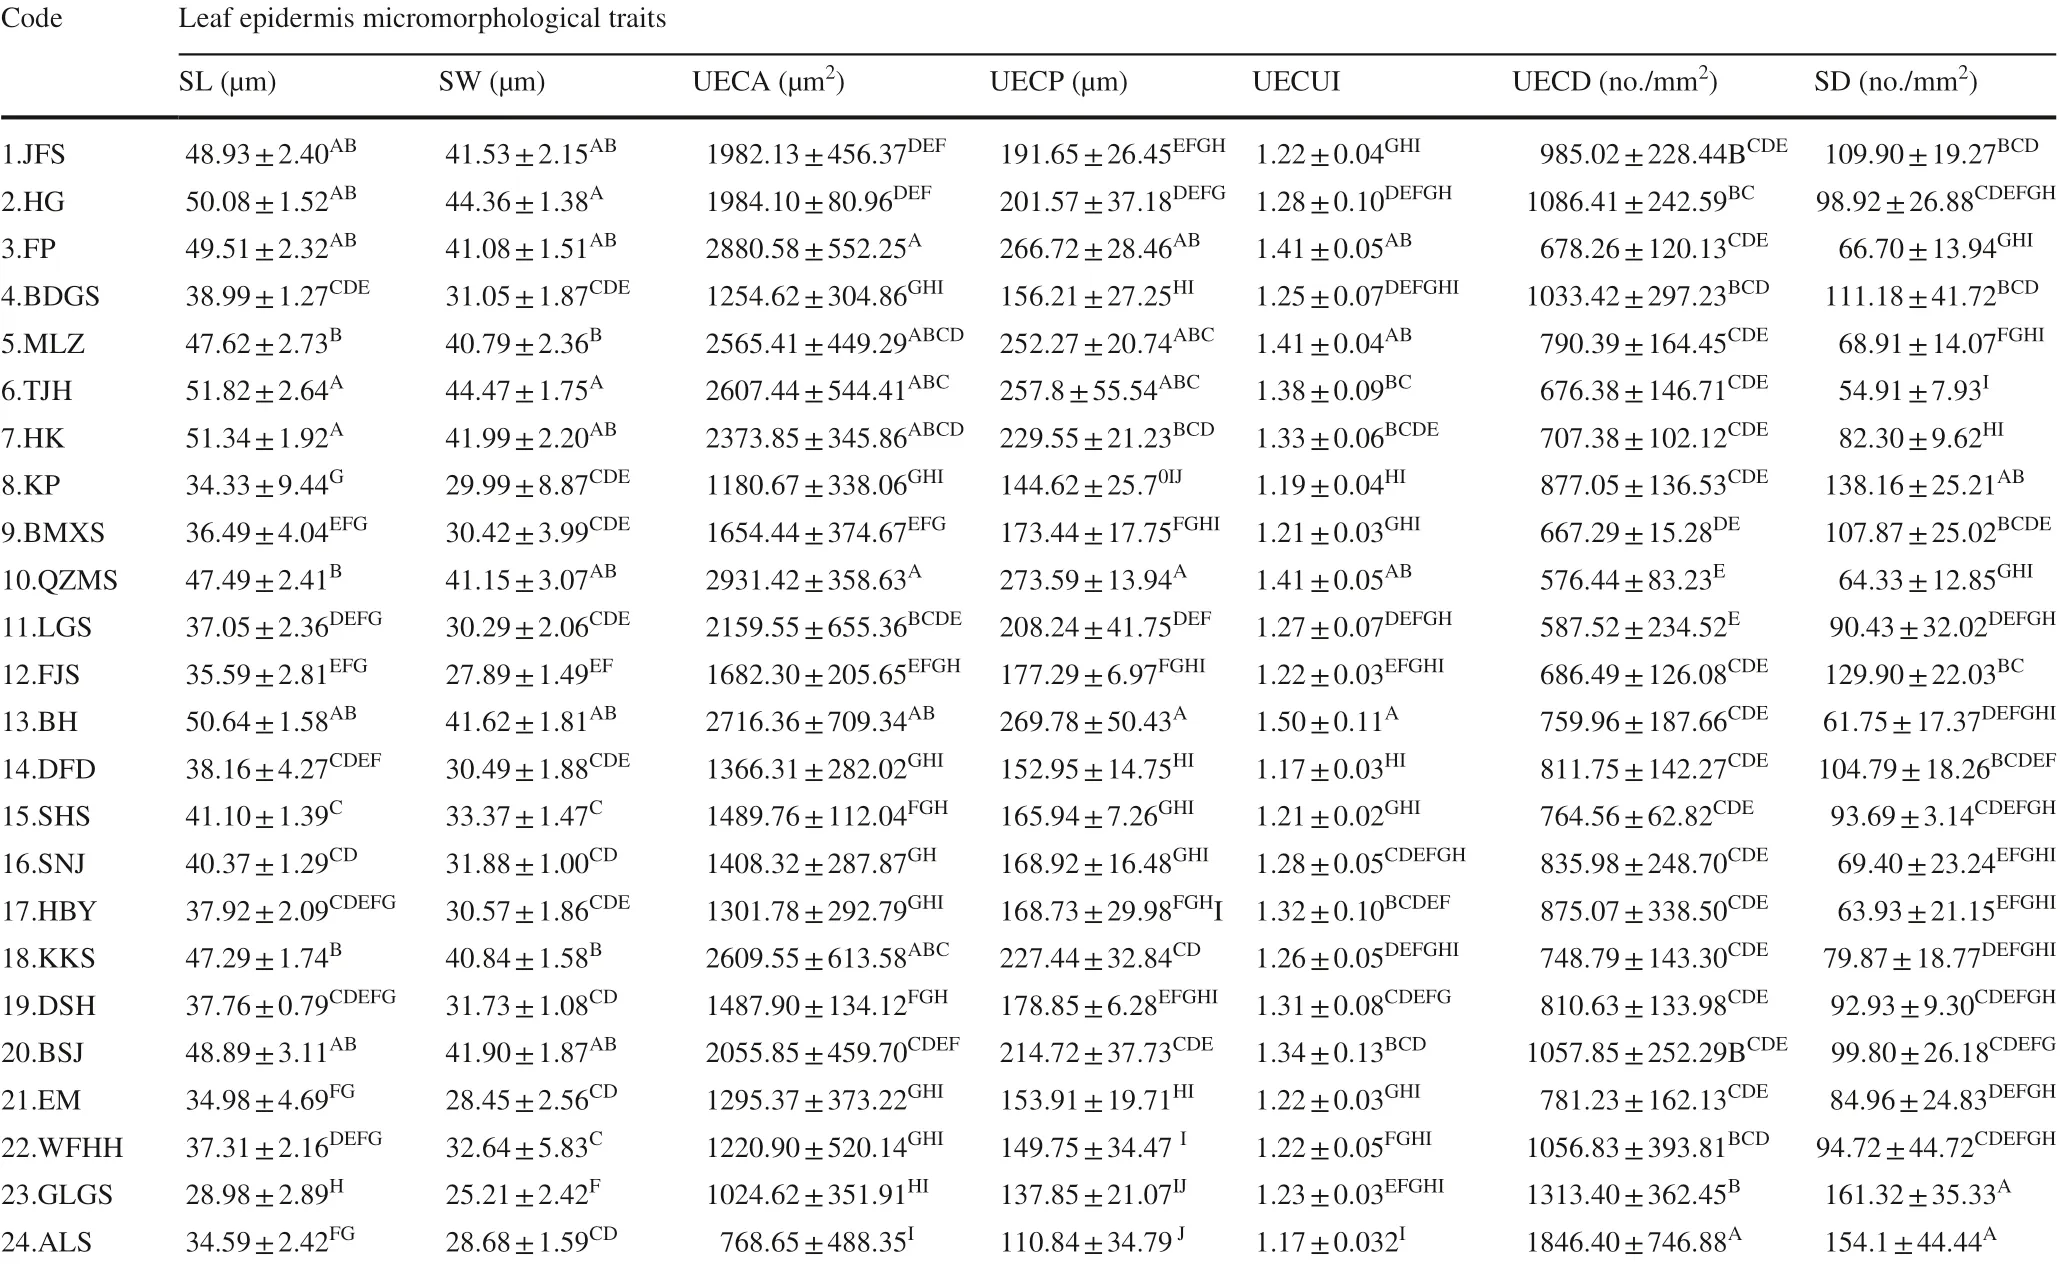
Table 4 Mean, standard deviation and multiple comparison of seven leafepidermis micromorphological traits
Leaf phenotypic variation within each population of T. sinense
The mean CV for the 17 leaf traits was 11.78%, ranging from 4.64% to 23.80%. The CV for the shape index was smaller than for the other single traits such as LSI (CV: 7.29%), LBTI (CV: 8.45%), LTPI (CV: 5.70%), and LECI (CV: 4.64%). The results indicated that the characteristic index of the shape within populations was more stable as compared with the other single traits (Table 5).
The phenotypic variation of the T. sinense leaves within populations ranged from 6.13 to 19.17%. With the exception of the LGS, FJS, and WFHH populations, the mean values of leaf phenotypic variation coeffi cients were less than 15%, indicating that the variation of phenotypic traits in most populations were at lower levels. The lowest mean CV was found in the SHS population, followed in order by population DSH, QZMS, MLZ, HK, TJH, JFS, EM, GLGS, FP, BMXS, BH, KKS, BSJ, DFD, SNJ, HG, BDGS, HBY, ALS, KP, FJS, and LGS; the maximum was found in the WFHH population.
Sources of leaf phenotypic variation and phenotypic differentiation among populations
As seen in Table 6, the phenotypic differentiation coeffi cient for the 17 phenotypic traits in the populations ranged from 27.77 to 89.17%, with the mean at 56.34%. The variance component among populations accounted for 36.40% of the total variation, while that within populations accounted for 27.20%. The variance component among populations was greater than that within populations.
Correlation between leaf phenotypic traits and geoclimatic factors
LLT, LPL, LW, LA, LP, LBPI, LTPI, and SD were significantly or extremely significantly negatively correlated with longitude ( r is − 0.494, − 0.681, − 0.627, − 0.617, − 0.589, − 0.600, − 0.592, and − 0.478, respectively). LSI was significantly positively correlated with longitude ( r = 0.521). SL,SW, UECA, UECP, and UECUI were significantly positively correlated with latitude ( r > 0.5), and SD was significantly negatively correlated with latitude. The correlations between UECUI, UECD, SD, and the nine leaf morphological traits other than the leaf length were significantly or extremely significant (Table 7).
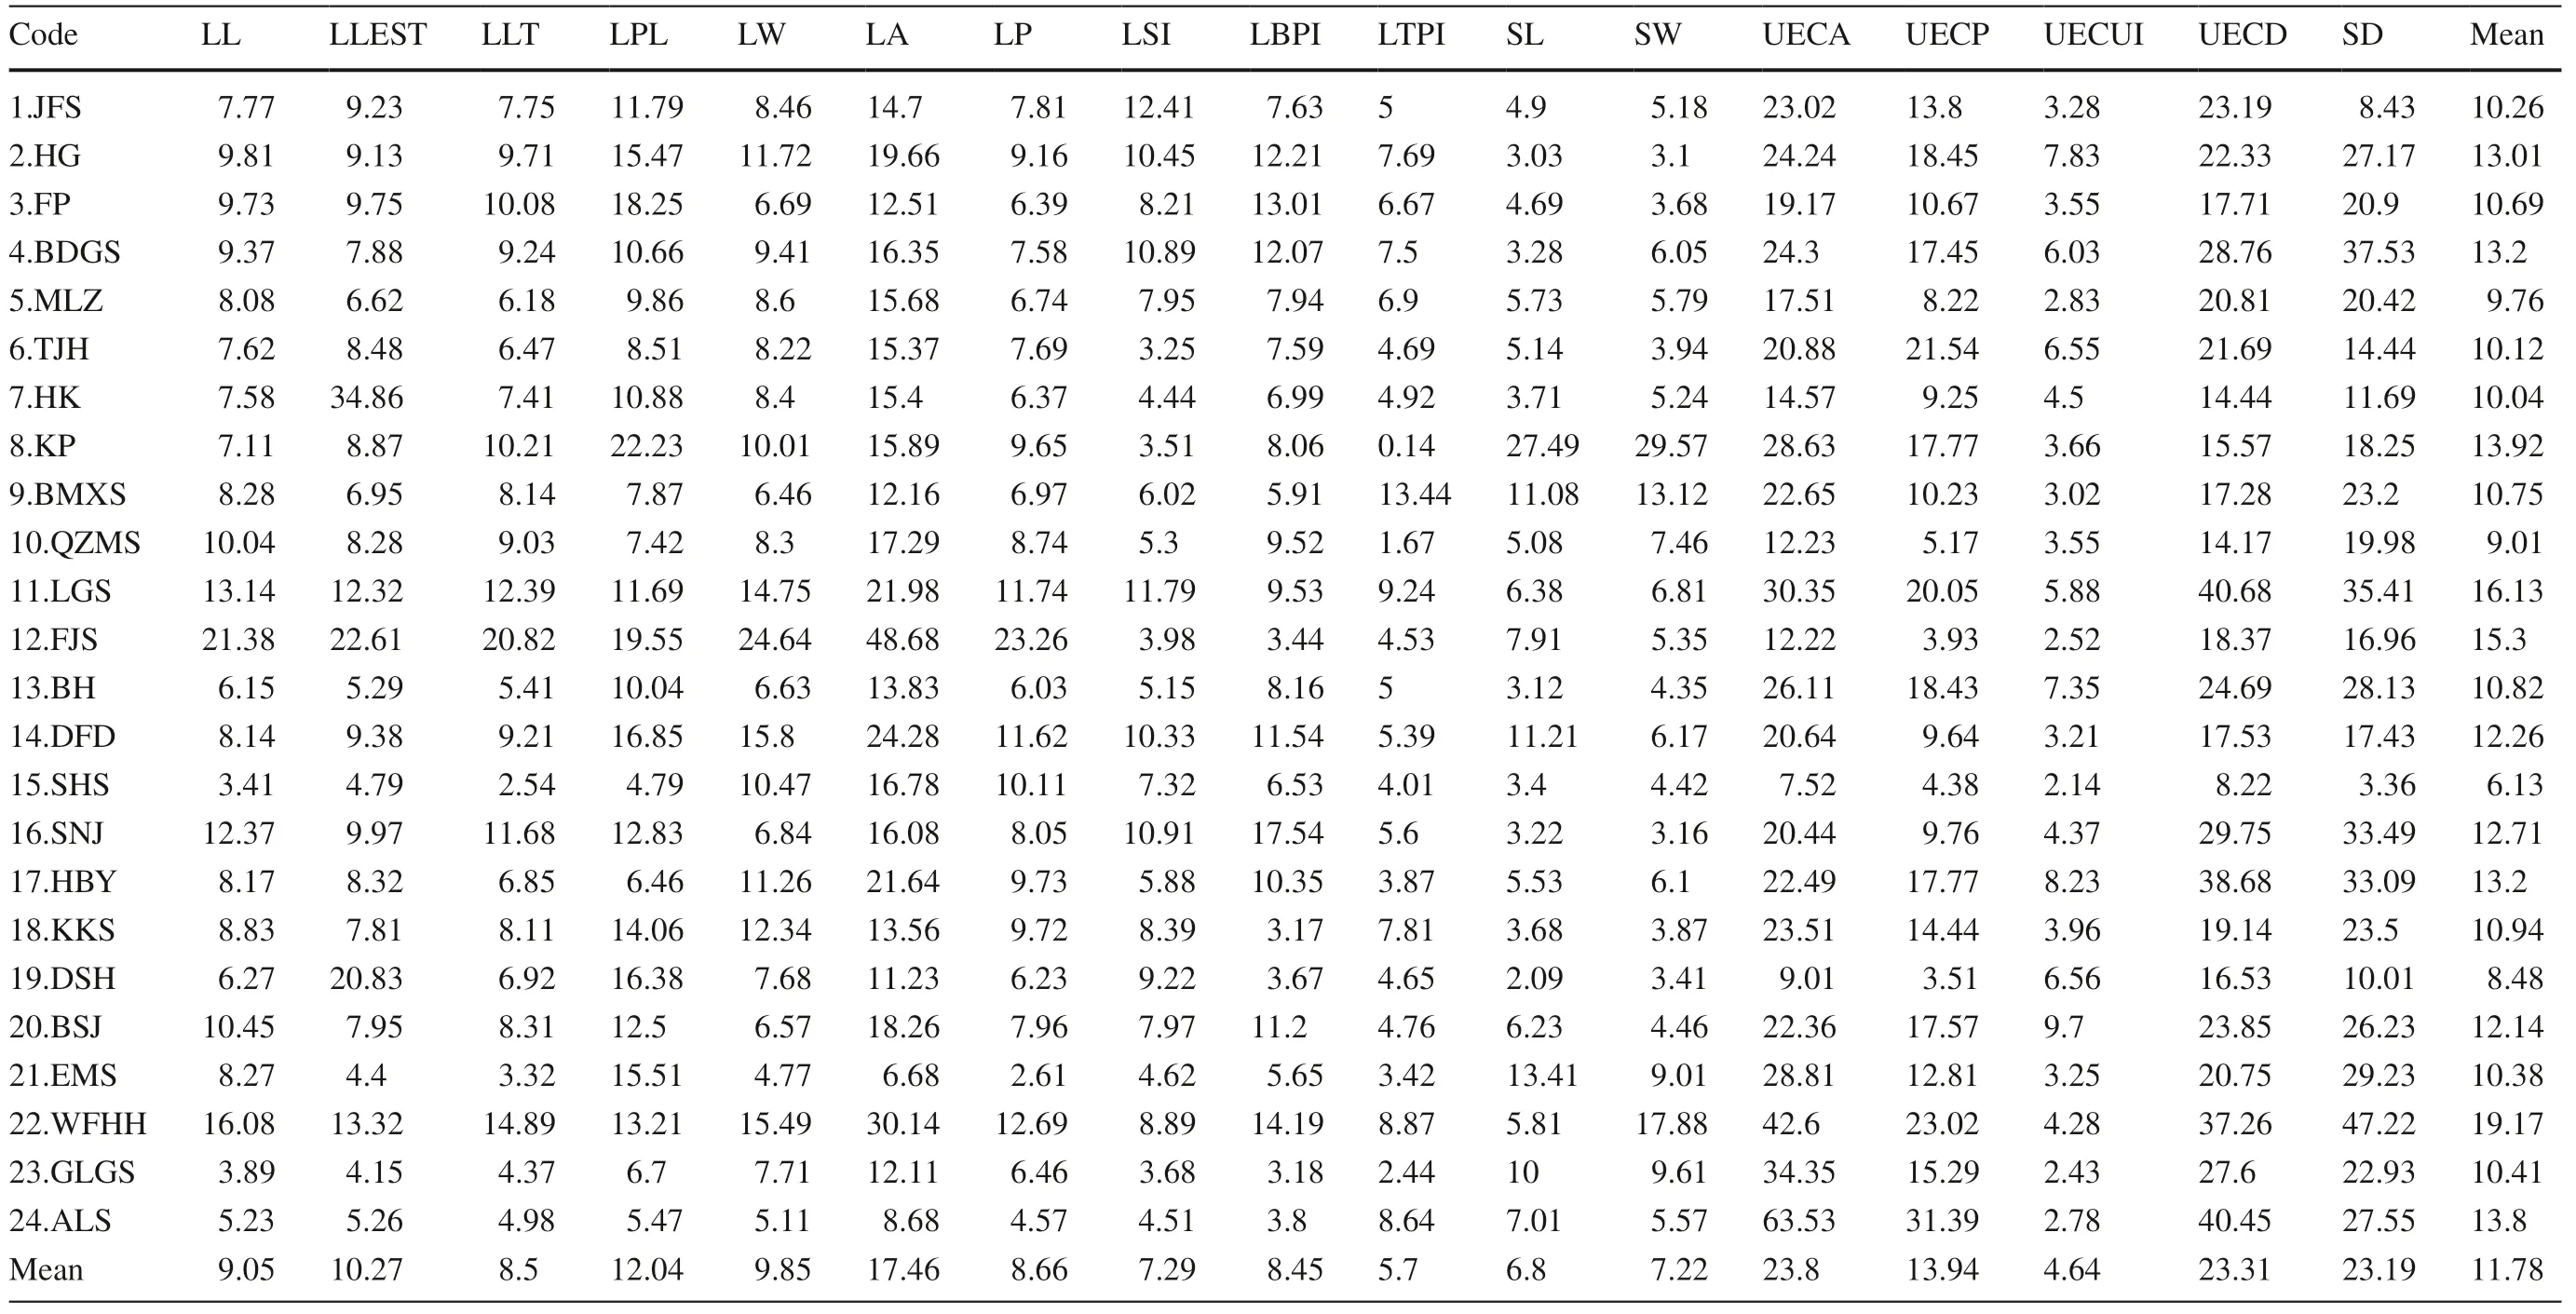
Table 5 Coeffi cient of variation for phenotypic traits of T. sinense populations

Table 6 Variance component and diff erentiation coeffi cients of phenotypic traits among T. sinense populations
In addition, SD was significantly negatively correlated with the July mean temperature ( r = − 0.421). LSI was significantly positively correlated with annual average rainfall ( r = 0.445), and LTPI was significantly negatively correlated with annual average rainfall ( r = − 0.460). LPL, LW, LBPI, LTPI, and UECD were significantly or extremely significantly correlated with annual average hours of sunshine ( r = 0.520, 0.423, 0.464, 0.544, 0.410, respectively). LSI was significantly negatively correlated with the average annual hours of sunshine ( r = − 0.508).
Principal component and cluster analysis of phenotypic traits in T. sinense leaves
In the PCA on the 17 phenotypic traits for T. sinense leaves (Table 8), the three main principal components with roots larger than 1 were obtained, and the cumulative contribution rate reached 86.554%. PC1 was highly correlated with LL, LLEST, LLT, LPL, LW, LP, LA, LBPI, and LTPI, and the contribution rate was 42.009%. PC2 was highly correlated with SL, SW, UECA, UECP, UECUI, UECD, and SD, and the contribution rate was 32.358%. PC3 was highly correlated with LSI, and the contribution rate was 12.186%.
As seen from Fig.3, the 24 natural populations of T. sinense clustered into four groups with a Euclidean distance of 8 as the threshold. DFD, BDGS, DSH, WFHH, SNJ, and LGS clustered into the first group, TJH, HK, BSJ, HG, HBY, SHS, JFS, MLZ, QZMS, FP, KKS, and BH populations in to the second, KP, EM, ALS, and GLGS into the third, and only FJS was in the fourth.
Discussion
Geoclimatic-related variation of leaf phenotypic traits
Differences in the adaptation mechanisms and sensitivity of plants to environmental factors in different geoclimates leads to variations in the leaves of different plants (Li and Gu 2005; Yan et al. 2007; Yang et al. 2015). In this study, the phenotypic traits of T. sinense leaves showed a certain amount of variation with change in geoclimatic factors. Due to the influence of sunshine hours (increasing from southeast to northwest), values for leaf morphological traits such as LLT, LPL, LP, LA, LBPI, and LTPI tended to increase from east to west. With increasing latitude, values for leafepidermal micromorphological traits suchas SL, SW, UECA, UECP, and UECUI increased, while SD decreased, perhaps due to temperature. In addition, the phenotypic traits of T. sinense leaves showed the typical, expected response to a vertical elevation gradient. Most leaf morphological traits and UECD and SD increased as altitude increased. The results showed that the leaf phenotypic traits of T. sinense showed a pattern of gradual change in response to latitude, longitude, and altitude, similar to the responses of Ulmus lamellosa (Zheng et al. 2013) and Kingdonia uniflora (Liu et al. 2011). This pattern of gradual variation shows a certain continuity in both the horizontal and vertical directions.

Table 7 Correlation between geoclimatic factors and phenotypic traits of T. sinense populations

Table 8 Principal component analysis of phenotypic traits of T. sinense
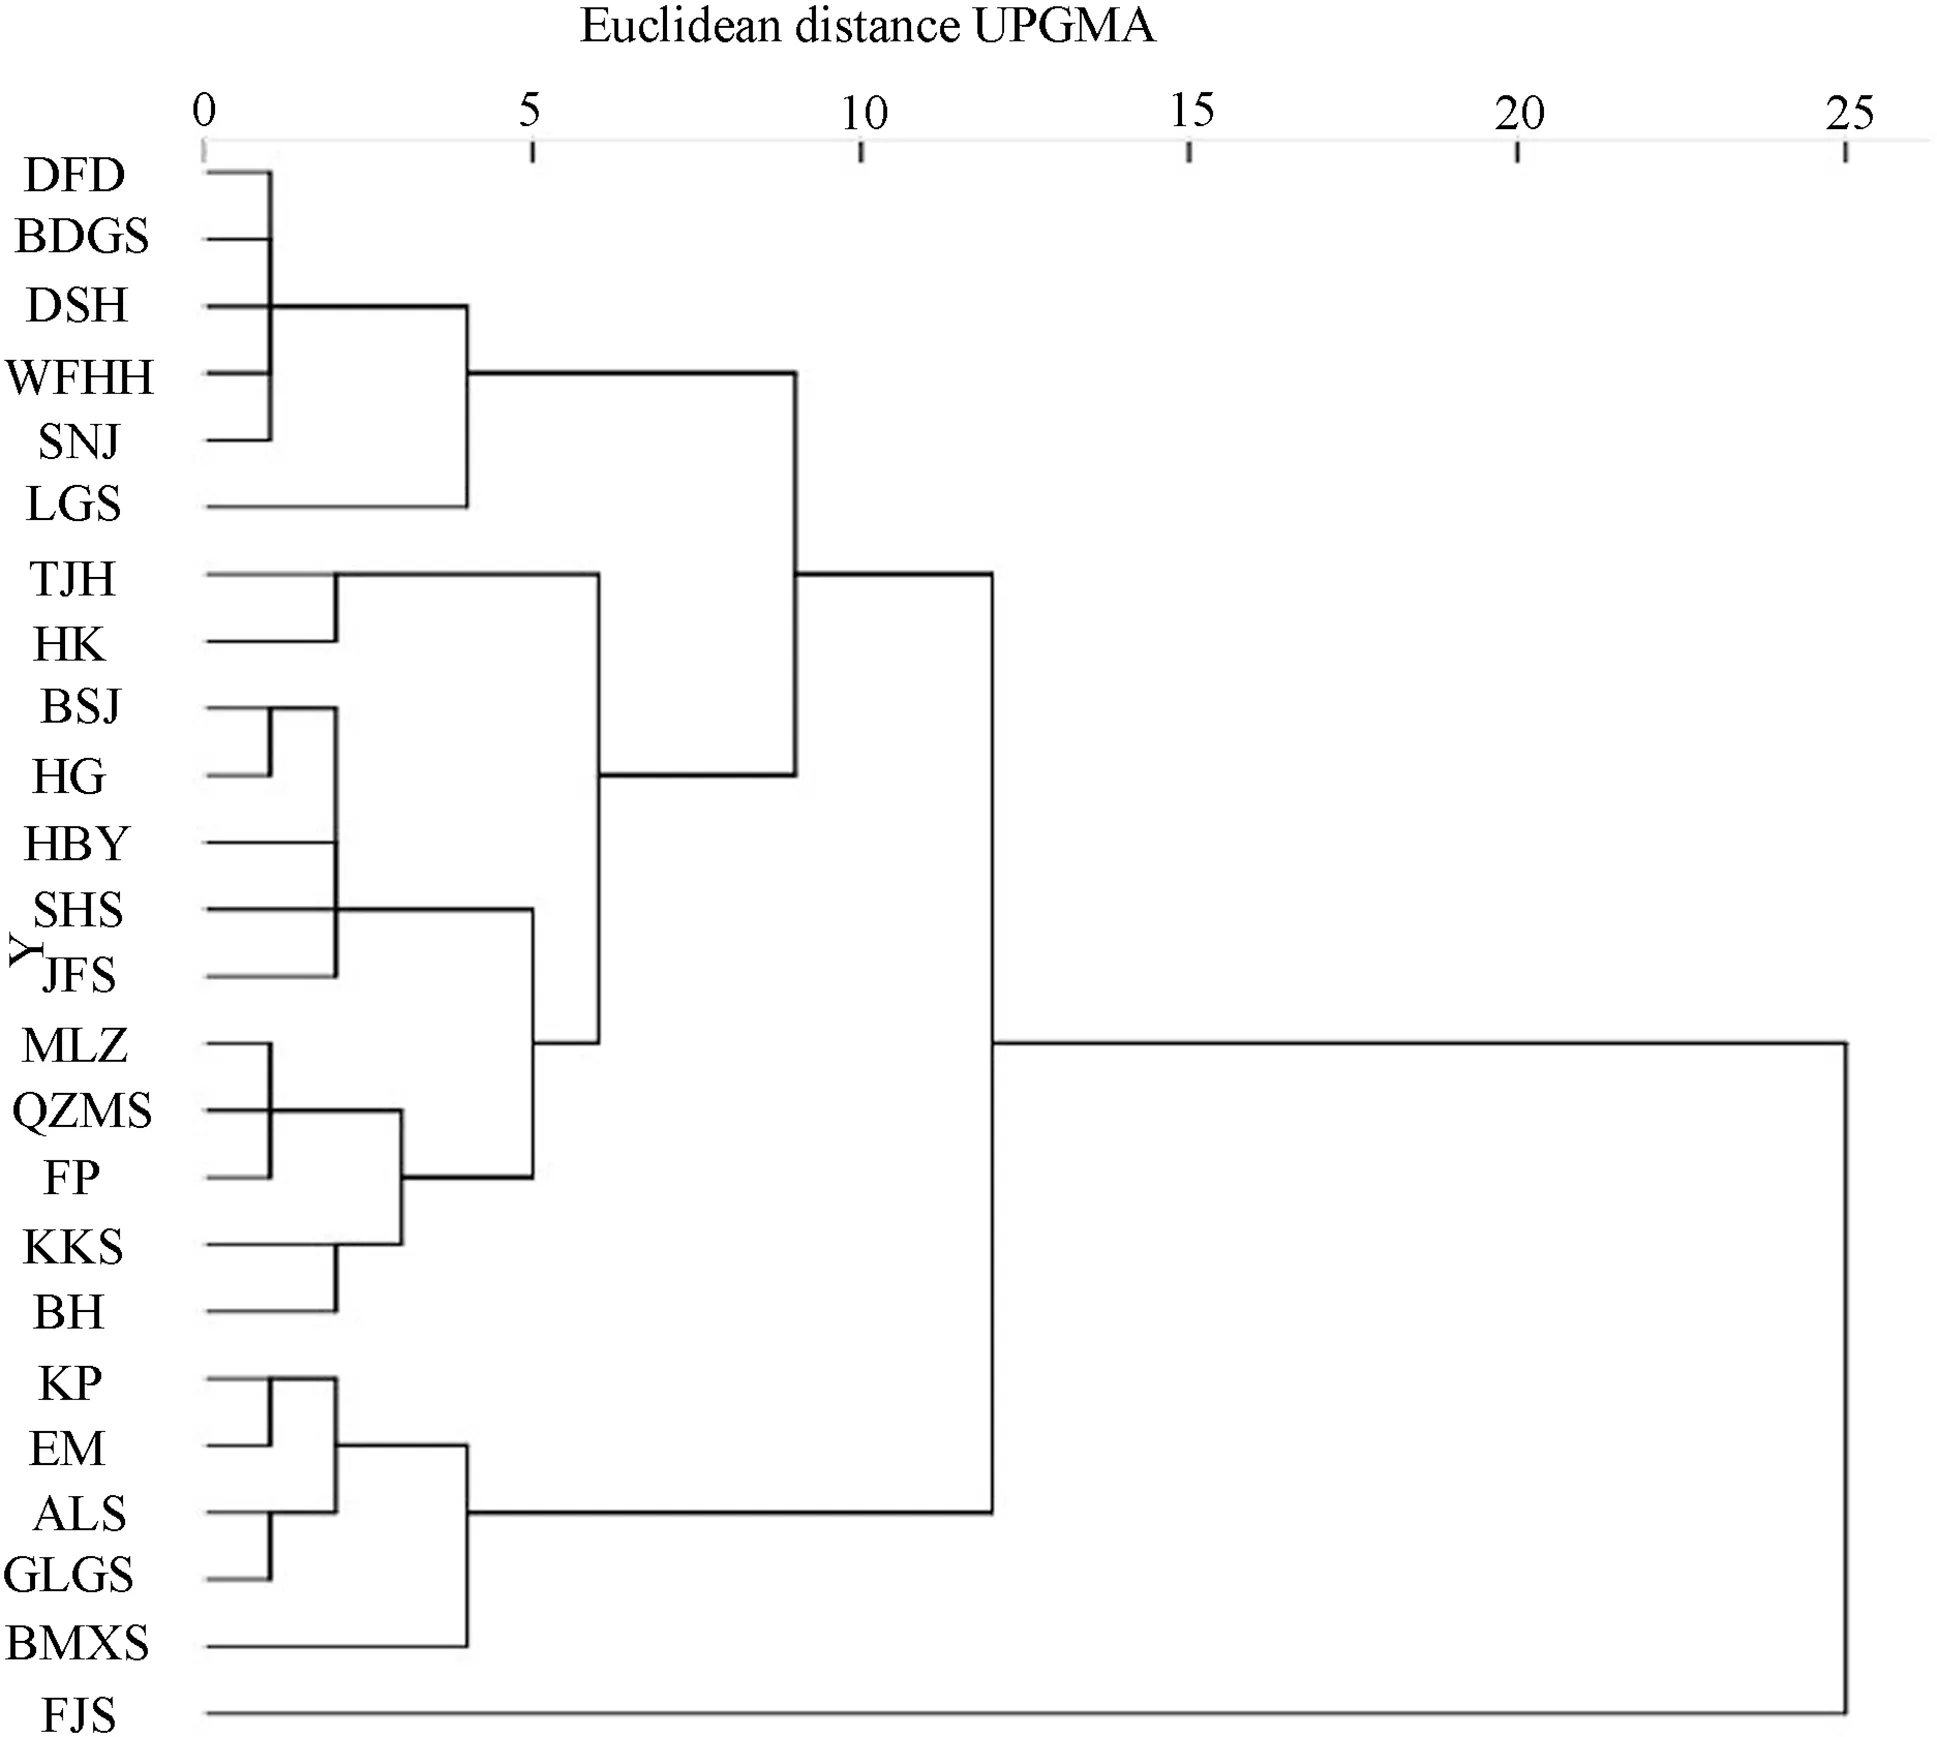
Fig.3 The UPGMA cluster based on phenotypic traits of Tetracentron sinense populations
Under the combined effects of several factors (natural selection, genetic drift, and gene flow), plant phenotypes can develop multiple patterns of variation, such as continual change, regional stratification, and randomization with geographic location (Xu 1992). Cluster analysis of 24 populations of T. sinense showed that most adjacent populations, such as the BDGS, DSH, WFHH, and SNJ populations, the KP, ALS, GLGS, and BMXS populations, or the MLZ and QZMS populations can be clustered together. This reflects patterns of geographical variation, regional fragmentation, and continuation, and also coincides with the geographical variation of T. sinense leaf phenotypic traits. However, a few populations that clustered together were distant from other groups, such as DFD and BDGS populations, demonstrating random variation patterns. These results indicate that the leaf phenotype of T. sinense presents three geographical variation patterns: continuous variation, regional variation, and random variation. This result is similar to that of Magnolia offi cinalis (Shu et al. 2009).
Leaf phenotypic variation among and within T. sinense populations
Leaf phenotypic traits varied among and within populations of T. sinense. The mean variance components among T. sinense populations (36.4%) was greater than within populations (27.2%), and the average phenotypic differentiation coeffi cient among populations (56.34%) was greater than 50%. This result indicates a certain degree of variation in the phenotype of T. sinense leaves among and within populations, but the variation among populations was the main source of phenotypic variation. The diversity of T. sinense leaf phenotypes among populations was greater than the diversity within populations. The phenotypic differentiation level among populations was lower than that of some endangered plants, such as Rosa praelucens ( Vst= 69.56%) (Li et al. 2013a, b) and Coptis teeta ( Vst= 74.41%) (Yang et al. 2013), but higher than that of Ulmus lamellosa ( Vst= 28.104%) (Zheng et al. 2013) and Calycanthus chinensis ( Vst= 17.1%) (Gu et al. 2010). This result indicates that the phenotypic differentiation among T. sinense populations is moderate.
This phenotypic differentiation among populations not only reflects the geographical and reproductive isolation of the populations, but also the differences in adaptability and adaptation range of different populations to different environments, so knowledge about variation among populations is particularly important (Hartl and Clark 1997). Because plant phenotypic traits are the result of the combined effects ofenvironment and genetics and the leaf phenotypic traits of T. sinense were mainly affected by the average temperature in July and annual rainfall and sunshine hours, we can speculate that this phenotypic differentiation among T. sinense populations can be attributed to long-term environmental selection pressure, and represents adaptive evolution to different living environments.
Leaves not only are critical for photosynthesis and respiration, they play an important role in long-term adaptation, survival, and evolution (Chechowitz et al. 1990; Bacilieri et al. 1995; Chaerle et al. 2005; Li et al. 2013a, b). In T. sinense, the Vstranged from 27.77 to 89.17%. Among phenotypic traits, LLEST, LW, LPL, and LSI had a higher differentiation degree ( Vst> 60%), but there were still a few traits with a low phenotypic differentiation level, such as SD among populations (> 50%). The results indicated that most leaf phenotypic traits adapted well to a changing environment, although the adaptability of the stomata apparatus was slightly worse. Combined with the wet habitats of T. sinense in the wild, we speculate that this humid environment is responsible for the lower levels of variation in SD. In other words, the lower variation in SD makes the light and water conditions to which T. sinense can adapt more restricted, which limits its range and may be an important reason leading to its endangerment.
The mean variation coeffi cient of the 24 populations of T. sinense was only 11.78%, which is lower than that of some endangered plants, such as Rosa praelucens (CV = 22.88%) (Li et al. 2013a, b), Coptis teeta (CV = 33.6%) (Yang et al. 2013), Ulmus lamellosa (CV = 28.70%) (Zheng et al. 2013), and Calycanthus chinensis (CV = 14.19%) (Gu et al. 2010). This result shows that the level of leaf phenotypic variation within T. sinense populations was relatively low. Among populations SHS, DSH, QZMS and MLZ, phenotypic variation was extremely low, with the CV at less than 10%. The leaf phenotypic variation in the WFHH population was the highest (CV 19.17%), while the SHH population had the lowest leaf phenotypic variation (CV 6.13%). The lower levels of phenotypic variation within populations can be attributed to the small size of the wild populations, the low level of genetic variation caused by the self-pollination mating system (Li et al. 2018), and the poor heterogeneity of microhabitats within populations (Gan et al. 2013). This lower level of phenotypic variation will reduce individual fitness, which needs to be taken into account in future protection work. The phenotypic variation of the WFHH population in the Wuling Mountains was relatively higher, which may be related to its topographical features. The area is characterized by the concentrated distribution of rare plants from the Tertiary Period (Song and Liu 1999) and is in the transitional zone from the second step (Altitude: 1000–2000 m) to the third step (Altitude: Below 500 m) of China’s topography. In this area, the topography is complex, the change in altitude is large, and there is a diversity of microhabitats, providing an environment for a high level of phenotypic diversity.
Implications for conservation and management
On the basis ofour results presented here, we propose the following protection and management strategies: (1) As a primary measure, strengthen the protection of the existing natural populations of T. sinense and their habitats. (2) Because of the low levels of variation within populations, reduced adaptation range, and poor adaptability, gene exchange among populations needs to be promoted by transplanting individual plants or manual selective pollinations to enhance the fitness ofoff spring. Related populations can serve as appropriate outcrosses for related populations. (3) The WFHH population, with its rich variation and strong adaptability, should be designated as a key protection area for in situ conservation and a germplasm source for breeding. For populations with low phenotypic variation and weak viability, such as the DSH and the SHS populations, the population size should be increased with seedlings, combined with in situ and ex situ conservation measures to reduce the chance of local population extinction.
Conclusion
The phenotypic traits of T. sinense leaves differed significantly among and within 24 natural populations with gradations in longitude, latitude, and altitude. The clustering of the four major groups reflects the continuation, regional stratification, and randomization patterns of phenotypic variation of T. sinense. The variation among populations is the main source of leaf phenotypic variation. Compared with the level of phenotypic differentiation ofother endangered plants, the level among T. sinense populations is moderate. Each leaf phenotypic trait has a lower level of variability within populations, and the differentiation level of stomata traits was extremely low, which may lead to a gradual reduction of its adaptation range, adaptability, and population size. We propose to appropriately promote intergroup genetic exchange based on the existing genetic relationship among populations, which based on existing habitat protection. In addition, the WFHH population can be used as a key area for in situ conservation and the DSH population for ex situ conservation.
AcknowledgementsWe thank Yang Chen, Wenying Li, Zhongqiong Tian, Weili Mao, Huang Zhang and Fan Duan for help collecting and analyzing data.
Author contributionsYL and SL collected samples, measured samples and statistical analyses; XGan conceived the project, designed the study, and did part of the experiments; XL, QW, HH, XZ and YM contributed to the statistical analyses. All authors read and approved the final manuscript.
References
Bacilieri R, Ducousso A, Kremer A (1995) Genetic, morphological, ecological and phenological differentiation between Quercus petraea (Matt.) Liebl. and Quer-cus robur L. in a mixed stand of northwest of France. Silvae Genetica 44(1):1–10
Chaerle L, Saibo N, Van DSD (2005) Tuning the pores: towards engineering plants for improved water use effi ciency. Trends Biotechnol 23(6):308–315
Chechowitz N, Chappell DM, Guttman SI (1990) Morphological, electrophoretic, and ecological analysis of Quercus macrocarpa populations in the Black Hillsof South Dakota and Wyomin. Can J Bot 68(10):2185–2194
Fu LG, Jin JM (1992) Chinese plant red book. Science Press, Beijing, pp 590–591
Gan XH, Cao LL, Zhang X, Li HC (2013) Floral biology, breeding system and pollination ecology of an endangered tree Tetracentron sinense Oliv. Bot Stud 54(1):50
Garcia JQ, Ivancic A, Lebot V (2008) Morphological variation and reproductive characteristics of wild giant taro ( Alocasia macrorrhizos, Araceae) populations in Vanuatu. NZ J Bot 46(2):189–203
Ge S, Wang M, Chen Y (1988) An analysis of population genetic structure of masson pine by isozyme technique. Scientia Silvae Sinicae 24(4):399–409
Gu JJ, Jin Z, Xiong N (2010) Morphological variation of flowers in endangered plant Sinocalycanthus chinensis. Bull Bot Res 30(4):461–467
Han HY, Li S, Gan XH, Zhang XM (2017) Phenotypic diversity in natural populations of an endangered plant Tetracentron sinense Oliv. Bot Sci 95(2):283–294
Han HY, Xu N, Li S, Zhang XM, Li X, Li MT, Gan XH (2015) The effect of low temperature during imbibition on germination characteristics of Tetracentron sinense (Tetracentraceae) seeds. Plant Divers Resour 37(5):586–594
Hao L, Zhang GS, Bai YR, Wang Y, Li XL, Wu W, Mu XY, Yan ZJ, Wang H (2015) Leaf character variations among different populations of Salix psammophila in china. J Arid Land Resour Environ 29(10):112–116
Hartl D, Clark A (1997) Principles of population genetics, 3rd edn. Sinauer Associates, Inc., Sunderland, MA, 1:670
Jia CH, Zhang L, Wei X, Yu J, Li M (2015) Phenotypic polymorphism of Litsea mollis Hemsl in West Sichuan Province. For Res 28(6):844–850
Joesting HM, Mccarthy BC, Brown KJ (2009) Determining the shade tolerance of American chestnut using morphological and physiological leaf parameters. For Ecol Manag 257(1):280–286
Li B, Gu WC, Lu BM (2002) A study on phenotypic diversity of seeds and cones characteristics in Pinus bungeana. natural population. Biodivers Sci 10(2):181–188
Li DS, Shi ZM, Feng QH (2013a) Response of leaf morphometric traits of Quercus species to climate in the temperate zone of the North-South transect ofeastern china. Chin J Plant Ecol 37(9):793–802
Li HC, Gan XH, Zhang ZP, Zhang CX, Song L (2015) Effects of altitudes and the DBH of seed trees on biological characteristics of Tetracentron sinense (Tetracentraceae) seeds. Plant Divers Resour 37(2):177–183
Li M, Han HR, Kang FF, Ma QY (2005) Morphologic variation of leaves of Quercus liaotungensis Koidz. in Lingkong mountain, Shanxi Province. J Beijing For Univ 27(5):10–16
Li SF, Li CJ, Jian HY, Li SB, Xiong J, Li JK, Tang KX (2013b) Studies on phenotypic diversity of vulnerable Rosa praelucens endemic to Shangrila. Yunnan Acta Hortic Sin 40(5):924–932
Li WY, Gu WC (2005) Study on phenotypic diversity of natural population in Quercus mongolica. Scientia Silvae Sinicae 41(1):49–56
Li Y, Liu X, Ma J (2018) Phenotypic variation in phoebe bournei populations preserved in the primary distribution area. J For Res 29(1):1–10
Liu X, Yue M, Ren Y (2011) Morphologic variation of Kingdoniauni flora leaves. Acta Bot Boreali-Occidentalia Sin 31(5):950–957
Liu XF, Liu JQ, Yang CW (2009) Comparison of leaf type and leaf epidermis features from different populations of Syzygium grijsii in Fujian. Subtrop Plant Sci 38(2):33–40
Liu Y (1985) Study on some rare tree species in Qinling mountains- Tetracentron sinense. Shanxi For Sci Technol 3:71–74
Lu C, Wang F, Zhang XP (2012) Leaf comparation on anatomical structure and epidermal characteristics of Pteroceltis tatarinowii Maxim. in different areas. Plant Sci J 30(4):337–351
Ma KP (1993) On the concept of biodiversity. Biodivers Sci 1(1):20–22
Ni SB, Mao CL, Wu Y, Yu WC, Xu YG (2012) Phenotypic variation of leaves from Hevea brasiliensis germplasm resources in Jinghong, Yunnan Province. J Northeast For Univ 40(3):32–35
Peterson BJ, Graves WR, Sharma J (2011) Phenotypic and genotypic diversity ofeastern leatherwood in five populations that span its geographic distribution. Am Midland Nat 165(1):1–21
Qi JZ (1996) A study on the classification grade of Melia toosendan. J Nanjing For Univ 2:71–74
Rabara RC, Ferrer MC, Diaz CL (2014) Phenotypic diversity of farmers’ traditional rice varieties in the philippines. Agronomy 4(2):217–241
Schaal BA, Leverich WJ, Rogstad SH (1991) A comparison of methods for assessing genetic variation in plant conservation biology. In: Falk DA, Holsinger KE (eds) Genetics and conservation of rare plants. Oxford University Press, New York, pp 123–124
Shen XH (1990) Forest Breeding. China Forestry Publishing House, pp. 54–65
Shu X, Yang ZL, Yang X (2009) Variation of leaf characters and seedling growth of Magnolia offi cinalis with different provenances. J Ecol Rural Environ 25(4):19–25
Sidina MM, Hansali ME, Wahid N (2009) Fruit and seed diversity of domesticated carob ( Ceratonia siliqua L.) in Morocco. Sci Hortic 123(1):110–116
Singh O, Bordoloi S, Mahanta N (2015) Variability in cone, seed and seedling characteristics of Pinus kesiya Royle ex. Gordon J For Res 26(2):331–337
Song CS, Liu SX (1999) Scientific survey of the Hubei Houhe nature reserve. China Forestry Publishing House, Beijing, pp 1–199
Sreekanth PM, Balasundaran M, Nazeem PA (2014) Genetic and morphological variation in natural teak ( Tectona grandis ) populations of the Western Ghats in Southern India. J For Res 25(4):805–812
Su SP, Li Y, Zhong PF, Gao Q (2013) Correlation analysis of phenotypic traits of Reaumuria soongorica seed in different natural populations in the Gansu Corridor. Acta Pratacult Sin 22(01):87–94
Sun Y, Moore MJ, Yue L (2015) Chloroplast phylogeography of the East Asian Arcto-Tertiary relict Tetracentron sinense (Trochodendraceae). J Biogeogr 41(9):1721–1732
Tian Q, Cao ZZ, Zhang R (2008) Digital camera and Auto CAD based method for measuring the leaf area of landscape plants. Grassl Turf 3:25–28
Wang YF, Lai GF, Efferth T (2010) New glycosides from Tetracentron sinense and their cytotoxic activity. Chem Biodivers 3(9):1023–1030
Wang YZ (2013) Correlation between foliar δ13 C and foliar trait factors of dominant species in Castanopsis carlessii forests in Lingshishan National Forest Park. Acta Ecol Sin 33(10):3129–3137
Wang YZ, Hong W, Wu CY, Zhen GG, Fan HL, Chen C, Li J (2009) Research on leaf traits for different age leaves of dominant species in Castanopsis carlessi forests in Lingshishan National Forest Park. J Fujian Coll For 29(3):203–209
Wei YM, Wang LH, Cao FL, Wei SQ, Liang YD (2010) Variation and cluster analysis on leaf characters from different provenance sources of Fallopia multiflora. J Anhui Agric Sci 38(32):18136–18139
Xiao L, Jiang JX, Yi ZL, Ai X, Tan JP, Liu SL, Chen ZY, Lin C (2013) A study on phenotypic diversity of Miscanthus sinensis natural population in Guangxi province. Acta Pratacult Sin 22(4):43–50
Xie CP, Fang Y, Fang YM (2011) Phenotypic variation of Quercus phillyraeoides in natural populations. J Sichuan Agric Univ 29(2):191–198
Xie XM, Yun JF (2000) Genetic diversity and detective methods of plant. Grassl China 6:51–59
Xu HC (1992) Geographical variation and provenance selection of Pinus tabuliformis. China Forestry Publishing House, Beijing, p 4
Xu Y, Woeste K, Cai N (2016) Variation in needle and cone traits in natural populations of Pinus yunnanensis. J For Res 27(1):41–49
Yan LB, Gu WC, Li B (2007) Study on phenotypic diversity of population in Cersis chinensis. Chin Agric Sci Bull 23(3):138–145
Yang WZ, Jin H, Li WY (2013) A study on phenotypic diversity in different populations ofendangered Coptis teeta wall of Yunnan. J Yunnan Univ (Natural Sciences Edition) 35(5):719–726
Yang Y, Liu Q, Yin X (2015) Phenotypic diversity and environment relations in Symplocos paniculata of Hunan. J Plant Genet Resour 16(1):80–86
Yanmei W (2010) Variation and cluster analysis on leaf characters from different provenance sources of Polygonum multiflorum Thunb. J Anhui Agric Sci 11(6):94–98
Zhang L, Luo TX (2004) Advances in ecological studies on leaf lifespan and associated leaf traits. Chin J Plant Ecol 28(6):844–852
Zhang P (1990) Wood anatomy of the Tetracentraceae. Acta Bot Boreali-Occidentalia Sin 10(3):185–189, 241.
Zhang P (1999) Study of geographical distribution and biological properties ofecology on Tetracentron sinensis. Yantai Teachers Univ J (Natural Science Edition) 2:70
Zhao LJ, Zhu LQ, Huang SX (2014) Genetic diversity of leaf anatomical traits in different provenances of Liriodendron chinense seedlings. Guihaia 34(3):308–314
Zheng X, Meng C, Ji ZF (2013) Phenotypic diversity of leaves morphologic characteristics of Ulmuslamellosa natural populations in Shanxi. Acta Pratacult Sin 40(10):1951–1960
 Journal of Forestry Research2021年2期
- Journal of Forestry Research的其它文章
- Stem taper functions for Betula platyphylla in the Daxing’an Mountains, northeast China
- Ecological variations of woody species along an altitudinal gradient in the Qinling Mountains of Central China: area-based versus mass-based expression of leaf traits
- Variations in stem radii of Larix principis-rupprechtii to environmental factors at two slope locations in the Liupan Mountains, northwest China
- A review of ecological mechanisms for management practices of protective forests
- Variation of basic density, calorific value and volumetric shrinkage within tree height and tree age of Ugandan grown Eucalyptus grandis wood
- Natural variations in flavonoids and triterpenoids of Cyclocarya paliurus leaves
