Application of the Latching Control System on the Power Performance of a Wave Energy Converter Characterized by Gearbox, Flywheel,and Electrical Generator
Gustavo O. Guarniz Avalos · Milad Shadman · Segen F. Estefen
Abstract The latching control represents an attractive alternative to increase the power absorption of wave energy converters (WECs) by tuning the phase of oscillator velocity to the wave excitation phase. However, increasing the amplitude of motion of the floating body is not the only challenge to obtain a good performance of the WEC. It also depends on the efficiency of the power take-offsystem (PTO). This study aims to address the actual power performance and operation of a heaving point absorber with a direct mechanical drive PTO system controlled by latching. The PTO characteristics, such as the gear ratio, the flywheel inertia, and the electric generator, are analyzed in the WEC performance. Three cylindrical point absorbers are also considered in the present study. A wave-to-wire model is developed to simulate the coupled hydro-electro-mechanical system in regular waves. The wave energy converter (WEC) performance is analyzed using the potential linear theory but considering the viscous damping effect according to the Morison equation to avoid the overestimated responses of the linear theory near resonance when the latching control system is applied. The latching control system increases the mean power. However, the increase is not significant if the parameters that characterize the WEC provide a considerable mean power. The performance of the proposed mechanical power take-off depends on the gear ratio and flywheel. However, the gear ratio shows a more significant influence than the flywheel inertia. The operating range of the generator and the diameter/draft ratio of the buoy also influence the PTO performance.
Keywords Wave energy converter · Point absorber · Mechanical power take-off · Flywheel · Gear ratio · Latching control
1 Introduction
The technology of harnessing wave energy is in the pre-commercial stage. More efficient power performance must be achieved introducing a lower cost of energy competitive to the more mature renewable sources, such as wind and solar.More than thousand wave energy converter (WEC) patents have been registered since 1980 (Amir et al. 2016) and more than hundred wave power pilot projects have been installed over the past few years (ITTC 2014). Outstanding review papers on wave energy converter are available in Khan et al.(2017) and Ahamed et al. (2020). One of the well-studied WEC types is the point absorber, a floating device with small dimensions compared to the wavelength. It can absorb energy from one or more degrees of freedom. The small dimensions of the device allow it to absorb energy from all the wave directions, which varies during the device’s life (Kolios et al. 2018). It can be located in various ocean depths ranging from shallow to very deep water depending on the device design and the mooring system (Xie and Zuo 2013). Geometrical optimization of the point absorber plays an important role to obtain an economic and efficient system(Babarit and Clément 2006a; Shadman et al. 2018).
Different control strategies have been proposed since the mid-1970s to improve the power performance of WECs(Salter 1974; Falnes and Budal 1978; Nebel 1992; Korde 1991; Babarit et al. 2009; Wu et al. 2018). One of these control methods is the latching control system, originally proposed by Budal and Falnes (1977). Latching control holds the oscillating body during some time intervals (latching duration) and releases it at certain instant (unlatching). As a result, the device’s velocity and the wave excitation force will be in phase, and consequently the motion amplitude and power performance increase. Considering a WEC with a linear power take-off (PTO) in regular waves, it is possible to calculate the optimum latching duration by plotting the energy capture or amplitude of the floating body versus latching duration (Nolan et al. 2005; Giorgi and Ringwood 2016). Irregular waves are still a research topic of interest for wave energy converters. The peaks’ advanced information is necessary for the system’s efficiency. Some alternatives are discussed in Hals et al. (2002), Babarit and Clément(2006b), Sheng et al. (2015), and Thomas et al. (2018).
A PTO system is the WEC’s component responsible for converting kinetic energy from the oscillator into electricity. It has a direct influence on the efficiency of the WEC.The PTO system can assume different forms: air turbines,hydraulic converters, hydro turbines, direct-electrical drive,and direct-mechanical drive systems (Amélie 2017). Air turbines represent one of the first modern technologies to drive the research on wave energy converters. It is used in oscillating water column types (Heath et al. 2000; Clément et al. 2002). It consists of turbine driven by oscillating air pressure induced by the ocean waves in an enclosed chamber. It represents a simple technology, but offers a low efficiency due to the oscillating air pressure from the sea states. Hydraulic converters, which consist of an oscillating body connected to a hydraulic cylinder, move concerning an actuator, forcing fluid through controlled hydraulic circuit to a hydraulic motor the electric generator. Some pilot projects are shown in Weber et al. (2009), and Dalton et al. (2010).Two important aspects in its design are the maintenance cost of this system, which is always high, and the protection of the hydraulic system against extreme conditions. A variation of hydraulic converter is a wave energy hyperbaric converter discussed in Costa et al. (2010). Overtopping devices use the hydro turbine PTO system to generate electricity using the seawater’s potential energy accumulated in a basin (Christensen et al. 2005; Liu et al. 2017). This system offers a high efficiency and low maintenance. In a direct electrical drive system, alternating polarity magnets are mounted on the oscillator, transforming the oscillator into the moving part of a linear electrical generator. The oscillating motion generates electrical current for the stator (Prado and Polinder 2013; Feng et al. 2016). Direct-mechanical drive PTO is a system in which a typical design is to use a rack and a pinion gear to convert the vertical motion of the oscillating body to an oscillating rotational motion (Sanada et al. 2012, Bihn et al. 2016, Liang et al., 2017, Shadman et al. 2021). Two one-way bearings are integrated into the system to convert bidirectional rotation into unidirectional rotation taking advantage of the electrical generator (Bihn et al. 2016, Liang et al., 2017). This PTO type is attractive because of its high efficiency. It only needs three energy conversions; the wave energy is converted to mechanical energy and then electrical energy. Air turbines, hydraulic converters, and hydro turbines need one more conversion that corresponds to the device’s fluid power (Amélie 2017). On the other hand, the direct-electrical drive can avoid the non-negligible losses in this mechanical system; however, it subjects to much more demanding conditions (Falcão 2010).
This research aims to address the actual power performance and operation of a wave energy converter with a direct-drive mechanical PTO system controlled by latching.The relation between different components of the WEC is analyzed. The WEC is a heaving point absorber with a bottom-mounted support structure. The PTO consists of a pulley, a backstop system, a gearbox, a flywheel, and a rotary electrical generator. Unlike the direct-mechanical drive systems mentioned above, this system does not convert the oscillating body’s vertical motion with a rake and pinion gear. This system uses a pulley to achieve this goal.Specifically, this research addresses the influence of the gear ratio, the flywheel inertia, and the operating characteristics of the electric generator in the WEC power performance. A wave-to-wire model is developed to simulate the coupled hydro-electro-mechanical system according to Shadman (2017). The latching control system is implemented to increase the energy extraction. It is well known that the linear theory overestimates the responses near resonance (Cruz and Salter 2006; Payne 2006; Backer 2009;Jin et al. 2018), leading to an unrealistic estimation of the WEC power generation. The latching control system needs to work in this region to obtain good performance. Giorgi and Ringwood (2016) and Guo and Patton (2017) show that linear potential theory cannot adequately represent a heaving point absorber response controlled by latching. In this study, the viscous damping effect contribution is considered through the Morison-like quadratic damping term(Morison et al. 1950).
2 WEC Description
The oscillating body of WEC is a heaving point absorber with cylinder geometry (Figure 1). As shown in Table 1,the present study considers three cylindrical buoys to analyze the PTO’s performance. The buoys are denominated according to the ratio of diameter (D) to draft (T). b20 is the buoy with the smallest mass. The buoy oscillates relative to a reference bottom-mounted support structure, consisting of four columns mounted on the seabed through a concrete base. The buoy moves in the vertical direction (heave) using rollers placed on the cylindrical buoy’s top and bottom.
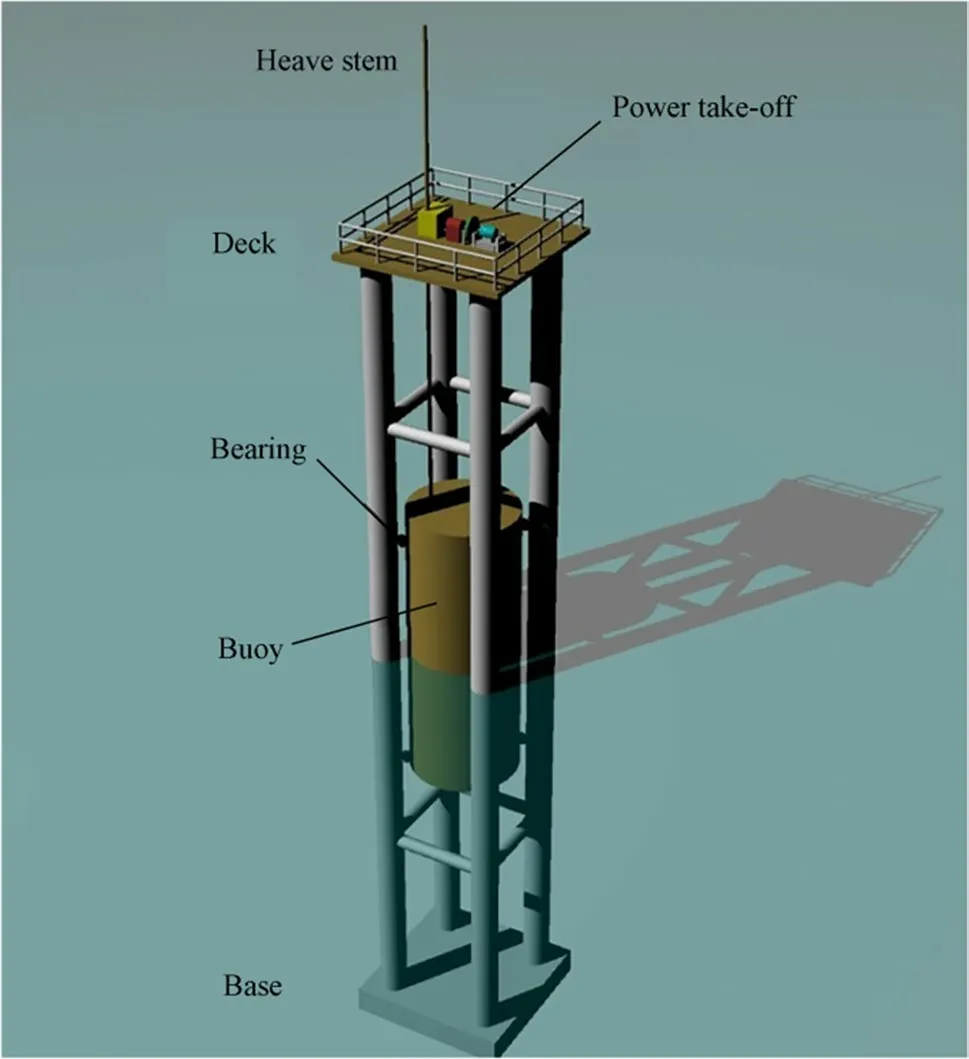
Figure 1 Wave energy converter
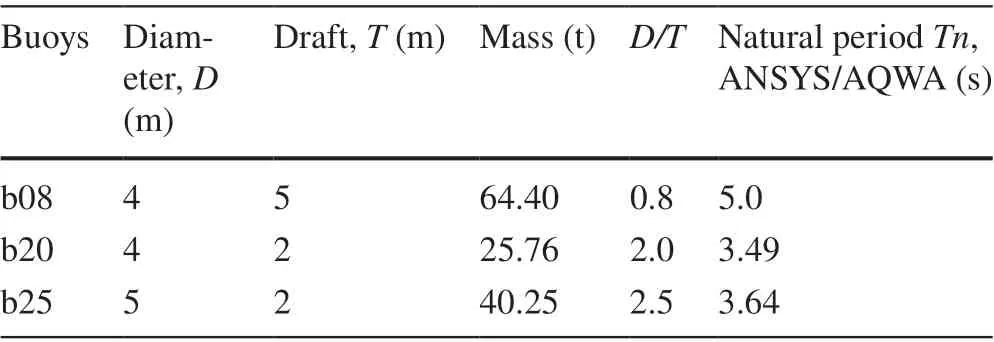
Table 1 Characteristics of the buoys
The proposed PTO is a direct-drive mechanical system composed of a mechanical conversion system, a gearbox,a flywheel, and a rotary electric generator located on the topside deck (Figure 2). The buoy’s vertical movement is transmitted via a heave stem to the mechanical conversion system composed of a pulley, gears, and a backstop system.The pulley converts the vertical movement of the buoy into oscillating rotational motion. The velocity of the pulley is defined by

wherėzis the vertical velocity of the buoy andris radius of the pulley. The backstop system guarantees the unidirectional rotation delivered to the electric generator. A gearbox is used to increase the delivered speed to the generator. A flywheel is also used to store kinetic energy and smooth the generator’s energy delivery. Coupling condition of the PTO system and the cylindrical buoy is the same as described in Sanada et al. (2012), Bihn et al. (2016), and Liang et al. (2017). The buoy and PTO are coupled only when the rotational speed generated by the buoy is higher than rotational speed of the electrical generator; otherwise,they are uncoupled.
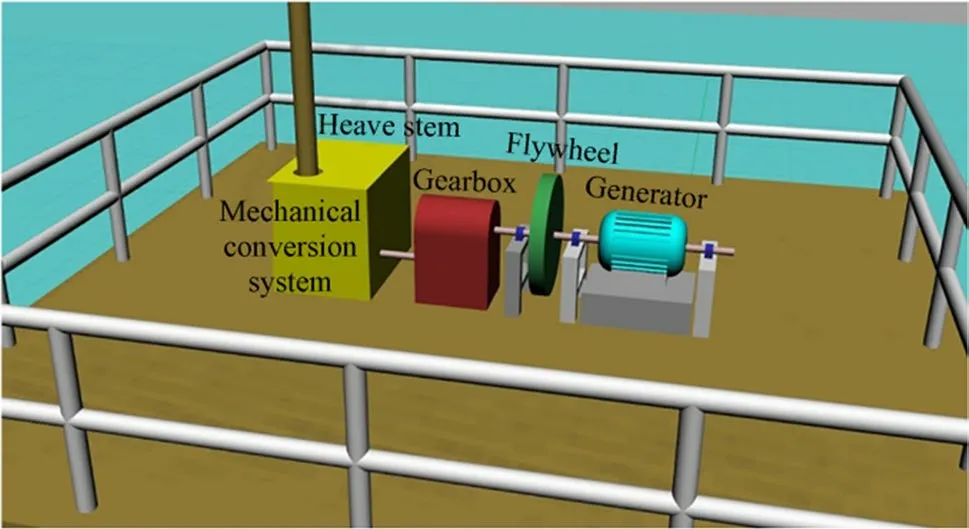
Figure 2 Direct-drive mechanical PTO system
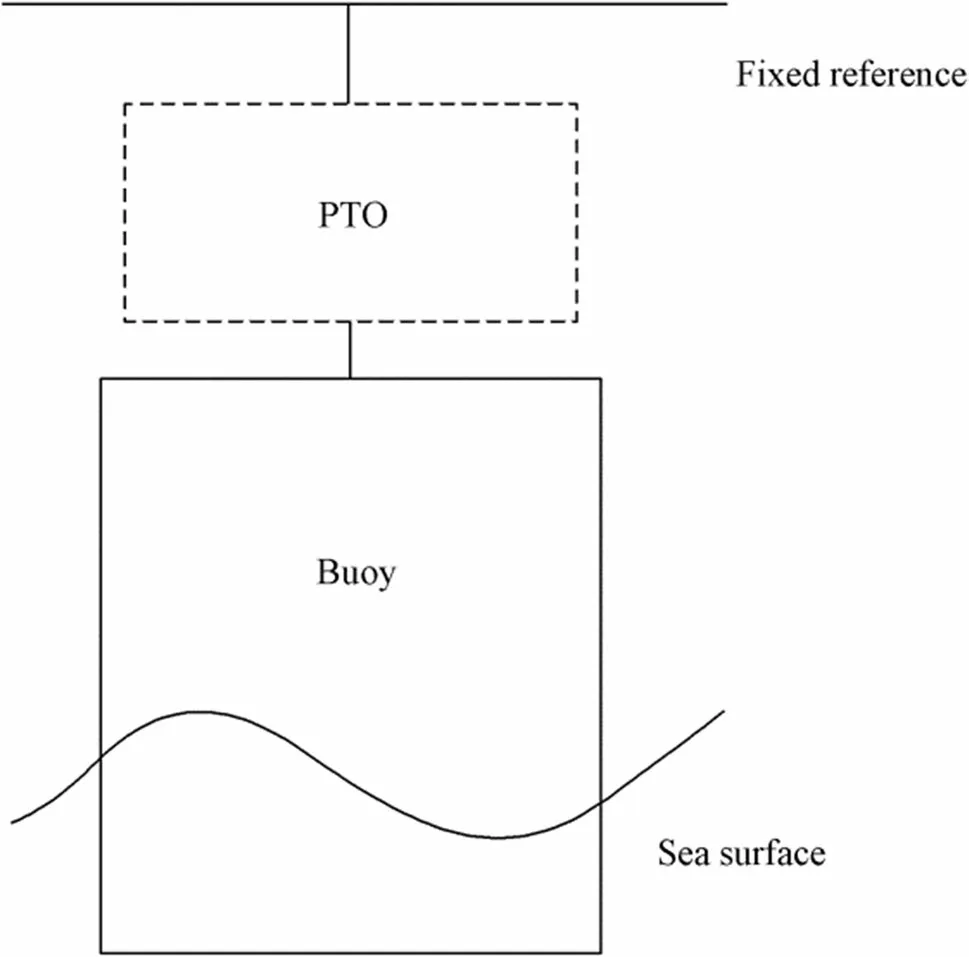
Figure 3 Schematic model of a heaving point absorber WEC
3 Wave‑to‑wire model
3.1 Hydrodynamic model
The present study considers generic cylindrical point absorbers with degree of freedom only in heave motion,see Figure 3. The potential theory represents the common approach to calculating the hydrodynamic forces on a floating body. It assumes that waves are the sum of incident, diffracted, and radiated wave components.

To avoid the linear theory’s overestimated responses near resonance using the latching control system, the viscous damping effect is implemented. The nonlinear model applied to each point absorber is described by wherezis the heave motion of the body,Fbis the restoring force,Fris the wave radiation force,Feis the wave excitation force,Fvis the viscous damping force,Ffis the rolling friction force of the rollers,Fpis the power take-off force,andFcis the latching control force. The possible effect of the four columns (see Figure 1) on the hydrodynamics of the buoy is not considered in the present work.
The present work considers only regular waves; the wave elevation is described as:
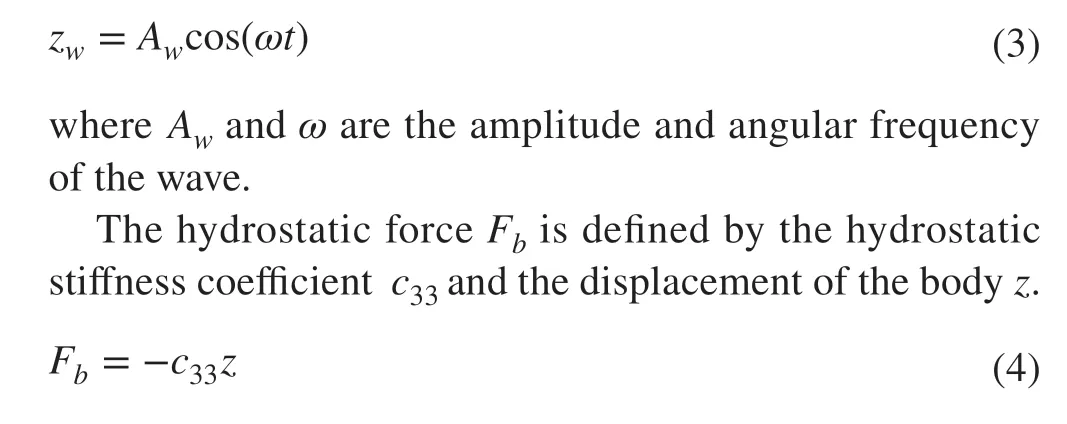
The radiation forceFris defined according to Cummins (1962) which includes the fluid memory effect. The convolution integral formulation is used to consider the fluid memory retardation force on the floating body, see Eq. (5). A direct method is used to solve the radiation convolution integral.
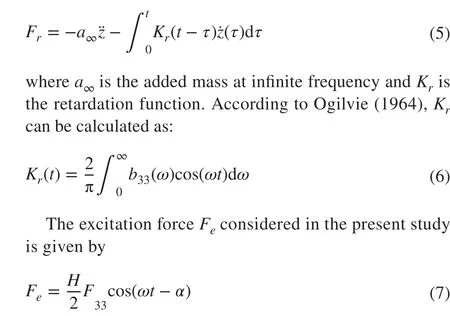
whereF33is the wave force amplitude that corresponds to wave frequencyf(ω=2πf).His the wave height andαis the wave force phase shift. The hydrodynamic parameters of each point absorber in the frequency domain are calculated by ANSYS/AQWA and shown in Figure 4.
Morison et al. (1950) equation is used to address the viscous effectsFv, which is widely used to describe the total inline force on a cylindrical body under oscillatory flow. This force is composed of two terms, an inertial force and a drag force. The drag force considered in the equation of Morison is implemented in the time domain approach described in Eq. (2). Considering the relative movement between the flow and the body, the drag force is defined according to Sumer and Fredsøe (2006), see Eq. (8).

whereρis the density of the water,Cdis the drag coeffi-cient,̇zis the velocity of the body,uis the undisturbed fluid velocity, andAis the reference area (cross-sectional area).As presented in Jin et al. (2018), the drag coefficients of the buoys can be calculated by the decay test. Accordingly, theCdvalues are equal to 1.2, 1.58, and 1.85 for b08, b20, and b25, respectively. The detailed calculation of the drag coeffi-cient is described in the Appendix. A reliable and single estimation of drag coefficient for high and low velocities of the floating body remains a challenge, as described in Kalofotias(2016), Giorgi and Ringwood (2017a), Giorgi and Ringwood(2017b), and Avalos and Estefen (2021). Therefore, the drag coefficient calculated according to Jin et al. (2018) is a reference value to analyze the different parameters that influence the proposed PTO’s performance. To analyze the viscous effects on the mean power of WEC, the viscous force is calculated with a value ofCdwhich is slightly larger and lower than the initially calculated drag coefficient. The results are shown at the end of Sect. 4.6.
According to Kragelsky et al. (1982) and Blau (2009),the rolling friction force for a wheel, also known as rolling resistance, is defined by

whereNis the normal force that is equal to the wheel’s load,Ris the wheel’ s radius, andfis known as the dimensional rolling resistance coefficient; it depends mainly on the wheel’s material as the surface in contact. The ratiof∕Rrespresents the dimensionless rolling resistance coefficient,which is equivalent to the coefficient of frictionμkin sliding friction. In general,f∕Rhas a value much lower thanμk. In the present study, the WEC oscillating body moves in the vertical direction using eight rollers placed on the top and bottom of the cylindrical buoy, the radius of the rollers is 0.15 m, and the rolling resistance coefficientfof the rollers(polyurethane) is 0.001448 m (Lippert and Spektor 2013).The normal forceNdefined in Eq. (9) is defined by the wavesurge forceFsurgeapplied on the floating body, then the total rolling friction force is defined by
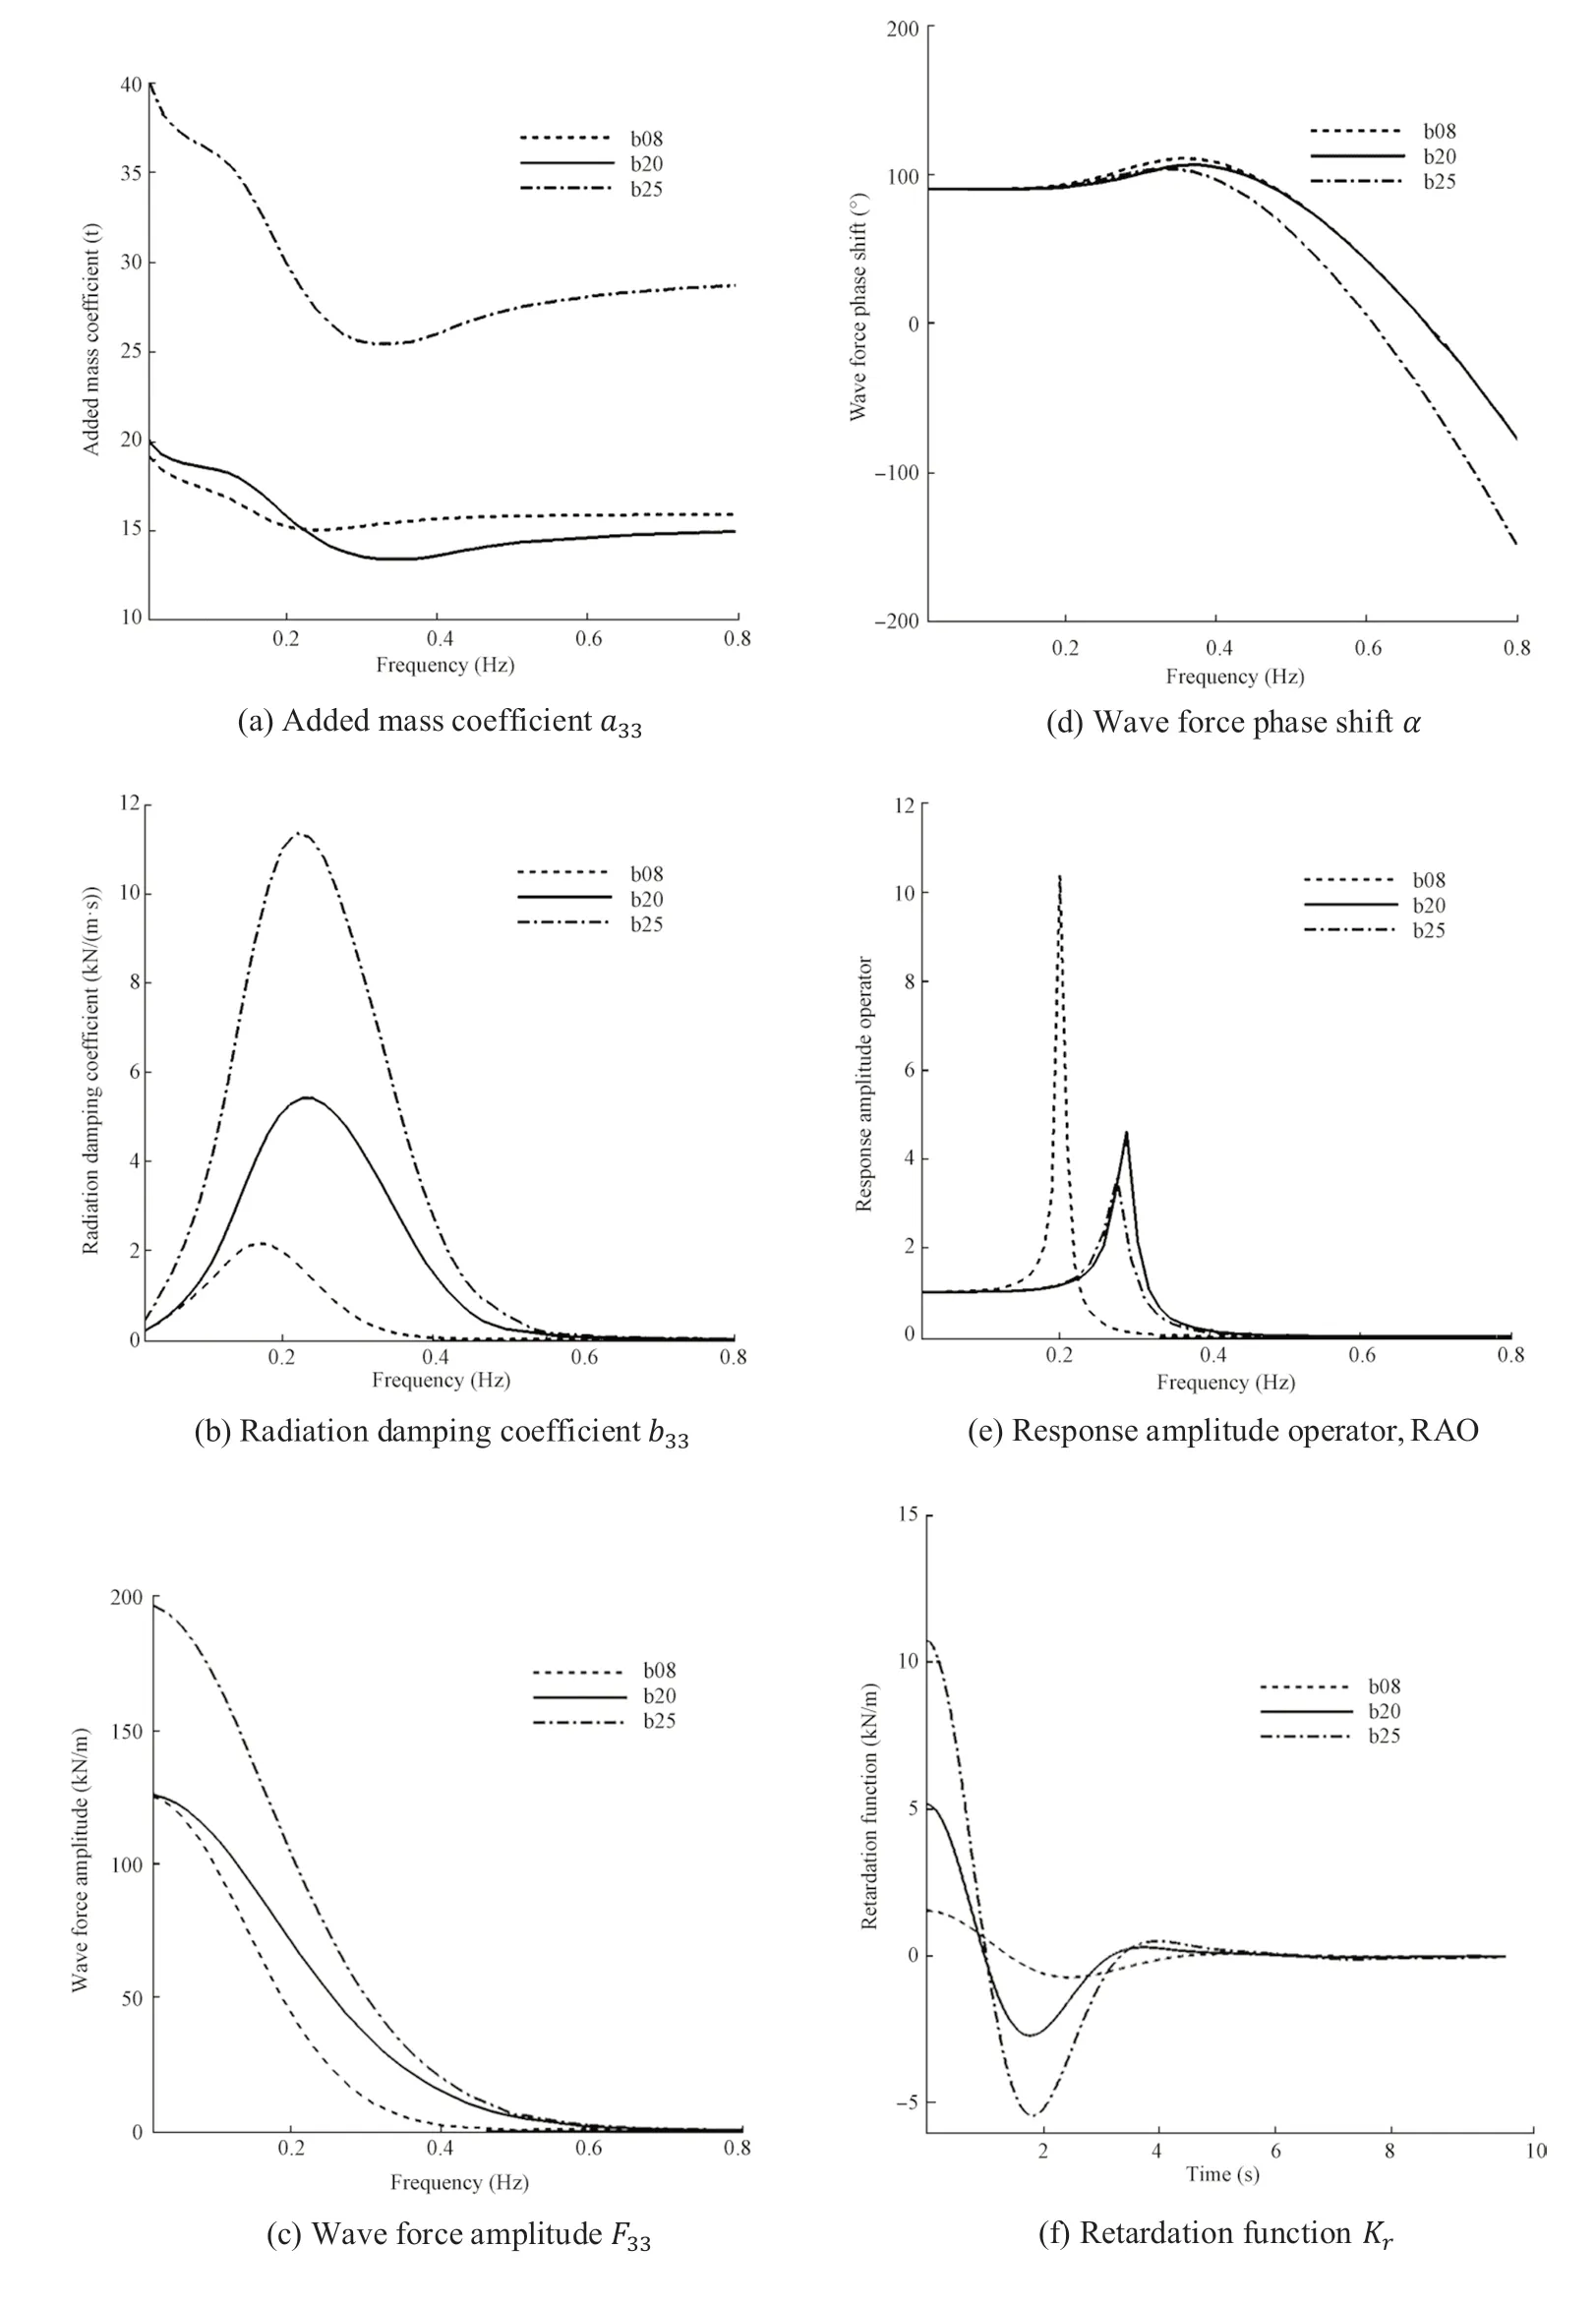
Figure 4 Hydrodynamic parameters of motion in heave obtained by ANSYS/AQWA

3.2 Power take‑off model
The power take-off forceFpof the direct-drive mechanical PTO system depends on the equivalent mass, the torque,and the system’s mode of operation, see Eq. (11).

wherëzis the acceleration of floating body, andJ1is the inertia of the mechanical conversion system and the gearbox(at input side).J2is the inertia of the generator (Jg), the output shaft (Js), and the flywheel (Jf).ris the pulley radius,cis the gear ratio,Tgis the generator torque,Tbis the torque of each bearing of the generator shaft,̇φis the angular velocity of the pulley,̇θis the generator shaft speed, andηis the effi-ciency of the gearbox. The expression between parenthesis that is multiplied bÿzrepresents the total equivalent mass of PTO.
There are two modes of operation of the PTO system according to Eq. (11). When the instantaneous rotational speedc φ(caused by the buoy motion) and the generator shaft speeḋθsatisfy Eq. (12), the generator and the buoy are coupled.
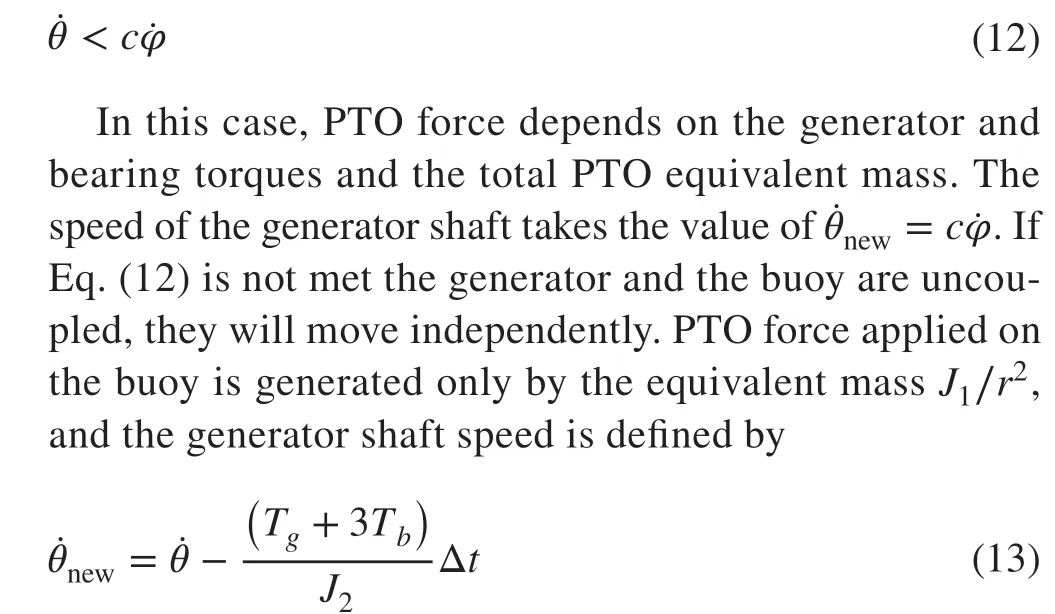
where Δtis the time step of the numerical simulation. The flywheel represents the most of the inertia ofJ2. It stores kinetic energy produced by the movement of the buoy.Therefore, power generation can occur due to buoy or flywheel. Equation (11) and Eq. (13) consider that the generator is running. However, the generator produces electricity only when its speeḋθis within its operating range, see Figure 6. Outside the operating rangėθ, the torqueTgis not taken into account. In Figure 5, the flowchart shows the power generation of WEC; it details the PTO force according to its mode of operation Eq. (11) and the operating range of generator.
The equivalent mass defined byJ1∕r2represents less than 1% of the buoy mass in the present work. However, the equivalent mass given byc2J2∕r2could represent more than 100% of buoy mass due to the variation of gear ratio and the flywheel’s inertia. Therefore, the last equivalent mass can influence in the mean power of WEC.
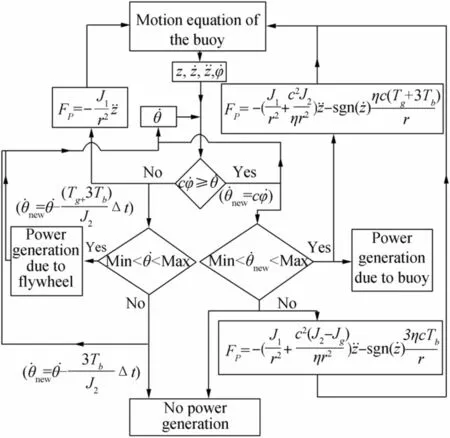
Figure 5 WEC power generation flowchart
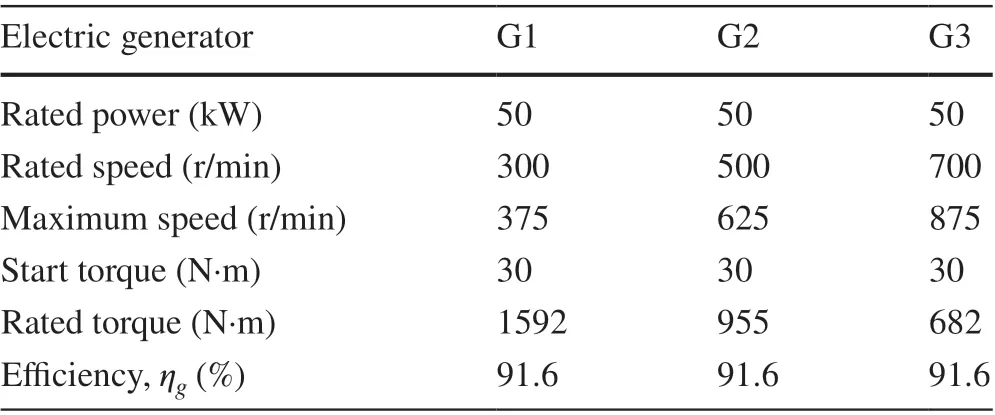
Table 2 Characteristics of electric generators
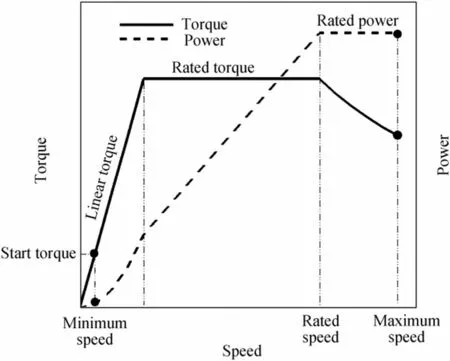
Figure 6 Torque and power characteristics of electric generators
Three electric generators are considered in the present study. The characteristics of each generator are shown in Table 2 and Figure 6. It is observed that the three generators have the same rated power, but different rated speeds.
For the three electric generators, the linear torque shown in Figure 6 is defined by Eq. (14). The generator torqueTgin the region of rated powerPratedis calculated by Eq. (15)and the electric power output by Eq. (16).
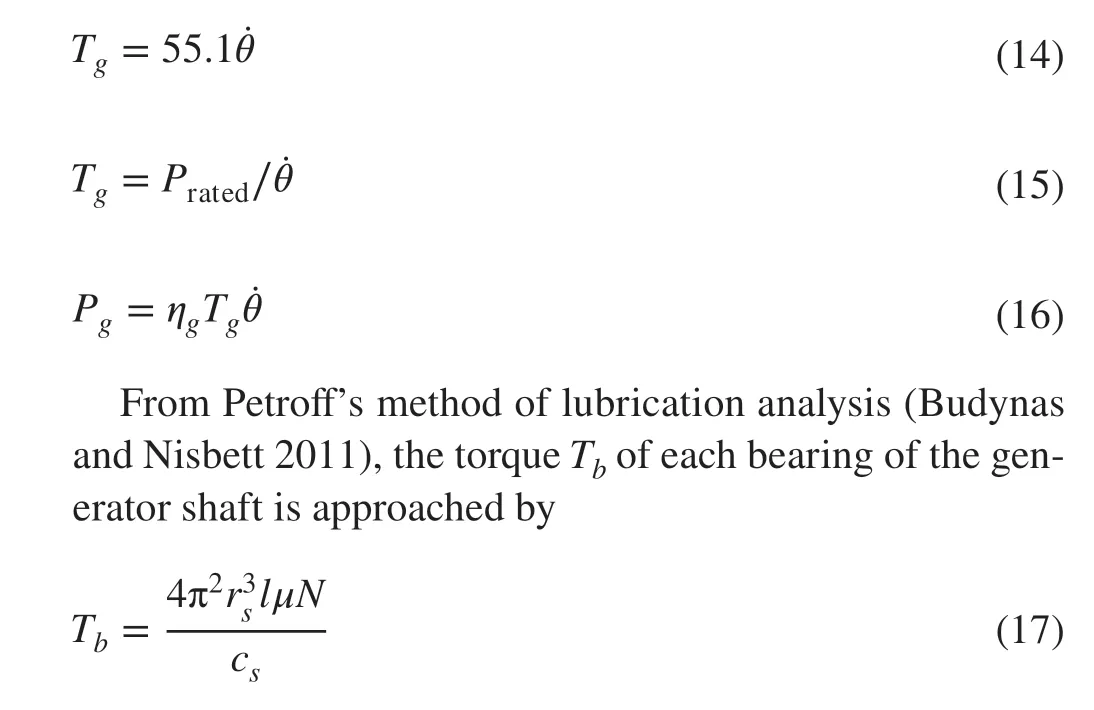
wherersis the radius of shaft,lis the length of the bearing,μis the dynamic viscosity of the lubricator,Nis the rotational speed of the shaft, andcsis the radial clearance. The total torque of the bearings could be neglected in relation to generator torque. However, when the electric generator is outside its operating range, the generator torque is equal to 0, and the torque of the bearings is the only load that reduces the rotational speed of the generator shaft.
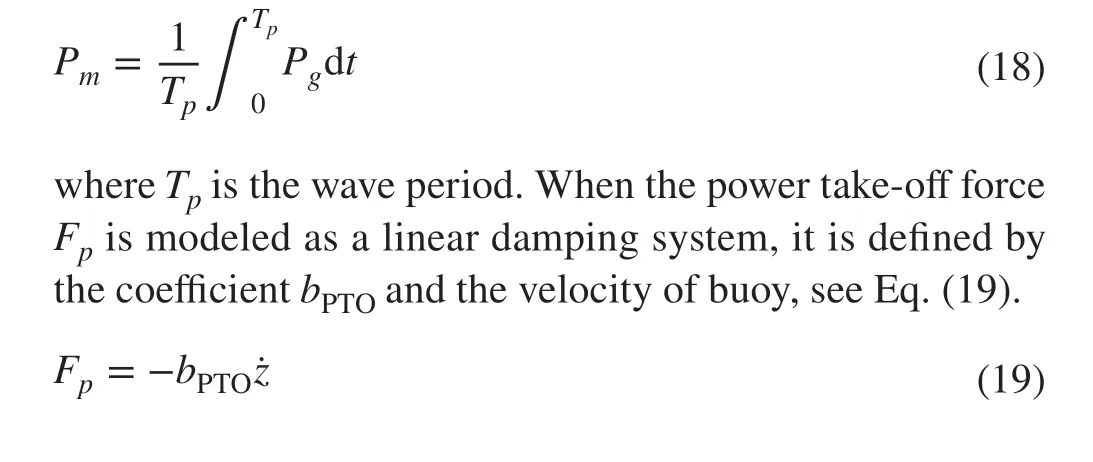
The mean powerPmabsorbed by WEC is expressed by
3.3 Latching Control System Model
In the present study, the latching control system works as follows. During the buoy oscillation, the control system is applied only when the buoy velocity becomes 0 or very small (the buoy reaches its maximum displacement). The buoy is latched for a predefined time interval(latching duration) and then released. The latching control forceFcis calculated from the impulse-momentum theorem, see Eq. (20). This equation is applied during the latching duration.Fctakes the value of 0 during the buoy oscillation.

Δtis the time step of the numerical solution that is equal to 0.05 s,vois the buoy velocity at the end of the time step always equals to 0, andvfis the buoy velocity at the beginning of the time step.
In the present study, each case studied is defined by buoy(D/Tratio), wave condition (period and height), and PTO characteristics (gear ratio, flywheel inertia, electric generator). For each case, different latching durations are tested to find the value that maximizes the mean power of WEC. This value represents the optimum latching duration.
4 Analysis of the Power Performance and Operation of the WEC
This section shows the actual power performance and operation of the WEC. Several plots show the relation between different components of the WEC. In Figures 7, 8, 14, 15,and 16, the mean power calculated with or without latching control system for each case studied (defined by buoy,wave condition and PTO characteristics) corresponds to the maximum mean power. The characteristics of the regular wave considered in the present work are based on the main characteristics of the sea considered in Shadman (2017). The wave energy converter’s power performance analysis considers regular waves with a wave height equal to 1 m. A wave period of 8 s is always considered in all cases studied. The wave periods of 6 and 10 s are considered in the analysis of the wave period’s influence on the PTO performance.As mentioned in Sect. 3.2, the value of the equivalent mass given byc2J2∕r2can influence the mean power. Therefore,the variation of the gear ratio and flywheel inertia is considered in the analysis of the PTO performance.
4.1 PTO Generator Rated Speed Analysis
Considering the latching control system, Figure 7 shows the mean power for each generator and buoy. According to Table 2, the three generators have the same rated power equal to 50 kW. The results show that the mean power shows a strong dependence on the gear ratio and flywheel inertia.However, it is observed that the mean power depends more on the gear ratio. Regardless of the buoy, increasing the rated speed from the generator G1 to G2 significantly increases the mean power in a specific region, whose value is close to the rated power. This behavior is repeated from G2 to G3,the region with high mean power increases. In this case,a flywheel with low inertia generates a considerable mean power. Notwithstanding, the gear ratio in this region also increases. The G2 generator shows a region with considerable high mean power without an excessive gear ratio, so this generator is considered in the following calculations.
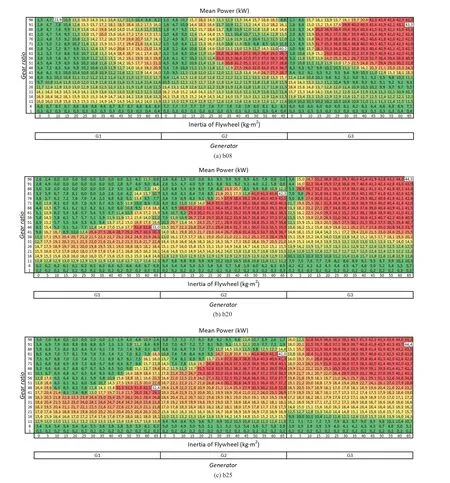
Figure 7 Mean power for each generator for b08, b20, and b25 with latching control in a wave period of 8 s with a height of 1 m
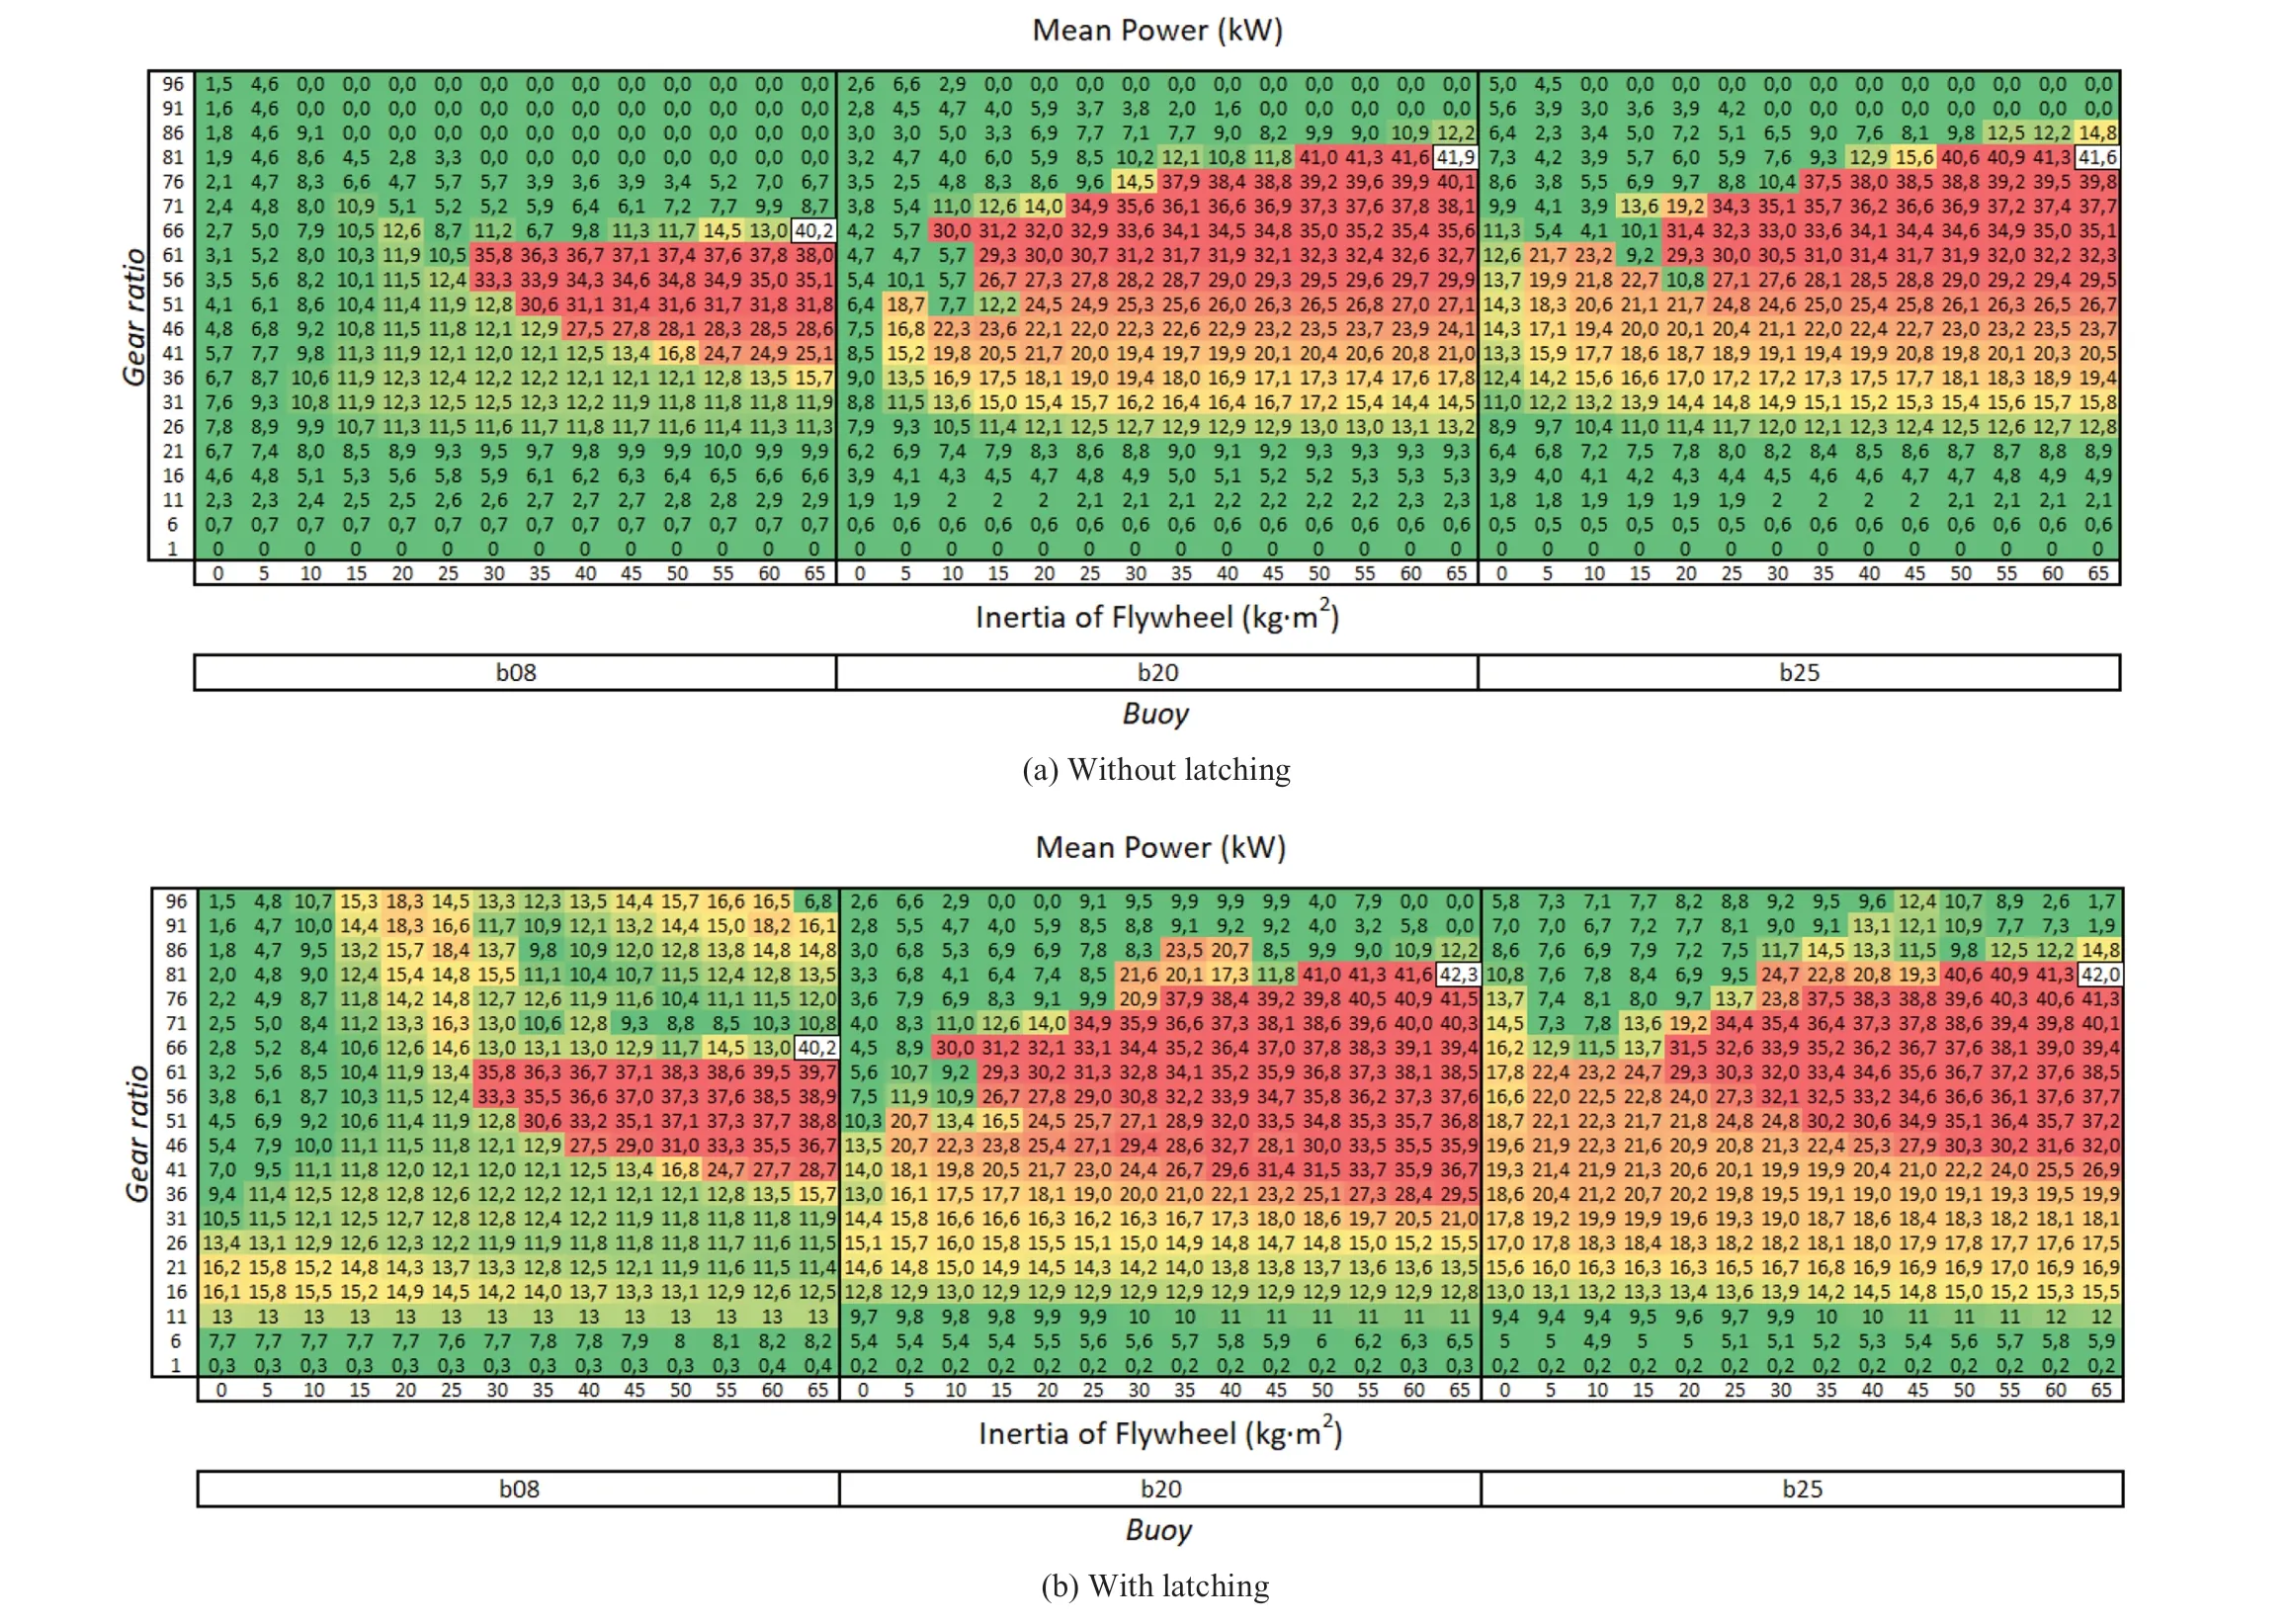
Figure 8 Mean power for each buoy, generator G2, Tp = 8 s
4.2 Analysis of the Latching Control System Based on the G2 Generator
The contribution of the latching control system in the WEC is shown in Figure 8. In the absence of latching control, the proposed PTO shows for each buoy a considerable mean power in a specific region defined by gear ratio and flywheel inertia, see Figure 8a . On the other hand, the latching control system contributes to improving the regions’ performance with low mean power and modifies slightly or not at all the region with high mean power obtained only by PTO.The higher the mean power without latching control, the lower the contribution of the latching control system. Considering latching control, the b20 and b25 buoys have almost the same performance and are superior to b08. However,b20 is the smallest buoy (64% of the mass of b25), which is an important factor from the point of view of installation,structure, and cost.
4.3 Analysis of the Latching Duration, Latching Control Force, Oscillation Amplitude,and Maximum Velocity of WEC
The most relevant WEC responses for each buoy under latching control system using generator G2 are shown in Figure 9. Figure 9a clearly shows that the optimum latching duration depends on the value of the gear ratio and flywheel inertia. In low and high gear ratios, the optimum latching duration assumes high values. In some cases, the latching control system should be disabled as it does not contribute to mean power. Unlike a linear PTO, see Eq. (19),the latching duration with a good performance (not optimal) is equal to half of the difference between the acting wave period and the buoy’s natural period (Sheng et al.2014). For this wave condition, the value of this latching duration would be 1.5 s, 2.55 s, and 2.18 s for buoys b08,b20, and b25, respectively. In Figure 9a, similar values are observed when the gear ratio takes the value of 1. In this case, the contribution (mean power increase) of the latching control system is clear according to Figure 8. Equation (11)shows that the gear ratio greatly influences the total equivalent mass of PTO and, therefore, increases the mass in the buoy. It means that the natural period of the floating body changes. For this reason, the optimum latching duration shows variation with the gear ratio.
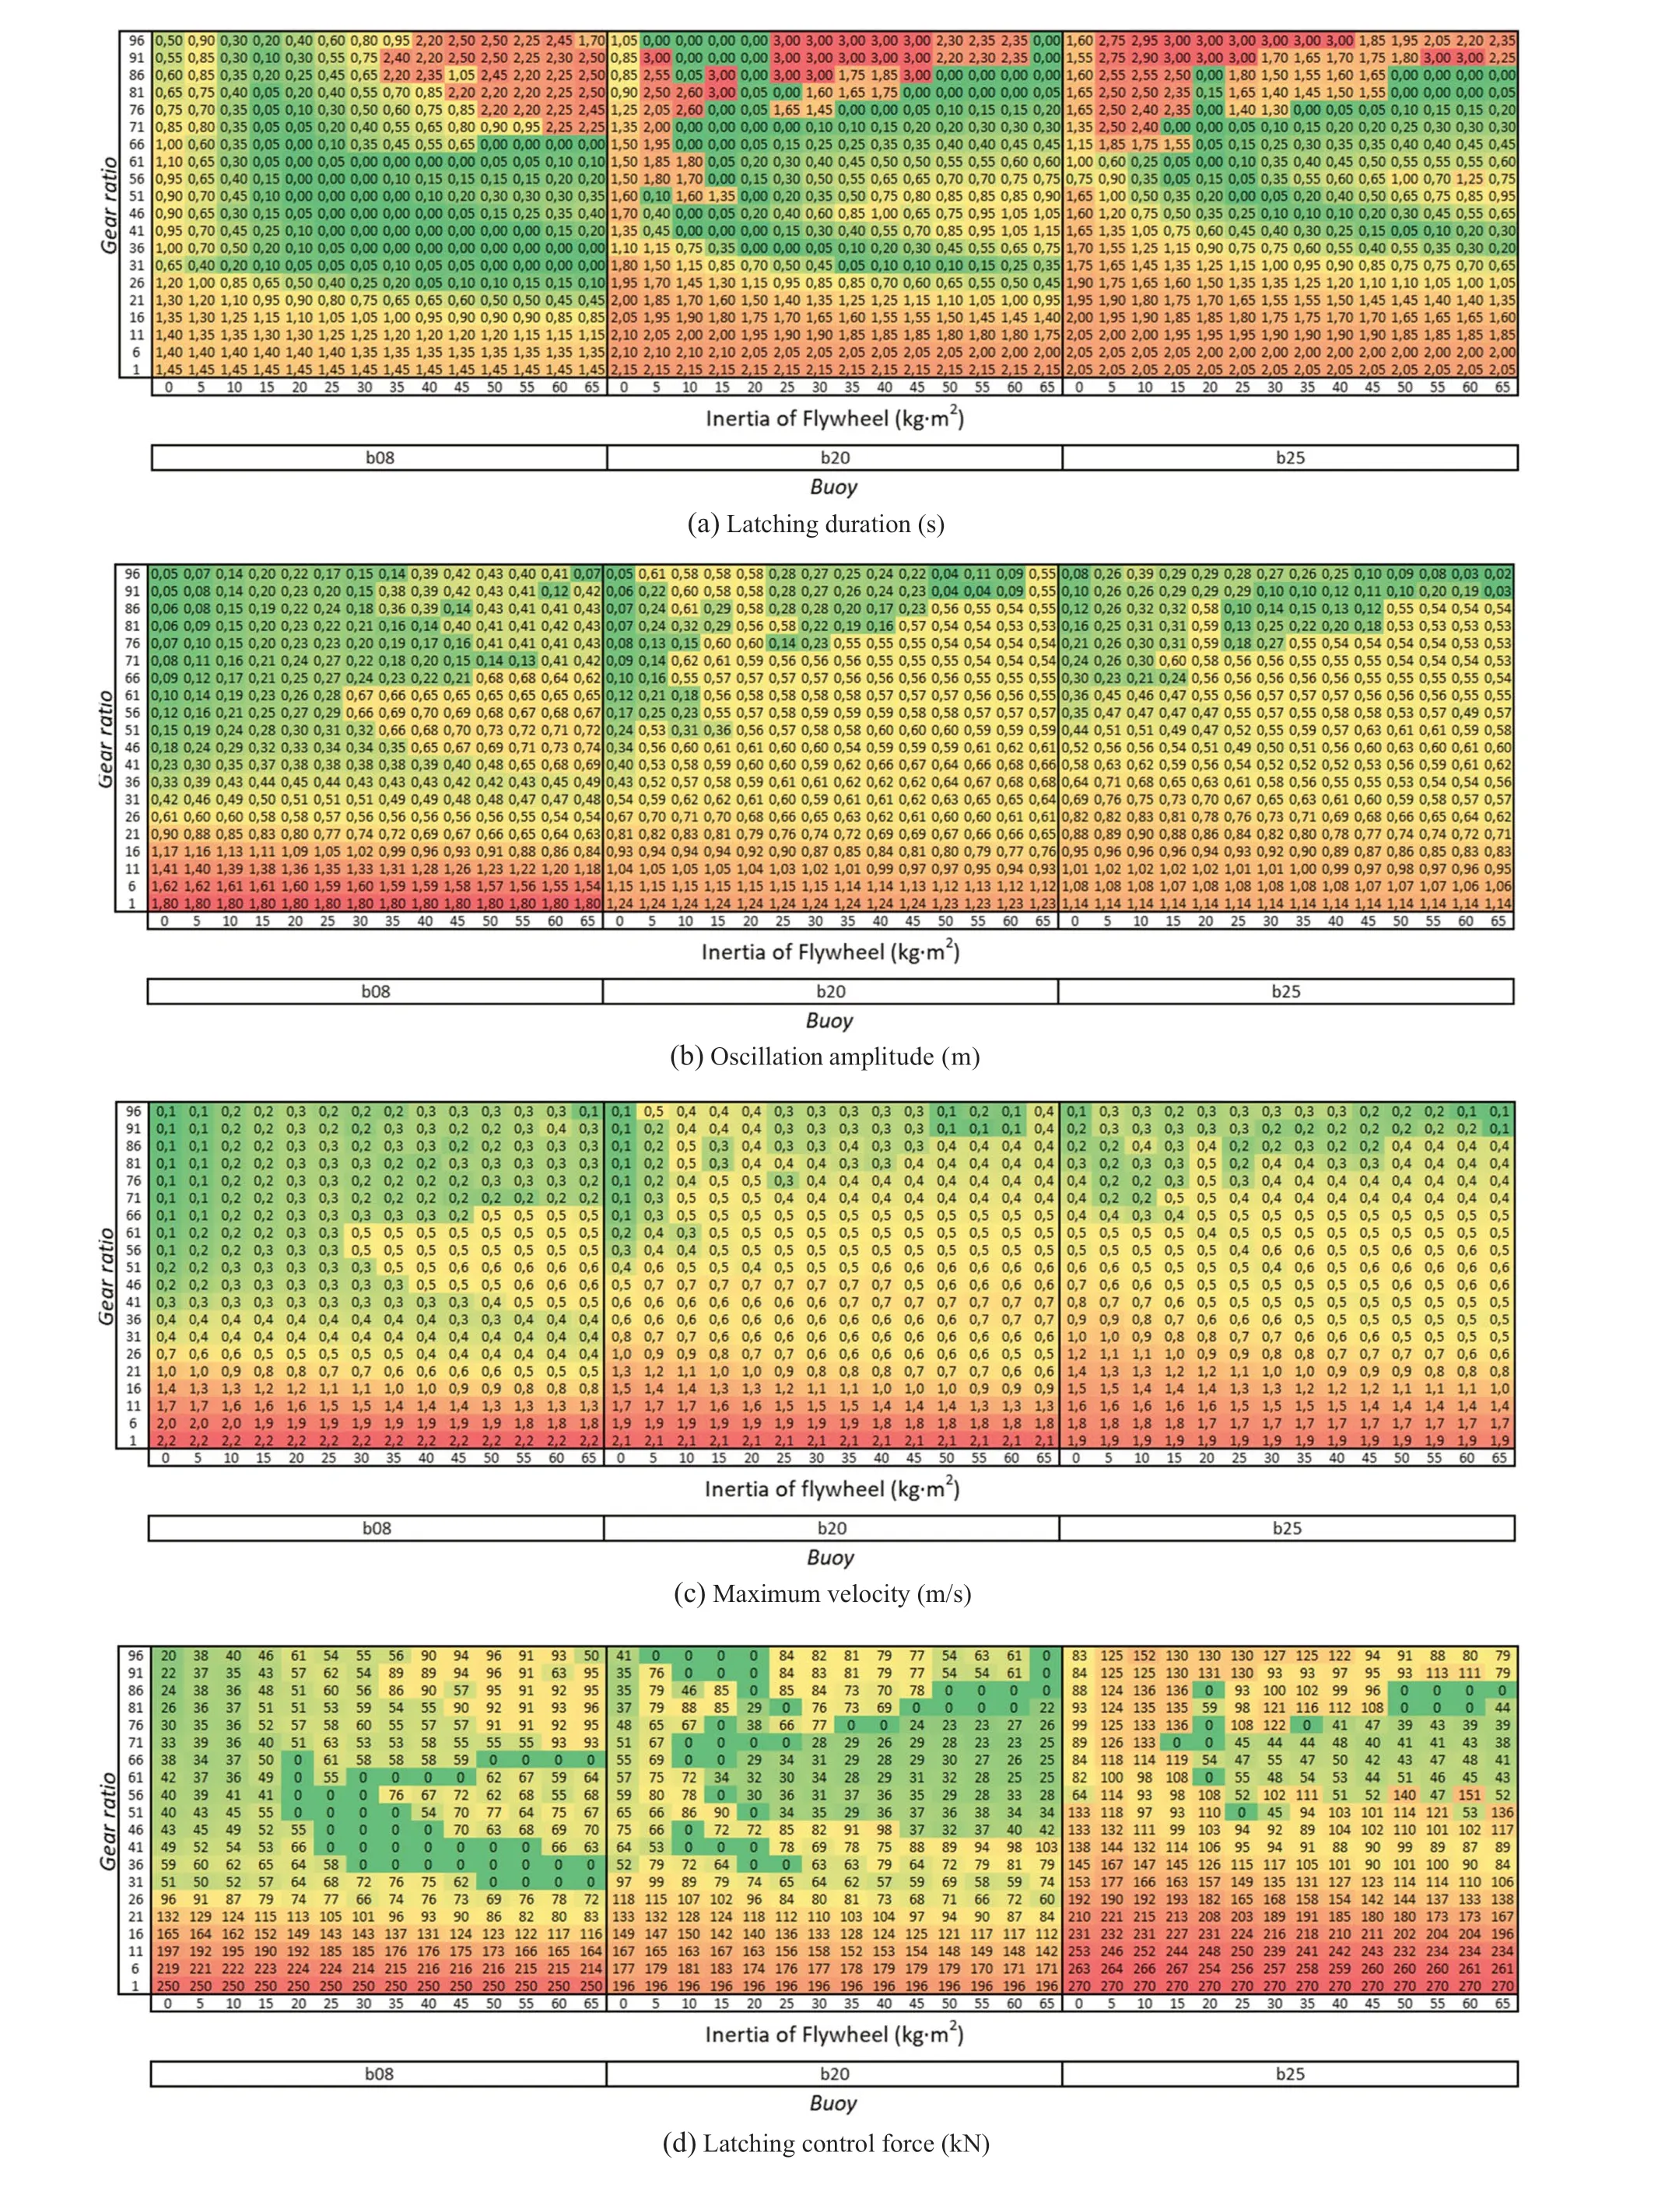
Figure 9 WEC responses for each buoy under latching control system, generator G2, Tp= 8 s
The maximum amplitude of oscillation generated by latching control is observed at low gear ratios, see Figure 9b.The buoy b08 shows the highest amplitude, 1.8 m. However, the maximum value of amplitude/draft ratio for b08,b20, and b25 is 0.36, 0.62, and 0.57, respectively. It means that for the wave period and height studied in regular wave,the size of the buoy b20 is sufficient, unlike b08, which shows to be oversized, without good wave energy harvest.It is observed that in each buoy’s high mean power region,the amplitude is similar and is not superior to 0.75 m. As with the oscillation amplitude, each buoy’s highest velocity occurs with a low gear ratio, see Figure 9c ; b08 shows the maximum velocity, 2.2 m/s.
Notwithstanding, the maximum velocity of each buoy does not show a large difference. As mentioned above, the gear ratio increases the equivalent mass of PTO and also the torque. For this reason, the maximum amplitude and velocity of each buoy decreases with the gear ratio.
The latching control force for each buoy is shown in Figure 9d. The maximum latching control force occurs at low gear ratios. The b20 buoy shows the minimum value of the latching control force, 196 kN, and b025 the maximum value, 270 kN, with a distribution with high values of latching control force, the latching average control force is 130 kN. For b08 and b20, the average of this force is 82 kN and 75 kN,respectively. For some cases, the latching control force takes the value of 0; it means the latching control system is disabled, see Figure 9a.
4.4 Analysis of the Time Series of WEC
Considering the generator G2, the buoy b20, and flywheel inertia and gear ratio equal to 65 kg·m2and 56, respectively,time series of WEC are shown in Figure 10. The buoy amplitude does not exceed of 0.6 m. According to Figure 8, the latching control system increases the mean power from 29.9 to 37.6 kW (26% increase) with a latching duration equal to 0.75 s. However, the latching control cannot adjust the buoy velocity phase to the excitation force, see Figure 10. The generator speed shows the coupling and uncoupling of the generator and the buoy, which occurs practically when the buoy velocity increases. The rest of time, the generator, and the buoy are uncoupled. In this case, the generator speed is in its operating range, see Table 2, so power generation always occurs. Therefore, in agreement with the WEC power generation flowchart Figure 5, the power generation occurs due to the buoy’s movement or the kinetic energy stored by flywheel. It is observed that during the latching control system application, the flywheel contributes to the power generation. The power time series shows that generator operates in the region of rated torque or rated power; the power varies between 22 and 46 kW. Due to the coupling and uncoupling of the generator and the buoy, it is observed that PTO generates an intermittent force defined by Eq. (11), in general,opposite the buoy movement. The maximum magnitude of the PTO force occurs when the buoy velocity is maximum.As mentioned above, the PTO force depends on PTO equivalent mass and generator torque; the contribution of each is shown in Figure 10. The PTO force due to generator torque is always opposite to the buoy movement. On the other hand,the PTO force due to equivalent mass favors the buoy movement, except when the buoy amplitude decreases close to 0. Therefore, in general, the equivalent mass decreases the effect of the generator torque on the buoy.
In Figure 11, the same time series of WEC are shown,but considering a gear ratio equal to 1. In this case, latching control system increases the mean power from 0.01 to 0.26 kW (2500% increase) and adjust the phase of the buoy velocity to the excitation force. The generator speed shows that the coupling and uncoupling of the generator and the buoy occurs when the buoy decreases its velocity from its maximum value. This behavior lasts less time than the previous case (Figure 10). During the coupling and uncoupling of the generator and the buoy, power generation is observed;however, during a short time of uncoupling, the generator is out of its operating range; therefore, no power is generated(G2 off). According to the characteristics of G2, the generator operates in the region of linear torque, see Figure 6 and Eq. (15). It means the PTO almost behaves like a linear PTO,if not for the equivalent mass of PTO. Unlike the previous case, where the PTO force is almost opposite to the buoy movement, in this case, the PTO force is opposed to the buoy movement when the buoy velocity increases. When the buoy velocity decreases, the PTO force is in favor to the buoy movement. This behavior occurs due to the effect to the PTO equivalent mass; the contribution of the PTO force due to the generator torque is minimal. It is important to observe that the PTO force due to the equivalent mass depends on the buoy acceleration, Eq. (11).
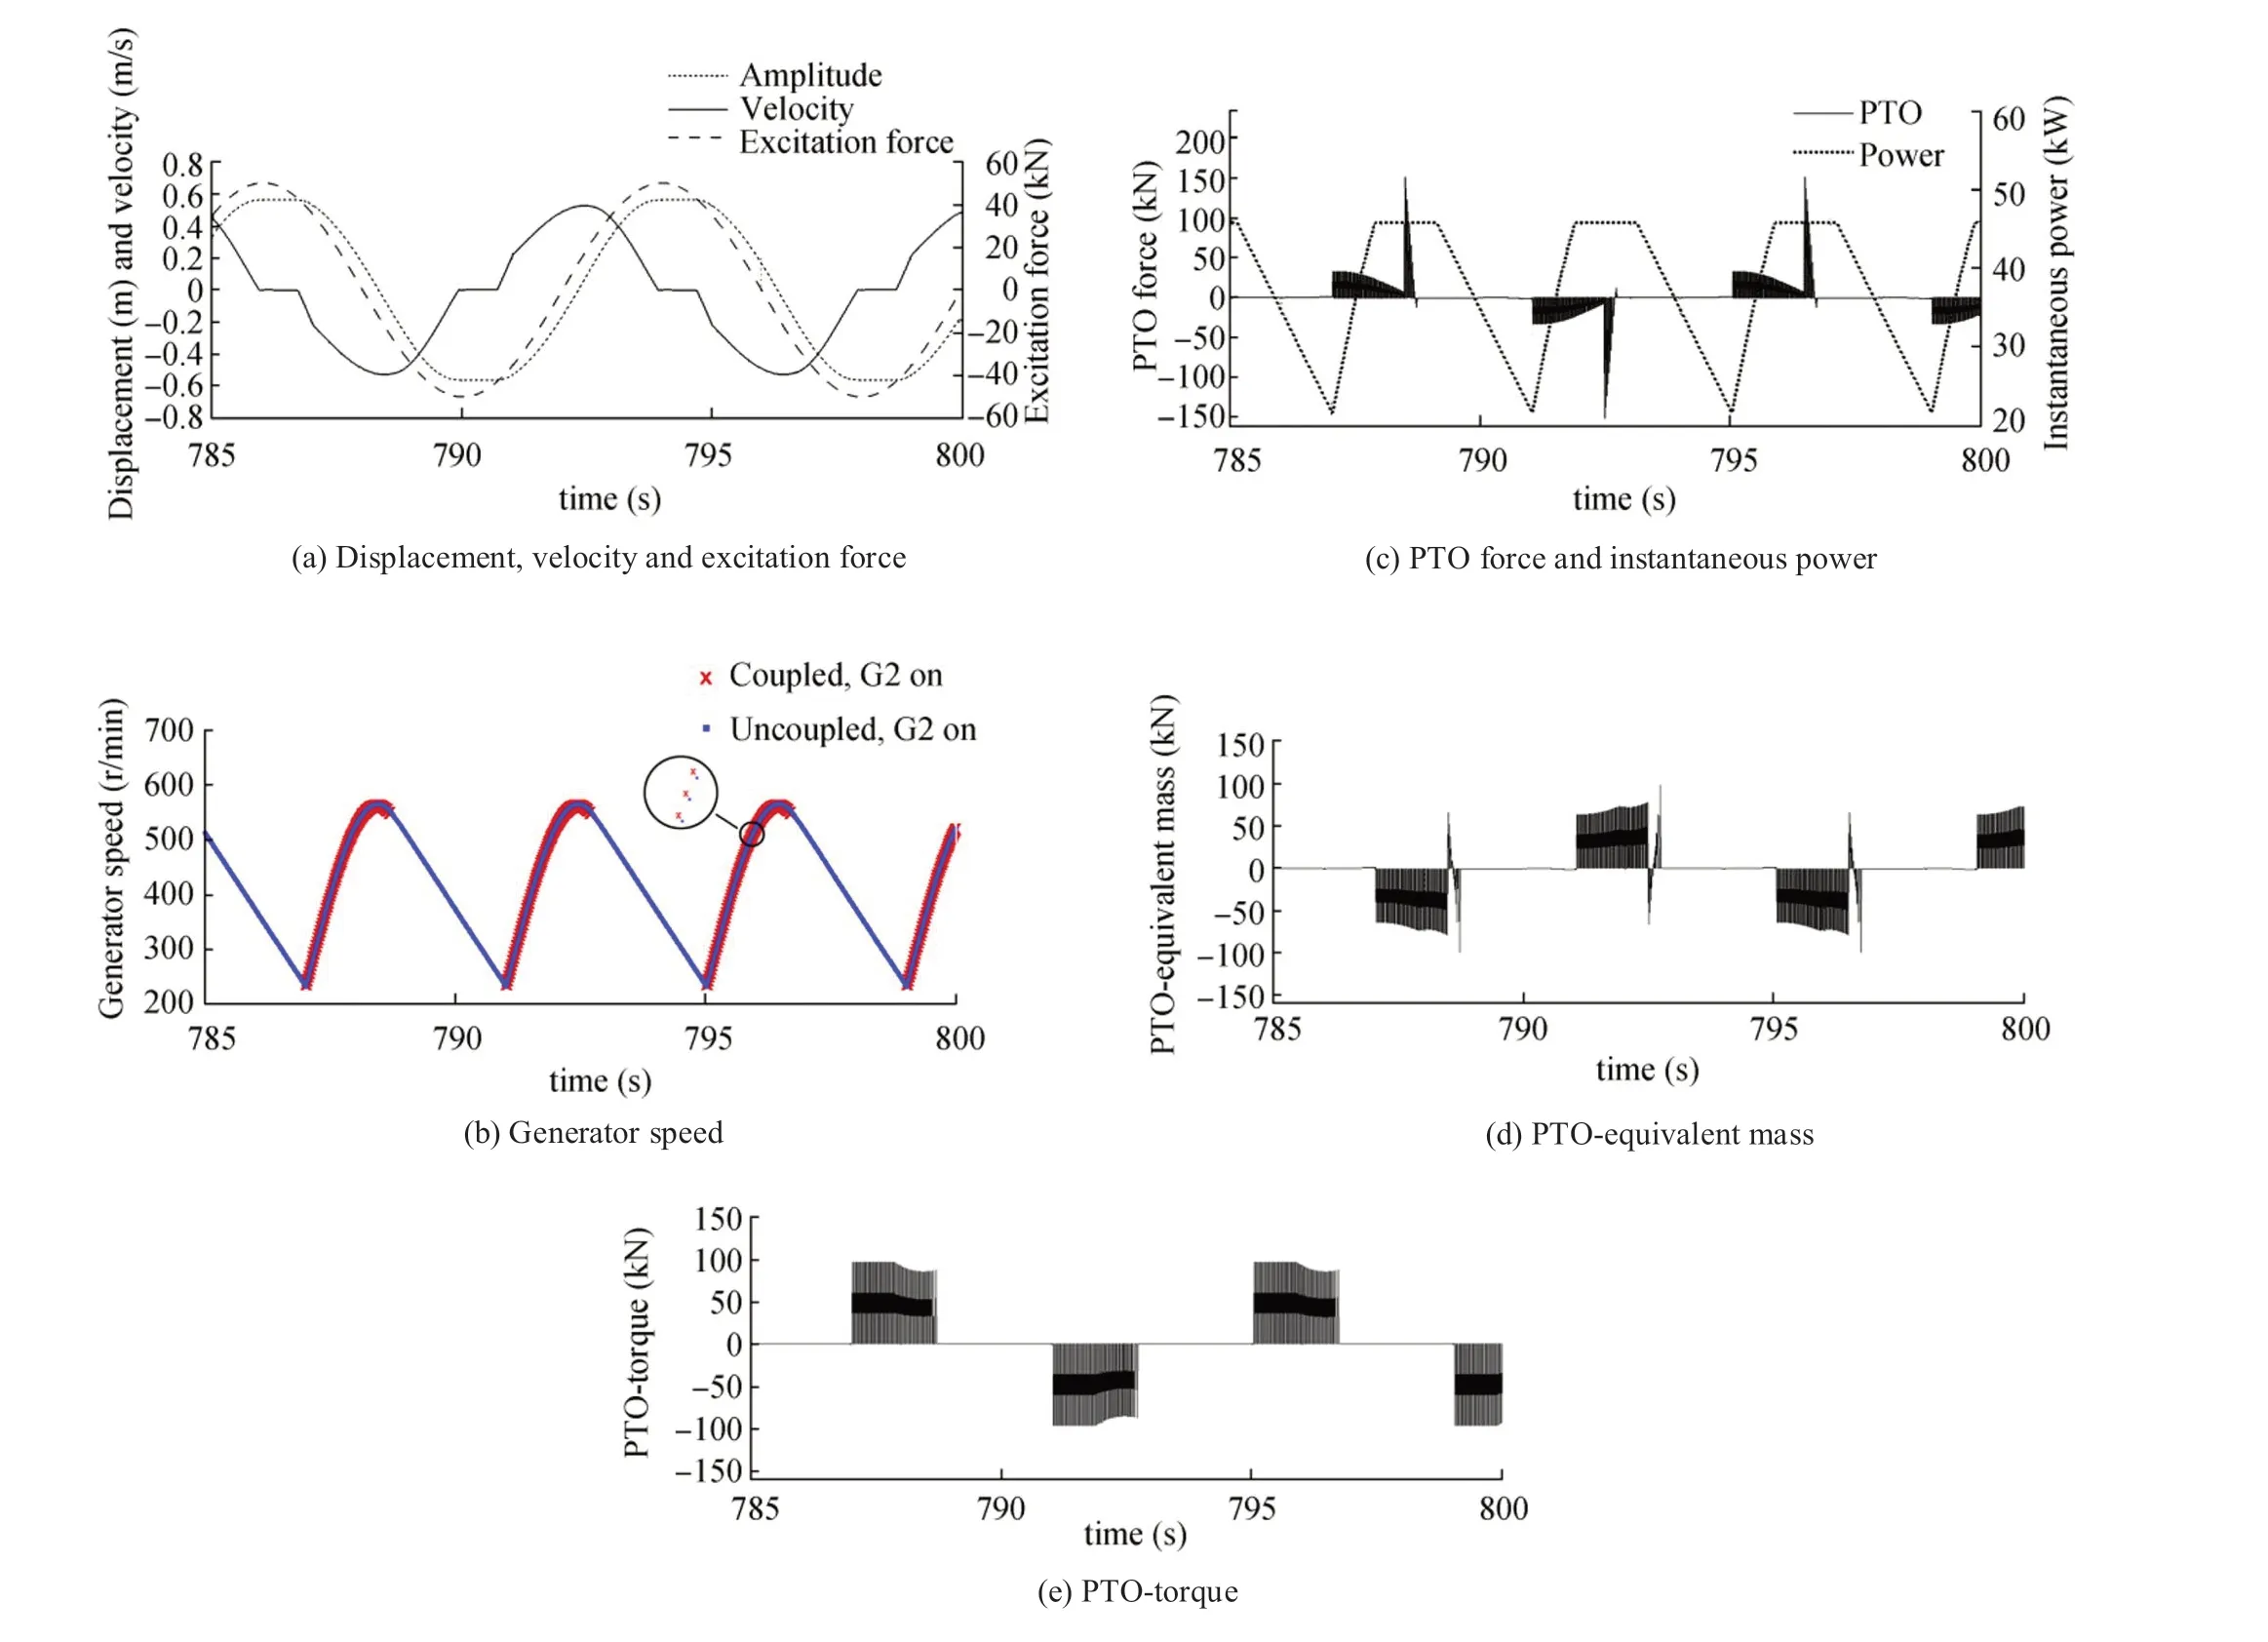
Figure 10 Excitation force, displacement and velocity of b20, speed and power of G2, PTO force and PTO force due to equivalent mass and torque (Jf = 65 kg·m2 and c=56), Tp = 8 s
As mentioned in Sect. 3.3, the optimum latching duration is always calculated to obtain the maximum mean power of WEC. Figure 12 shows the variation of mean power with latching duration for the cases studied in Figure 10 and Figure 11. The optimum latching durations are 2.15 s forc=1 and 0.75 s forc=56. Forc=1, a larger region is observed with smooth mean power variation. Both cases show instability after the optimum latching duration. Forc=56, the change in mean power is drastic just after the optimum value. Forc=1, the latching control system always generates increase of mean power. However, forc=56 in the instability region, the latching control system reduces the mean power obtained without latching, even eliminates power generation. To understand this latter behavior of PTO, in Figure 13, the generator speed and power of the case studied in Figure 10 are reproduced again, but considering a latching duration of 1 s. According to Figure 12, the latching control system reduces the mean power to 7.6 kW. The maximum speed of generator G2 is 625 r/min, see Table 2. Figure 13 shows that the generator is uncoupled and without generating power for a long time. In this case, the generator does not produce torque. According to WEC power generation flowchart in Figure 5, the generator speed decreases due to the bearing torque, which is a very small value compared to the generator torque. The generator’s speed decreases slowly due to the high flywheel inertia, see Eq. (13). It means that the operating range of generator plays an important role in the PTO performance.
4.5 Analysis of the Wave Period on the Mean Power of WEC
Considering the generator G2 and the buoy b20, the PTO performance due to the wave period is indicated in Figure 14. Similar to the results in Figure 8, without latching control system, the high mean power is located in a specific region defined by gear ratio and flywheel inertia. The increase in the wave period extends the region with high mean power. However, the gear ratio must increase to obtain high mean power. As discussed above, the latching control system further improves the performance of PTO in the regions with low mean power. Nevertheless, the increase of mean power has a high value in specific regions as can be observed for periods 6 and 10 s, see Figure 14 b.
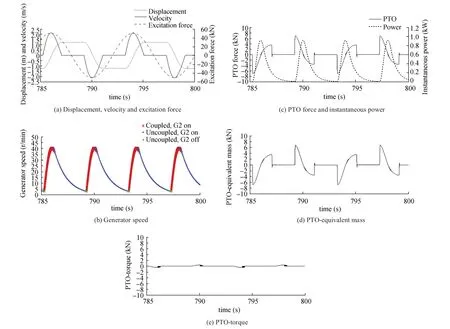
Figure 11 Excitation force, displacement, and velocity of b20, speed and power of G2, PTO force and PTO force due to equivalent mass and torque (Jf = 65 kg·m2 and c=1), Tp = 8 s
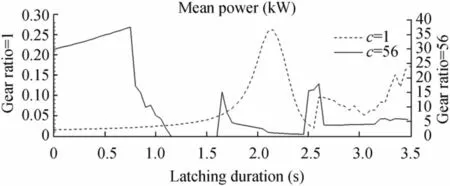
Figure 12 Mean power vs latching duration for gear ratio c=1 andc=56, buoy b20, generator G2, Tp = 8 s, Jf = 65 kg·m2
4.6 Analysis of the Viscous Force Effect on the Mean Power of WEC
As mentioned in Sect. 3.1, the analysis of the viscous force effect on mean power of WEC consists in analyzing the response with a drag coefficient 0.5 above and below the initially calculated drag coefficient for each buoy according to Jin et al. (2018). Considering the latching control system,Figure 15 shows the mean power variation relative to the initial mean power for each buoy. The latching duration can be the same or not. Even so, it always represents the optimum latching duration in each case. In general, the mean power distribution and value are not drastically modified when the drag coefficient decreases or increases in the analyzed range. It is observed that at low gear ratios, the viscous effect is greater. In this region, the mean power variation is greater when the drag coefficient decreases; b08 proves to be the most affected because b08 always shows the cases with maximum amplitude and velocity, see Figure 9b and c. The greatest variation of the mean power of b08 at low gear ratios is 5.3 kW, see Figure 13a. At high gear ratios, the viscous effect is less than that at low gear ratios. However,in each buoy, there are exceptional cases in which the viscous effect produces high mean power variation values. In general, when the drag coefficient decreases and increases,the mean power increases and decreases, respectively. The high mean power variation recorded occurs because sometimes the generator speed is outside the generator’s operating range, which can dramatically change power generation performance, as observed in Figure 13. Notwithstanding, in the studied range of gear ratio and flywheel inertia, the average of the mean power variations (in absolute value) for b08,b20, and b25 is 1.6, 1.3, and 1.4 kW, respectively.

Figure 13 Speed and power of G2, buoy b20, c=56, Jf = 65 kg·m2,Tp = 8 s, and latching duration 1 s
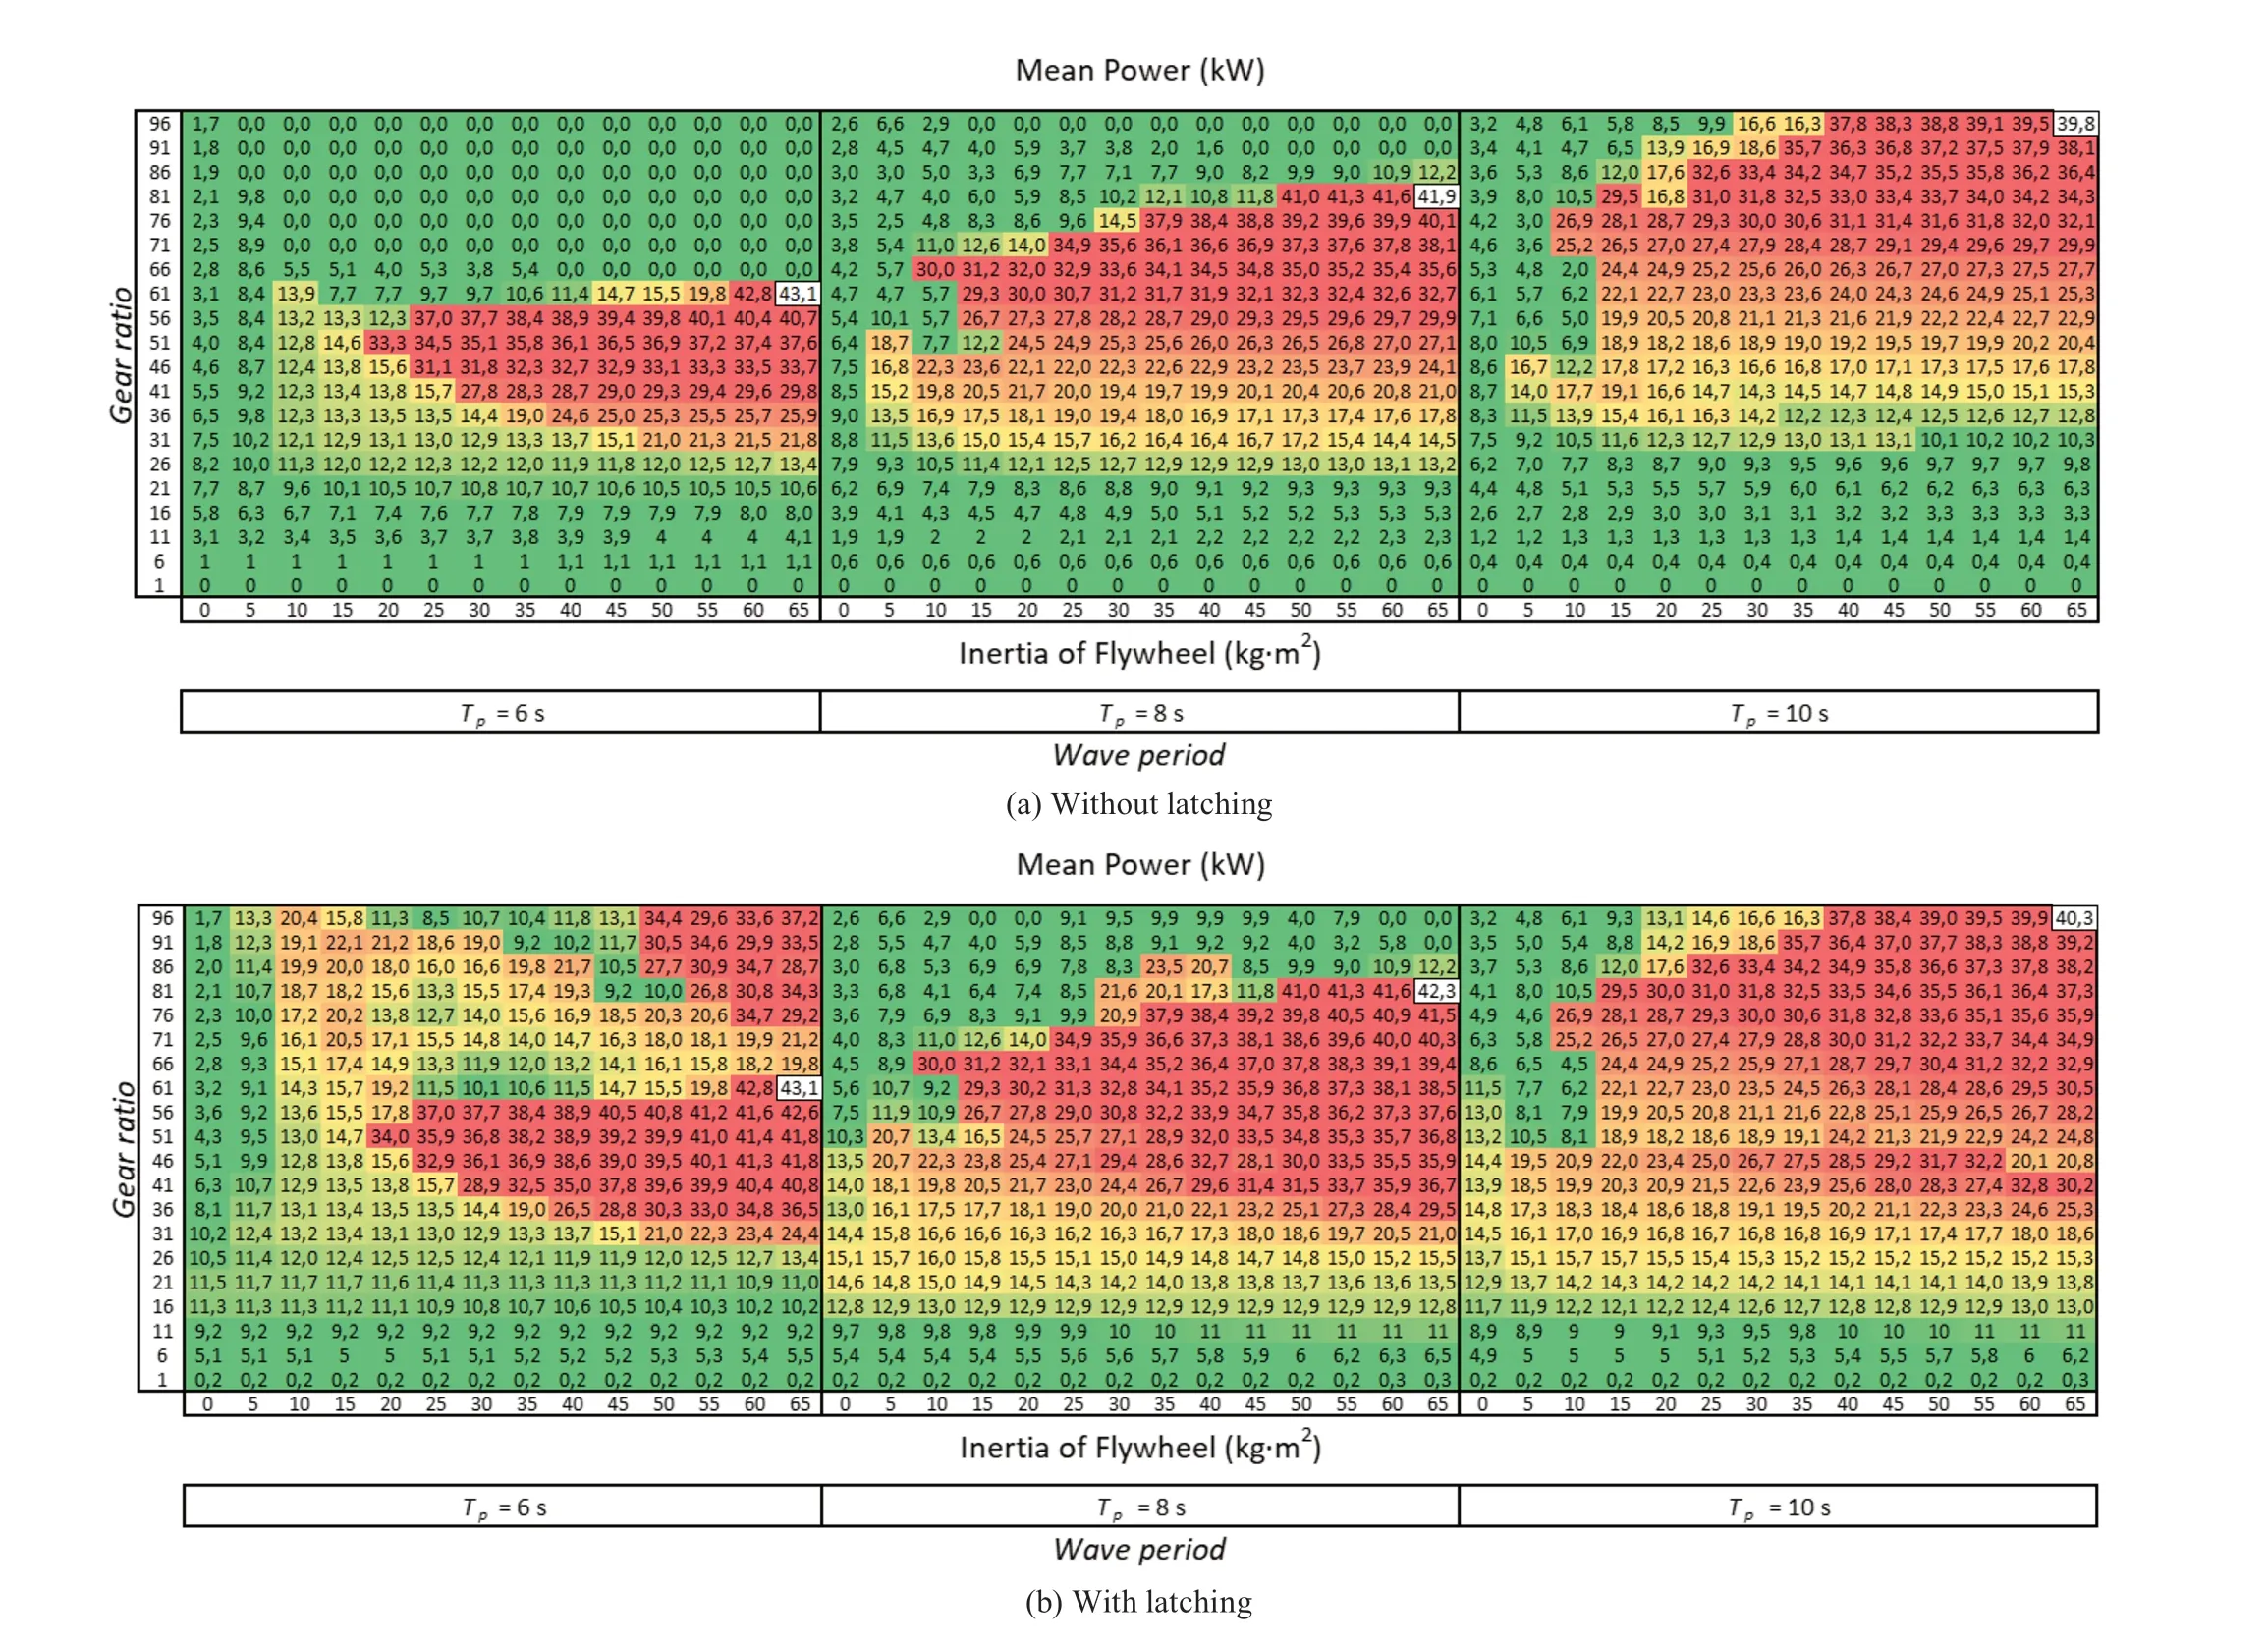
Figure 14 Influence of wave period on the mean power, buoy 20, generator G2
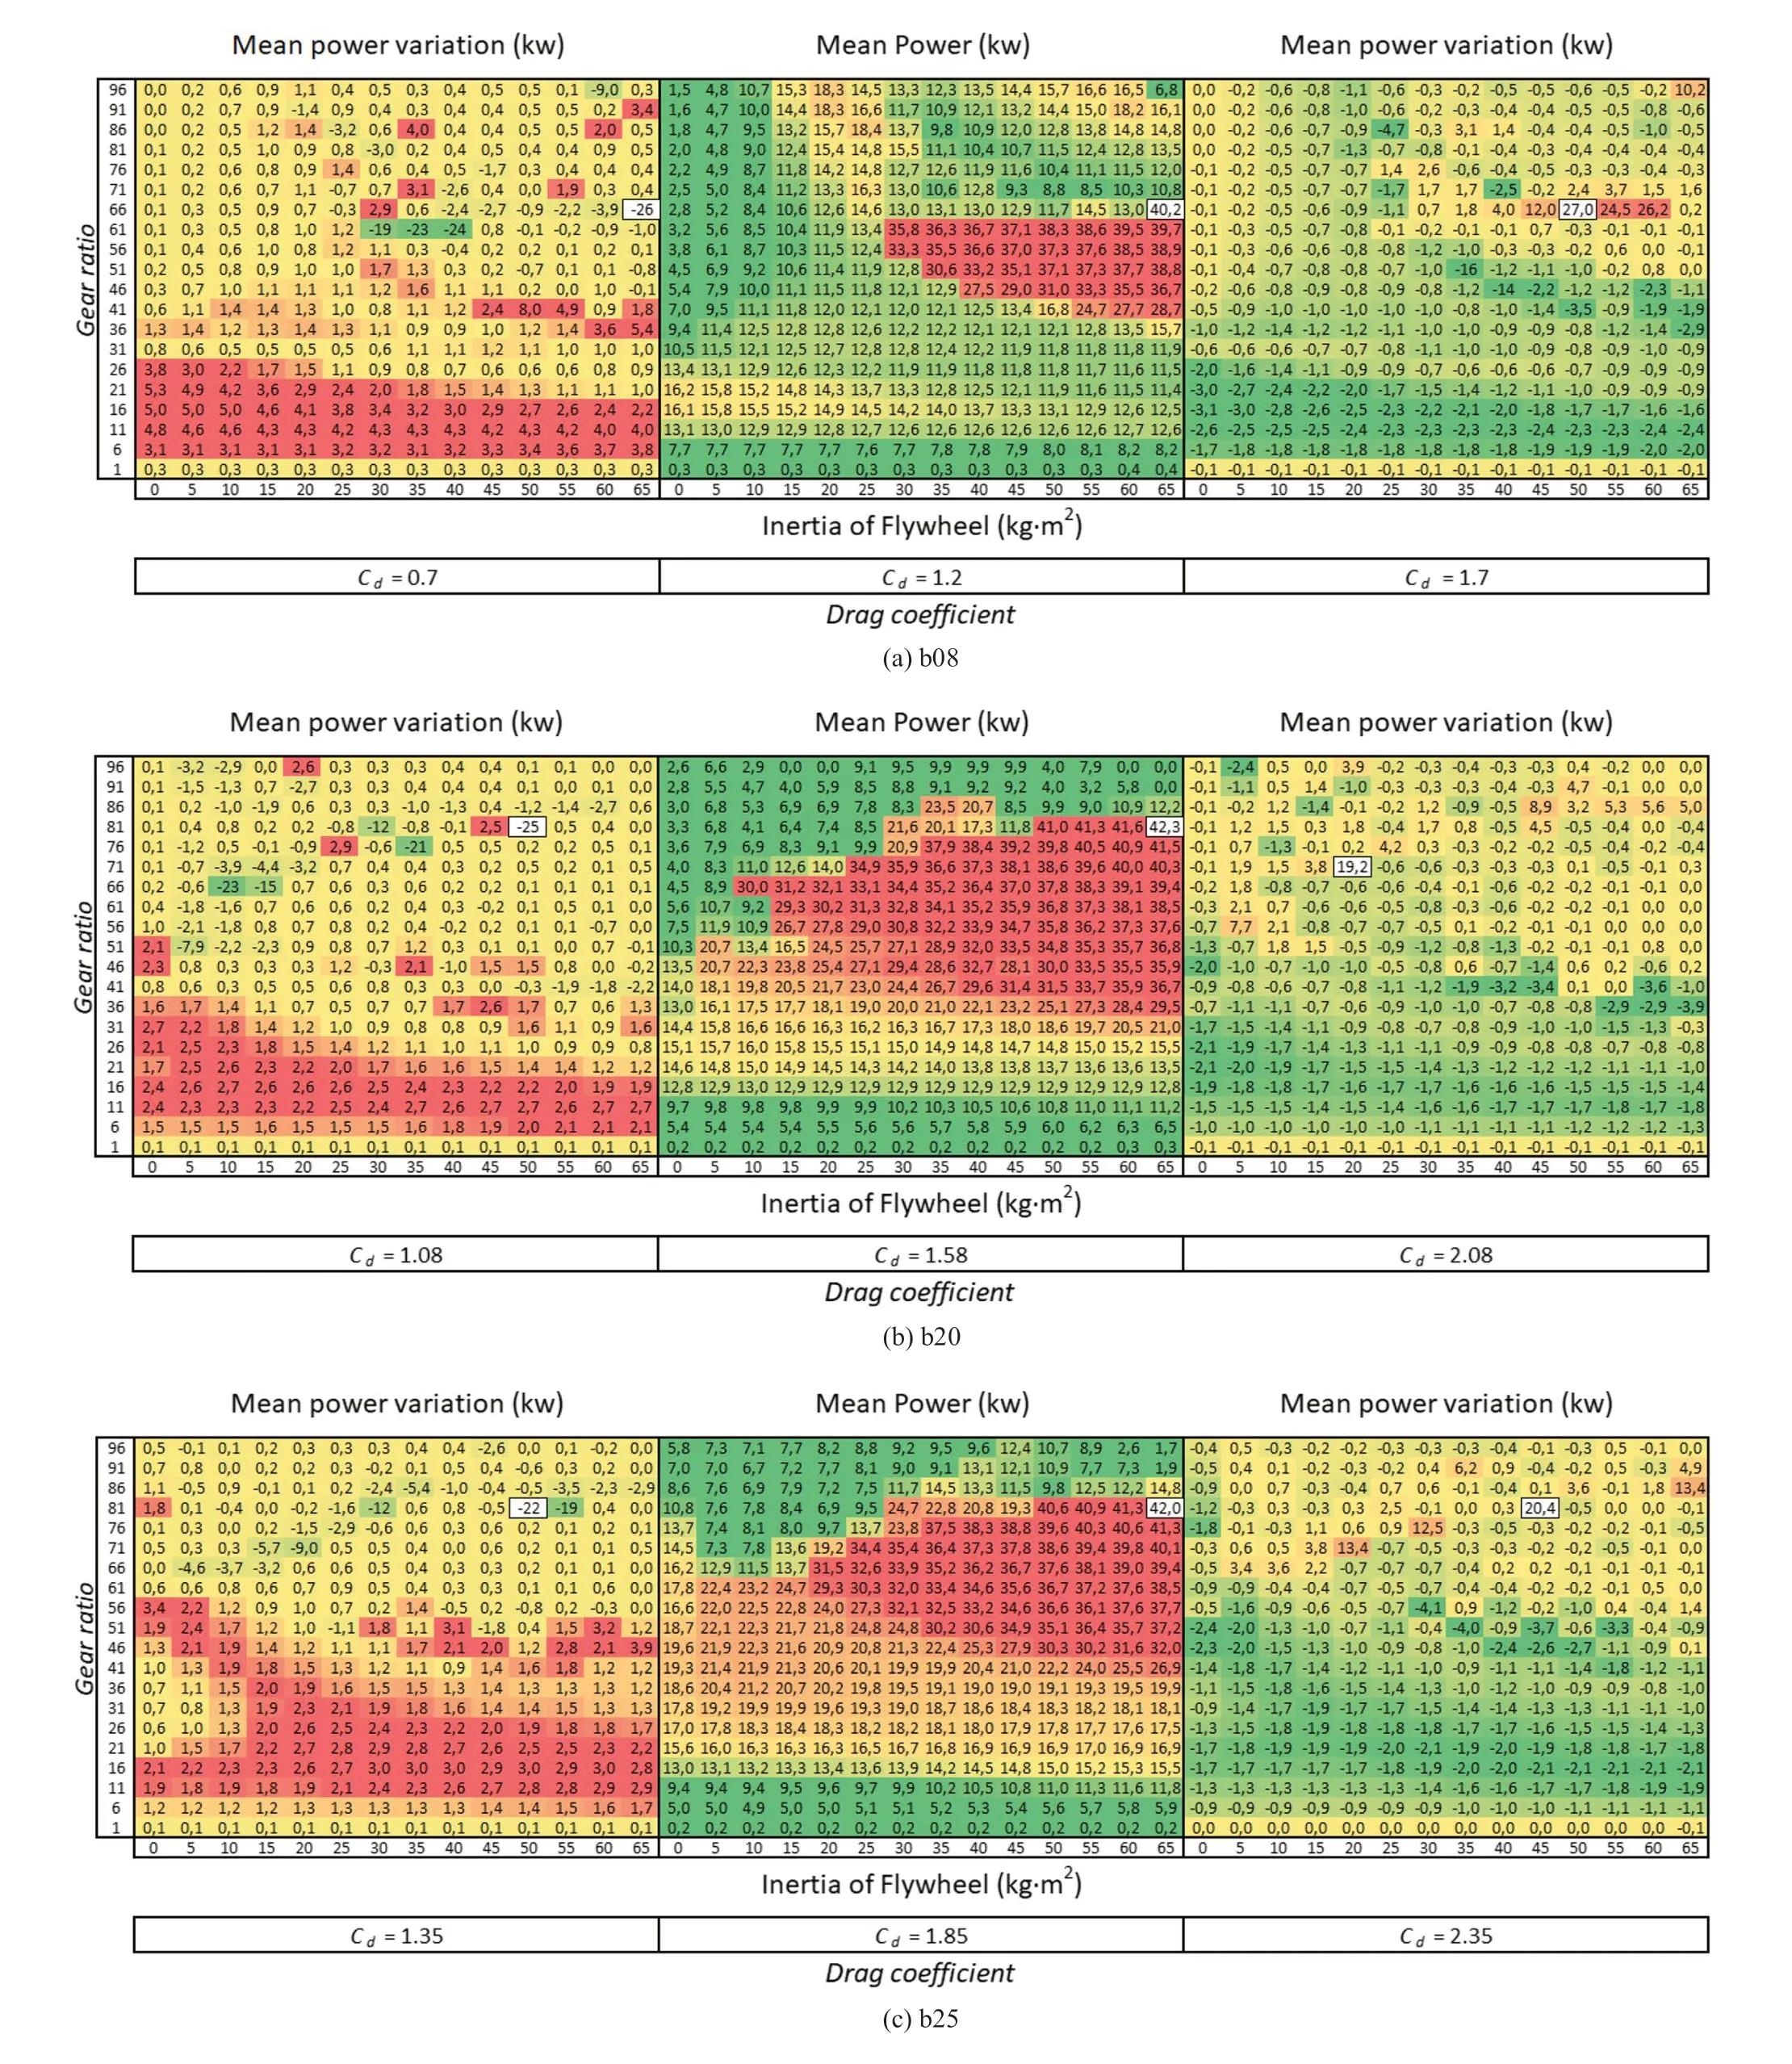
Figure 15 Viscous force effect on mean power, generator G2, with latching control, Tp=8 s
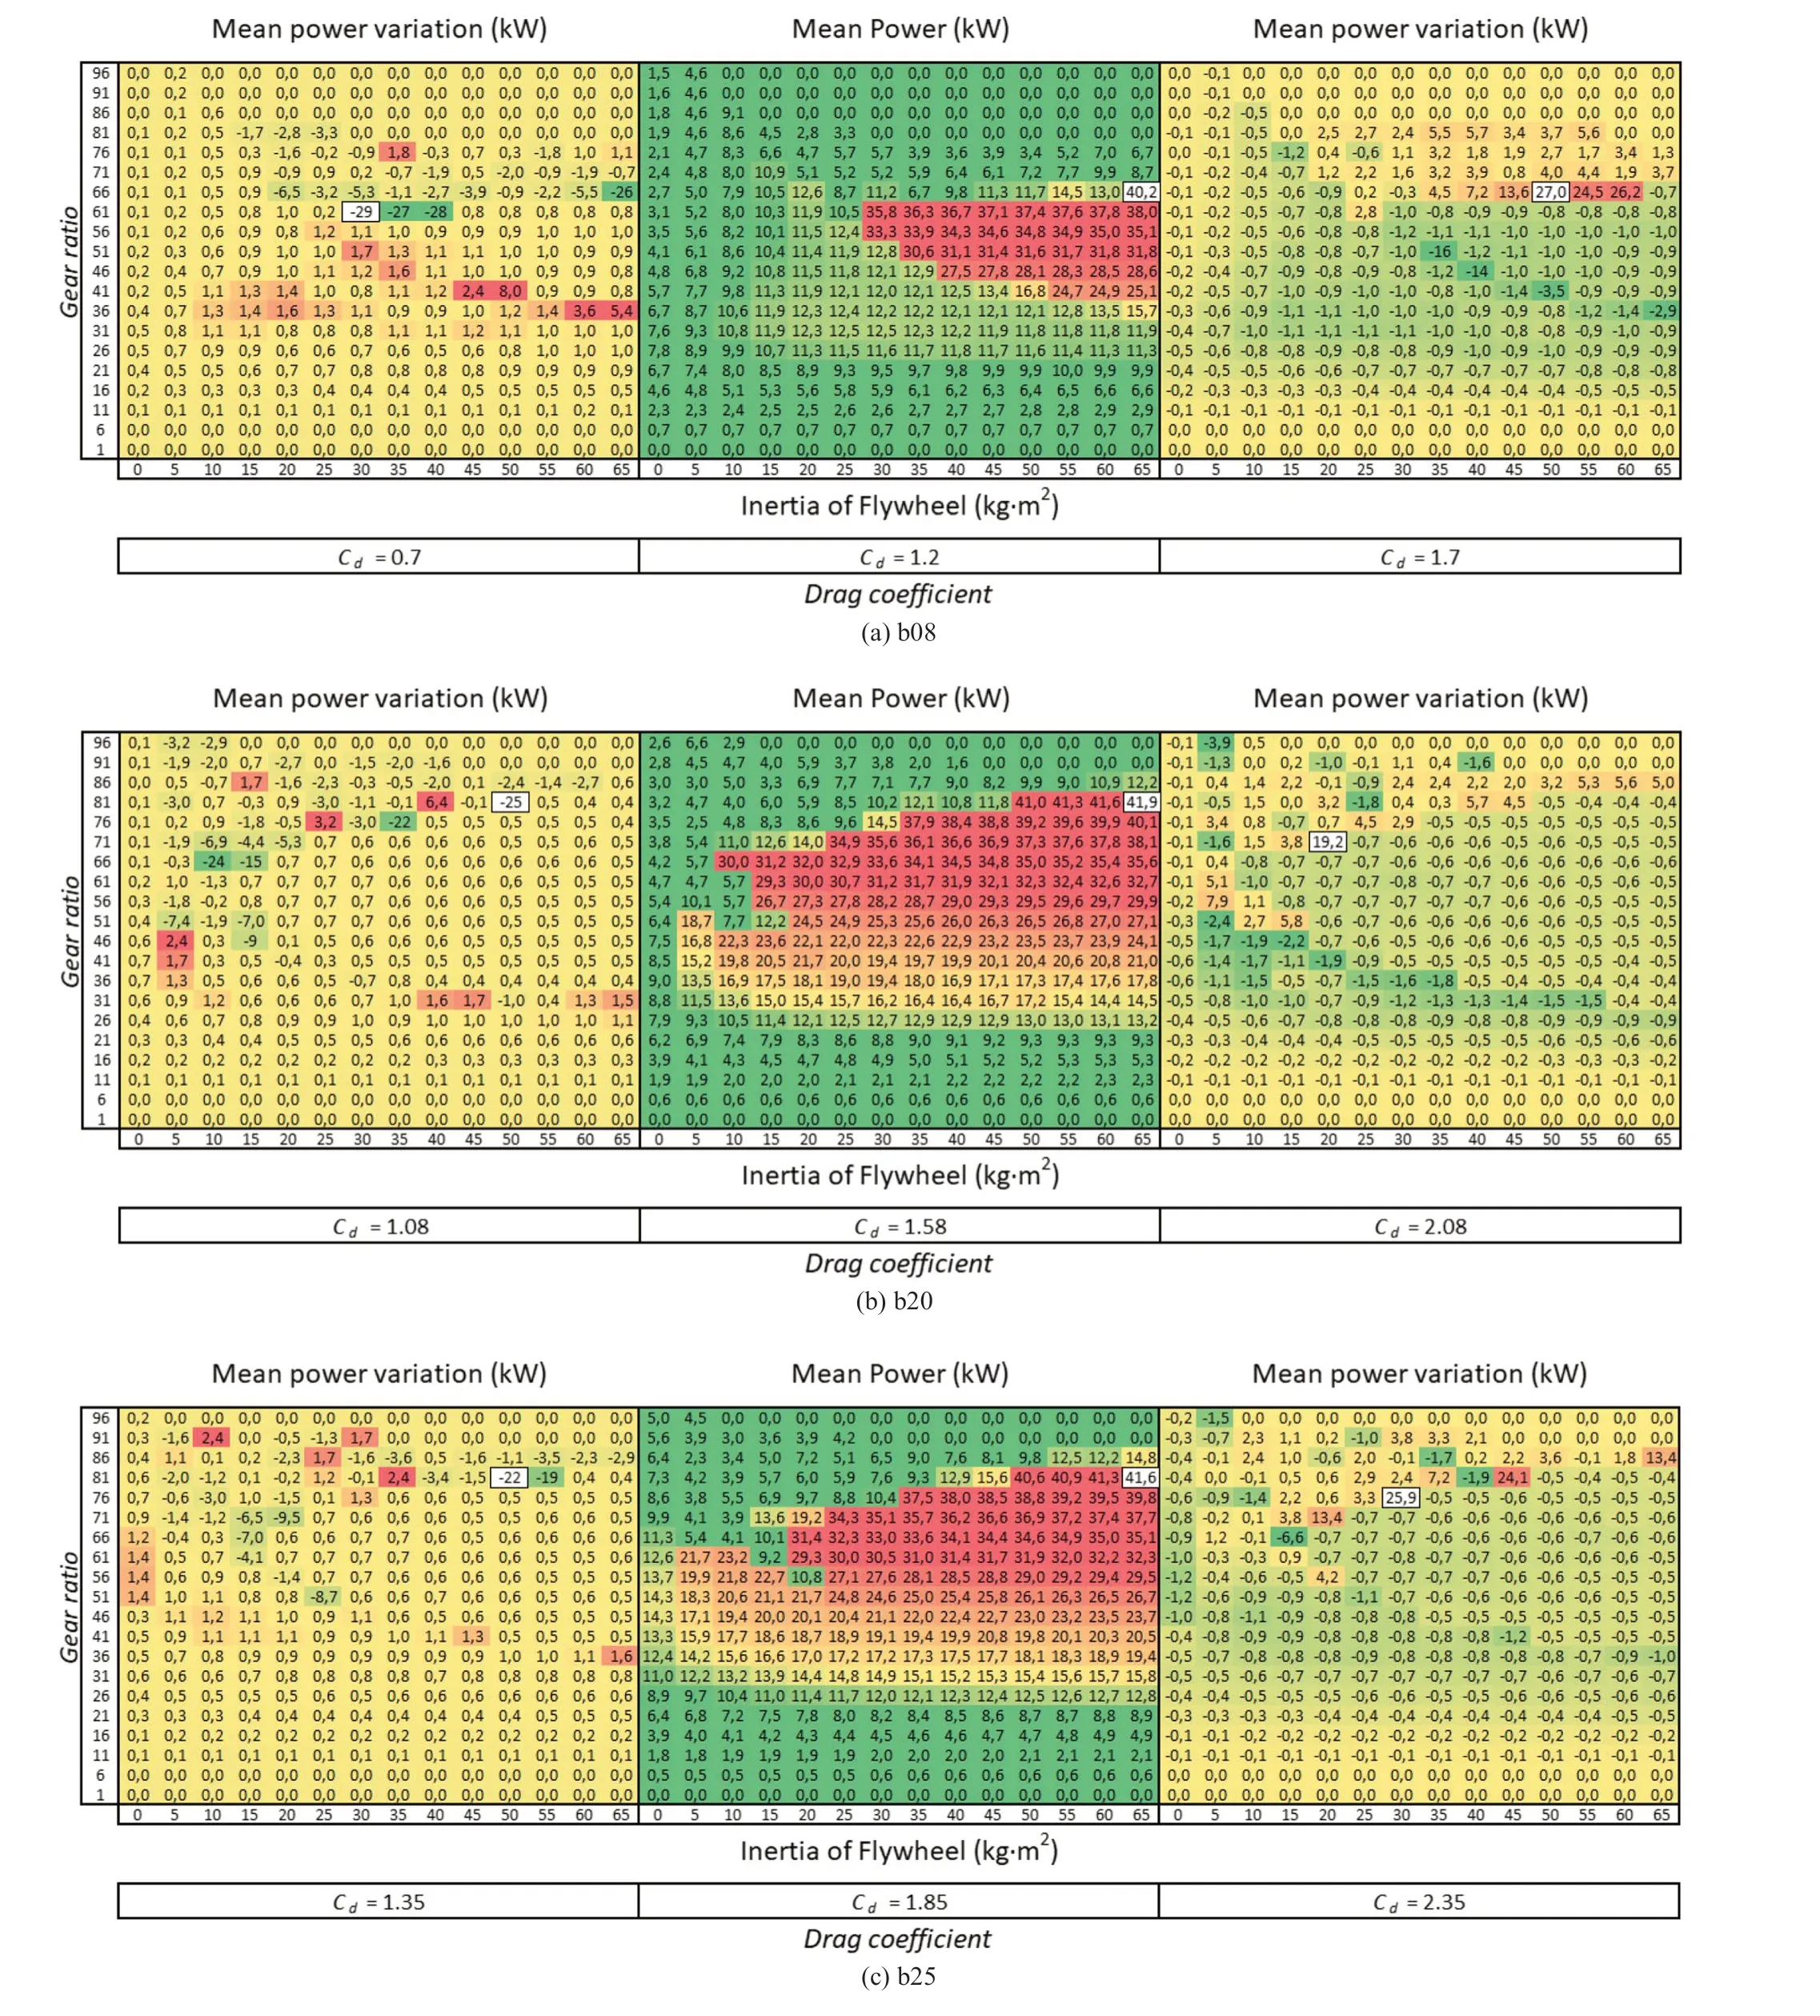
Figure 16 Viscous force effect on mean power, generator G2, without latching control, Tp=8 s
Considering that there is no latching control, see Figure 16, the viscous effect on mean power is smaller. However, there are still exceptional cases where the viscous effect produces high values of the mean power variation. The average of the mean power variations for b08, b20, and b25 is 1.1, 0.94, and 0.87 kW, respectively. This result shows that,although it is not considered a latching control system, b08 may be the most affected by the viscous effect.
Considering the same analysis of the viscous force effect but for a linear PTO, see Eq. (19), the maximum mean power obtained is 15.35, 12.16, and 15.90 kW for b08, b20, and b25 respectively. The proposed PTO can exceed these maximum values of mean power, even without the latching control system. A linear PTO only depends on the damping coefficient,see Eq. (19). In contrast, the studied PTO depends on several parameters, as observed in Eq. (11), which can increase or decrease the generating power. However, despite its complexity, the proposed PTO shows a behavior similar to a linear PTO if the gear ratio is low as described in Figure 11 and Figure 12.
5 Conclusions
A wave energy converter’s power performance composed of a direct mechanical drive power take-off controlled by a latching control system is addressed. Three generators of 50 kW and three cylindrical heaving point absorbers with different diameter (D)/draft (T) ratios are considered.According to the Morison equation, the analysis is based on regular waves using a nonlinear model that considers the viscous effect. The most relevant conclusions are indicated below.
1) A satisfactory PTO performance adopting the latching control system depends on the gear ratio and flywheel inertia. The mean power is more dependent on the gear ratio. It significantly increases the equivalent PTO mass and the torque.
2) The ideal values of gear ratio and flywheel inertia change with the rated speed of each generator. Regardless of the buoy, the generator with rated speed equal to 500 r/min shows an increase in mean power without significantly increasing the gear ratio.
3) The latching control system contributes to improving the PTO performance. In some cases, the latching control system should be disabled as it does not increase the mean power.
4) Independent of the latching control, the b20 and b25 buoys have almost the same power performance, superior to b08, which has the most significant mass and the lowest diameter/draft ratio (D/T=0.8). Also, b08 shows the highest amplitude, but the minimum value of amplitude/draft ratio, showing oversizing characteristics for the regular wave. Although b20 and b25 buoys show similar power performance, b20 is the smallest buoy(64% of the mass of b25). It is an important factor from the point of view of installation, structure, and cost.
5) Depending on the generator-buoy coupling, the PTO generates an intermittent force. The kinetic energy stored by the flywheel is used efficiently during the uncoupling. However, if the generator speed is outside the operating range, the flywheel inertia will keep the generator longer outside the operating range, with no power generation.
6) The increase of wave period increases the gear ratio to obtain a higher mean power. In general, the mean power variation due to the viscous effect is not so high.Although there are exceptional variations, these exceptional variations in mean power are produced by the generator’s operating range and not by the viscous effect.
The proposed WEC subject to regular waves shows a good power performance if the correct WEC parameters are chosen, such as buoy dimension, gear ratio, flywheel inertia, and rated speed of generator. Furthermore, it shows that the latching control system can produce an increase in mean power, clearly indicating that it does not always represent a significant increase if the PTO characteristics already provide considerable mean power. Based on the presented analysis for regular waves, future studies for irregular waves will bring additional insights into the influence of latching control on power production.
Appendix
The decay test of each buoy is reproduced based on computational fluid dynamics. The initial amplitude of each buoy is considered 70% of its draft. According to Jin et al. (2018),the value ofCdis calculated using the least-square method.Different values ofCdare tested in the nonlinear model(NM) to minimize the fit criterionR(Cd), see Eq. (21),wherezis the buoy displacement.

Like Bhinder et al. (2011), Reynolds Averaged Navier–Stokes (RANS) solver is used to simulate the two-phase flow field’s motion. The free surface is modeled using the volume of fluid method (VOF) based on the modified HRIC (high-resolution interface capturing) scheme.Momentum and continuity equations are coupled through the PISO algorithm. The time integration is carried out through a 1st-order implicit scheme, and the variable time step method is applied. The decay test is modeled with two symmetrical planes to avoid the high computational cost.Meshes have been generated using the cut cell method where the Cartesian mesh is predominant.
In Figure A1, a sensitivity study of mesh for the buoy b08 is shown. The element size around the buoy is 0.04 m for mesh 1 and mesh 2 and 0.025 m for mesh 3. The three meshes consider an element size of 0.1 m in the free surface. Mesh 1 considers a CFL equal to 0.8 and mesh 2 and mesh 3 consider a CFL 0.7. The results show that mesh 2 and mesh 3 show good agreement and convergence. The characteristics of mesh 3 are considered for the following meshes of b20 and b25. It has a total size of about 4.0 million elements. Table A1 shows the drag coefficient calculated of each buoy. And in Figure A2,the decay test based on CFD and nonlinear model is shown.Acknowledgements The authors acknowledge the support from the Brazilian Research Council (CNPq), contract numbers 380950/2018-9(INEOF- National Institute for Ocean and River Energy) and 305657/2017-8, respectively. Special thanks to FAPERJ for the support of the wave energy research at the Subsea Technology Lab (COPPE),contract number E-26/202.600/2019
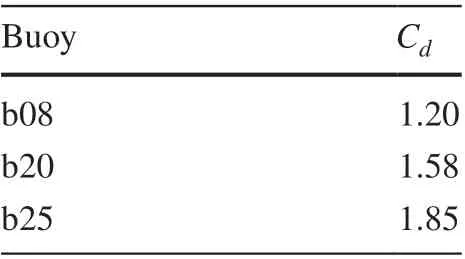
Table A1 Drag coefficient of each buoy
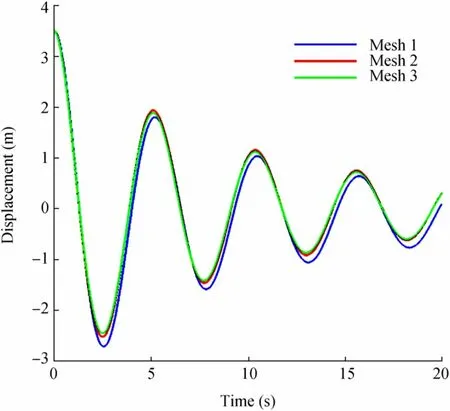
Figure A1 Decay test, mesh sensitivity study, b08
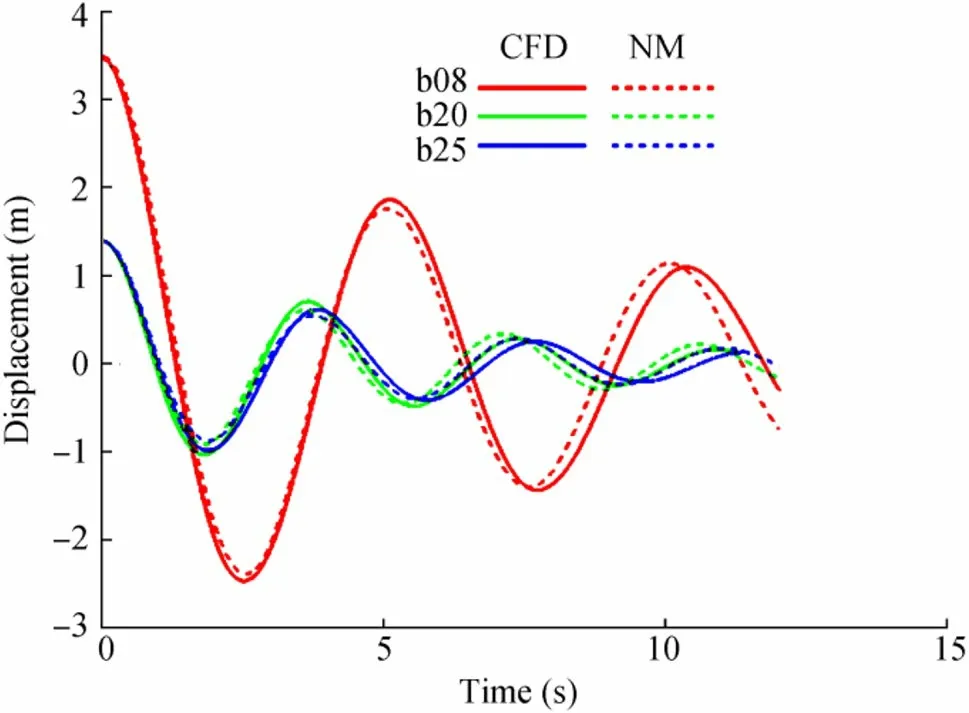
Figure A2 Decay test of each buoy
Open AccessThis article is licensed under a Creative Commons Attribution 4.0 International License, which permits use, sharing, adaptation, distribution and reproduction in any medium or format, as long as you give appropriate credit to the original author(s) and the source,provide a link to the Creative Commons licence, and indicate if changes were made. The images or other third party material in this article are included in the article's Creative Commons licence, unless indicated otherwise in a credit line to the material. If material is not included in the article's Creative Commons licence and your intended use is not permitted by statutory regulation or exceeds the permitted use, you will need to obtain permission directly from the copyright holder. To view a copy of this licence, visit http://creativecommons.org/licenses/by/4.0/.
 Journal of Marine Science and Application2021年4期
- Journal of Marine Science and Application的其它文章
- Postbuckling of Marine Stiffened Composite Plates with Initial Geometric Imperfections Using Progressive Failure Analysis
- Blast Pressure Measurements of an Underwater Detonation in the Sea
- Experimental Study of a Sphere Bouncing on the Water
- Optimal Design of a Ship Multitasking Cabin Layout Based on the Interval Optimization Method
- Reliability‑Based Analysis of a Caisson Breakwater with the Application of Bayesian Inference
- Rigid‑Body Analysis of a Beveled Shape Structure in Regular Waves Using the Weakly Compressible Smoothed Particle Hydrodynamics(WCSPH) Method
