Soil-vegetation-atmosphere interaction over a hilly forest in the southern Huaihe River Basin: Long-term field experiment and preliminary analysis of basic observations
Qiudn Di , , Zhenhi Guo , Shufen Sun , Xi Xio
a State Key Laboratory of Numerical Modeling for Atmospheric Sciences and Geophysical Fluid Dynamics (LASG), Institute of Atmospheric Physics, Chinese Academy of Sciences, Beijing, China
b Public Technology Service Center, Institute of Atmospheric Physics, Chinese Academy of Sciences, Beijing, China
Keywords:Soil-vegetation-atmosphere interaction Diurnal variation Huaihe River basin Soil CO 2 concentration
ABSTRACT To improve the understanding of the CO 2 exchange and the cycling of energy and water between the land surface and atmosphere over a typical hilly forest in southeastern China, a long-term field experimental observatory was established in Huainan, Anhui Province. Here, the authors briefly describe the three parts of ongoing research activities: the environmental monitoring at the site, the meteorological observations on a high tower, and particularly the intensive measurement of soil-vegetation-atmosphere interaction on a lower tower. Specifically,the diurnal variation of basic meteorological variables on a typical clear day (13 July 2018), and their temporal variation in the first three months of the low tower’s operation (4 June to 31 August 2018), and in combination with simultaneous data from the high tower, are analyzed. Results show that the data demonstrate reasonable variabilities, and the variables exhibit significant diurnal variation, characteristics of summer values, and considerable differences in summer months. The daily and monthly average albedos above the forest canopy were both 0.13. The daily average soil CO 2 concentration was 1726 and 4481 ppm at 2 and 10 cm, respectively. The soil CO 2 concentration changed with soil volumetric moisture contents, but showed a weak correlation with soil temperature in summer 2018. As the observatory continues to run and data continue to be collated, further investigation of the long-term variation of monsoon characteristics should be performed in the future. The experiment is useful in ecosystem and atmosphere interaction research, as well as for the development and evaluation of climate models, in the transitional climate zone of the Huaihe River basin.
1. Introduction
Land surface processes play an important role in climate change( Dirmeyer and Shukla, 1994 ; Koster et al., 2006 ; Yasunari et al., 2006 ;Kang et al., 2007 ), but this has always been a challenging area of research owing to the complexity of the interactions between ecosystems and the atmosphere. Many experiments and modeling efforts have been carried out over the past few decades. For example, FLUXNET, including ChinaFLUX, containing over 500 tower sites that span a range of climates and cover most biome types ( Schimel et al., 2015 ), runs on a long-term and continuous basis ( Baldocchi et al., 2001 ). However,few long-term observations have been gathered in the transitional climate zone of the southern Huaihe River basin in China ( Yu et al., 2006 ;Huang et al., 2008 ; Liu et al., 2013 ; Wei et al., 2016 ). To fill this gap,as well as meet many other research requirements related to urbanization in this region, the Huainan Climate and Environment Observatory (HCEO) was established in Huainan in 2013 by the Institute of Atmospheric Physics (IAP), Chinese Academy of Sciences (CAS), providing a fixed field site for a long-term experiment to investigate landatmosphere interactions in the region. The main objectives of the observatory related to this experiment are to: (1) monitor the local weather and environment; (2) monitor the long-term trends of COvariation and climate changes; (3) investigate the soil-vegetation-atmosphere interaction of this land surface type; and (4) improve land surface and climate models. The plan is for these observations to be carried out successively and continuously to obtain long-term datasets. Furthermore,future additional measurements of soil and vegetation hydrothermal and biological properties will be recorded to describe the possible factors controlling the fluxes of CO.
This paper begins by briefly describing the observatory, especially its intensive observations used for investigating the soil-vegetationatmosphere interactions at Huainan, after then presenting a preliminary analysis of the data obtained from June to August 2018.
2. Field experimental observatory
2.1. Site description
In 2013, the field experimental observatory of HCEO (32°44 ′ N,117°08 ′ E; 0 m above sea level) was established by the IAP, CAS, on the hillside of a small hill in the northwest of Shangyao National Forest Park in Huainan, in north-central Anhui Province, China ( Fig. 1 (c)).Construction at the HCEO site included the establishment of a 108-m high tower (referred to as the “high tower ”) on the hilltop (80 m above sea level; Fig. 1 (a)), several observation systems (e.g., a set of wind profile radars, an environment detection system, microwave radiometers),and meteorological instruments on the high tower to monitor the COflux and other weather elements. In 2017, another meteorological observation system (CR1000, Campbell Scientific, Logan, Utah, USA) was installed on a frame (referred to as the “low tower ”; Fig. 1 (b)) 17.2 m away from the high tower for enhancing the observations of the soil,vegetation and atmosphere in the forest canopy ( Dai et al., 2020 ), with data having been collected since June 2018. The station is located just to the south of the Huaihe River, within the Huaihe River basin, which is part of the transitional climate zone between the warm temperate semihumid monsoon climate and the subtropical humid monsoon climate in the Northern Hemisphere ( Wang et al., 2017 ). There are villages and farmland to the west of the observation post, surrounded by rivers, not far from the city. Vegetation is an oak-dominant mix of secondary forest. Soils are sandy, gravelly loams. The terrain is complex, representing a typical hilly secondary forest vegetated land surface near cities and villages in the Huaihe River basin. The mean annual temperature of Huainan is 15.3°C and the total mean annual precipitation is about 960 mm ( Liu et al., 2019 ).
2.2. Instrumentation
The radiation observation system includes three sets of a fourcomponent Net Radiation Sensor (CNR4, Kipp & Zonen, Delft, Holland),one of which is mounted at a height of 25 m on the high tower, and the other two are installed at heights of 3.5 and 6 m respectively on the low tower. The system observes downward and upward short- and long-wave radiation.
Air temperature and relative humidity are measured by a HUMICAP® Humidity and Temperature Probe (HMP155, Vaisala, Helsinki,Finland). Wind is measured with a WINDSONIC 2-D Sonic Wind Sensor(Campbell Scientific, Logan, Utah, USA).
Soil is monitored at three different sites (recorded as n0, n1, and n2)at two soil depths (10 cm and 20 cm), and n0 also includes two other depths of 0 cm and 2 cm. Soil temperature is measured by a 109-L Temperature Probe (Campbell Scientific, Logan, Utah, USA) and soil moisture by a CS616 Water Content Reflectometer (Campbell Scientific, Logan, Utah, USA) both at sites n1 and n2. Soil temperature and moisture is measured by a Stevens Hydra Probe II soil temperature and moisture sensor (Portland, Oregon, USA) at site n0.
Soil heat flux is measured by a Soil Heat Flux Plate (HFP01, Hukseflux, Holland) at 10 cm and 20 cm at site n1.
The COconcentration in the canopy and in the soil at site n0 is measured by a Carbocap® COsensor (GMP343, Vaisala, Helsinki, Finland).
An eddy covariance system that includes wind anemometers (Wind-Master Pro, Gill, Lymington, Hampshire, UK) and an Open Path CO/HO Analyzer (LI-7500A, Li-COR, Lincoln, NE, USA) is installed at 30 m and 80 m on the high tower. The turbulence data are sampled at 10 Hz.
The data are collected by three data loggers (CR3000, Campbell Scientific, Logan, Utah, USA) mounted at 2 m and 35 m on the high tower and at 2 m on the low tower, recording average values at intervals of 10 min, 30 min, and daily. The 2-D sonic wind data are given by 10 readings per second.
3. Preliminary results
The date of 13 July 2018 was a cloudless and clear day according to the records of the National Meteorological Observatory at Huainan city. We selected this day as a representative case of a typical clear day in summer to investigate the daily variation characteristics of various measurements at the observation site. Furthermore, we also analyzed the summer season’s data (4 June to 31 August) to evaluate the temporal variation since this was the time when the instruments on the low tower began to be operational.
3.1. Variation of net radiation and its four components
The diurnal variations of downward and upward shortwave and net radiation all rose in the morning, reaching their highest levels at noon and declining in the afternoon ( Fig. 2 (a)), which are the conventional symmetric structures on a typical clear day as observed in other places( Wang et al., 2008 ). The maximum downward and upward shortwave and net radiation was 949.67, 111.53, and 785.13 W mrespectively,all occurring at 1230 LST. The upward longwave radiation was larger than its downward counterpart, for the forest canopy broadened the amplitude of the upward longwave radiation ( Fig. 2 (a)). The maximum downward and upward longwave radiation was 452.00 and 503.67 W m, occurring at 1700 LST and 1400 LST, respectively. The minimum downward and upward longwave radiation was 410.47 and 456.4 W mrespectively, both occurring at 0500 LST. The shortwave radiation in the canopy became smaller and occurred with multi-peak patterns( Fig. 2 (b, c)), which can be explained by the shading of the trees and interaction of the trees with wind. The maximum downward shortwave radiation was 275.7 W mat 6 m, and the radiation at 3.5 m was even smaller, at no more than 103.2 W mfor the whole day.
Fig. 2 (d-f) shows the temporal variation of radiation. The changes are large for downward shortwave radiation, from − 5.39 to 1031.33 W m, at the top of the canopy. There are several obvious low-value areas ( Fig. 2 (d)) because of rain on those days (e.g., it was cloudy and raining on 4-9 July, 23-28 July, and 12-20 August, as recorded by the National Meteorological Observatory at Huainan city), which resulted in relatively lower shortwave radiation. As per the clear day’s results,the radiation at 6 m was larger than that at 3.5 m for the whole summer.The temporal variation amplitude was also larger at 6 m than at 3.5 m( Fig. 2 (e, f)).
The albedo above the canopy was calculated as the ratio of upward to downward shortwave radiation when the downward shortwave radiation was greater than 150 W m. The albedo on this typical clear day gradually decreased from 0.23 at 0610 LST to 0.12 at 1010 LST, leveled offto about 0.12, and then finally increased to 0.13 from 1730 LST to 1810 LST (figures not shown). The daily variation pattern of high albedo in the morning and low albedo in the afternoon is consistent with the results observed in many places ( Wang et al., 2008 ). The daily average albedo was 0.13. The temporal variation of albedo from 28 June to 31 August was characterized by a change from 0.09 to 0.25. The monthly average albedos of July and August were both 0.13.
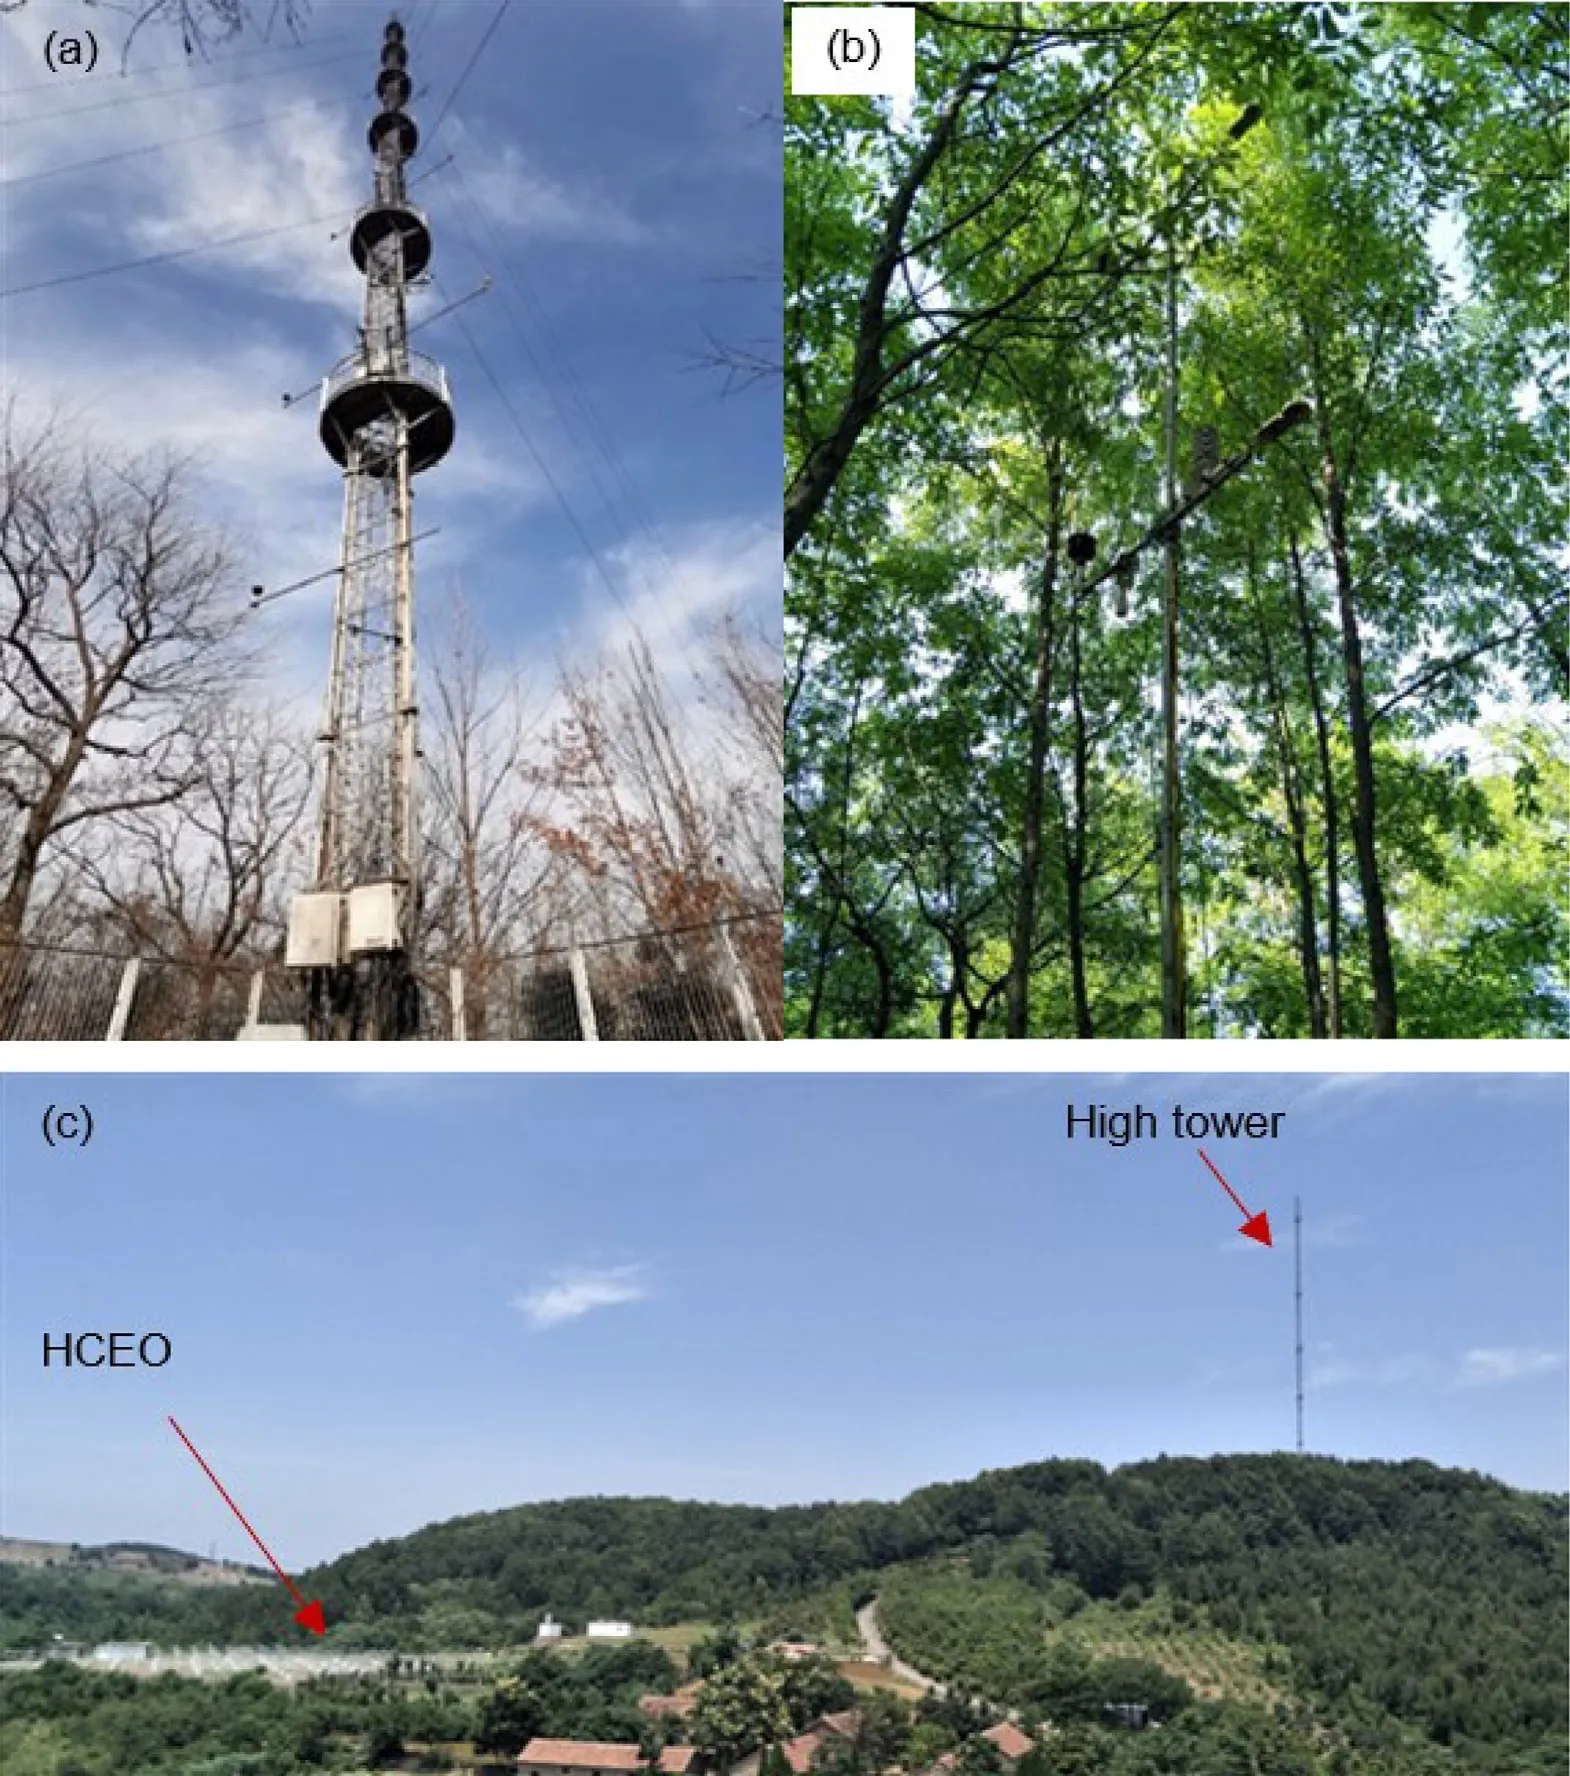
Fig. 1. Huainan Climate and Environment Observatory (HCEO): (a) high tower; (b) low tower; (c) location and geographic features.
3.2. Variation of air temperature, relative humidity, and wind
The temperature at 10 m, 20 m, and 35 m measured on the high tower decreased with height in the daytime and increased with height at night ( Fig. 3 (a)). Fig. 3 (e) shows that the mean temperature in June was relatively low, and then increased as the midsummer came. But the average temperature in August was lower than that in July, because there was more precipitation in August than in July (196.1 mm in August, but 114.1 mm in July).
The temperature in the tree canopy was generally lower than that outside, as measured on the high tower, and the maximum difference was 1.0°C lower at 6 m than that at 10 m, which occurred at 0800 LST. Only in the period 1230-1400 LST was the temperature at 6 m higher than at 10 m, and the maximum difference was only 0.2°C. This can be explained by the shading of leaves. The temperatures at 3.5 and 6 m in the canopy were very close to one another, with a maximum difference of 0.35°C. The maximum temperature at 3.5 and 6 m was 33.28°C and 33.31°C respectively, and appeared at 1400 LST; the minimum was 26.39°C and 26.43°C respectively, and occurred at 0530 LST.The maximum was 33.36°C, 33.56°C, and 33.51°C, appearing at around 1630 LST, at 10, 20, and 35 m respectively, which lagged the peak value of radiation ( Fig. 2 (a)) as found in other studies ( Wei et al., 2016 ;Park et al., 2013 ), and the minimum for the three layers was 26.79°C,26.92°C, and 27.15°C respectively, all of which occurred at 0500 LST.
Like the temperature relationship, the relative humidity values at 3.5 and 6 m in the canopy were also close to one another ( Fig. 3 (b)), but with those at 3.5 m being larger. The relative humidity values at 10 m were also close to those at 3.5 and 6 m, although the instrument recording these measurements is set on the high tower outside of the tree canopy and slightly in the open air. The relative humidity at 20 m was highest.The relatively humidity in July was relative lower ( Fig. 3 (f)) than in August, for there was less rain in July than in August, as mentioned before, but with a monthly difference of no more than 1%.
The diurnal variation of wind speeds showed a similar pattern, increasing in the morning and decreasing in the afternoon and then increasing again at night for all levels except 10 m ( Fig. 3 (c)). The wind speed at 10 m decreased slightly in the daytime, perhaps due to the reason that 10 m is comparable to the height of the canopy, with the surrounding area of the tower being slightly open, and the air flow more complicated. The wind increased with height, with the average wind speeds at 6, 8, and 10 m being 0.57, 0.62, and 2.03 m srespectively,and above 10 m they were between 5.0 and 7.0 m s. Though observed at different towers 17.2 m apart, the wind in the canopy at 6 and 8 m showed a similar variation trend, because they had close heights and shared the similar environment of surrounding trees.
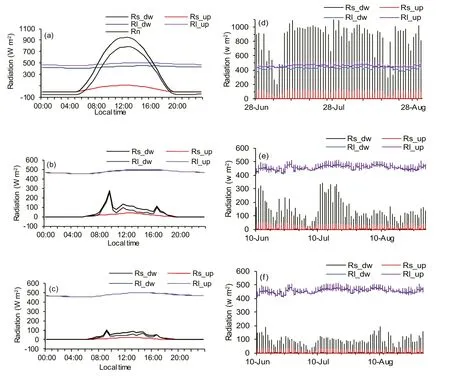
Fig. 2. (a-c) Diurnal variation of net radiation and its four components on 13 July 2018: (a) over the forest canopy at 25 m; (b) in the middle of the canopy at 6 m;(c) under the canopy at 3.5 m. (d-f) Temporal variation of net radiation and its four components from 10 June to 31 August 2018 (30-min intervals for 3.5 and 6 m;10-min intervals for 25 m): (d) over the forest canopy at 25 m; (e) in the middle of the canopy at 6 m; (f) under the canopy at 3.5 m. Rs_dw, downward shortwave radiation; Rs_up, upward shortwave radiation; Rl_dw, downward longwave radiation; Rl_up, upward longwave radiation; Rn, net radiation.
The dominant wind direction was southwest on the clear day. The wind direction in the canopy changed more than that outside, which was caused by the blocking of the trees. It changed most for the 6-m wind ( Fig. 3 (d)), because it was observed at the low tower with more trees around.
The temporal variation of wind speed increased with height( Fig. 3 (g)), and high wind speeds occurred mostly on rainy days. Winds in the canopy were also obviously gentle and the speed variation was 0.45 m sat 6 m in summer. The dominant wind direction for all levels was northwest, but southeast for 6 m in summer ( Fig. 3 (h)).
3.3. Variation of soil temperature, soil moisture, and soil CO 2 concentration
Fig. 4 shows the change in soil temperature, soil moisture, and soil COconcentration at the three measurement sites (n0, n1, and n2). At the same site, the pattern of change in the extreme values of soil temperature was characterized by the maximum value of the shallow layer being larger and the minimum value of the deep layer being smaller( Fig. 4 (a)). The diurnal variation of soil temperature for the shallow layer was larger than that of the deep layer. At the same depth of 10 cm, the largest, middle and lowest average soil temperature was 28.0°C,27.1°C, and 26.5°C, occurring at n1 (barren soil), n2 (covered by grass),and n0 (under the canopy, covered by shrubs and leaf litter) respectively. The diurnal variation of soil temperature also had the same trend,which was caused by the shading effects of the canopy and the surface cover. The largest diurnal variation of soil temperature was 4.5°C, which occurred at the surface (0 cm).
Fig. 4 (d) shows the temporal variation of soil temperature. The average soil temperature at 0, 2 and 10 cm in July was 26.57°C, 26.55°C,and 26.07°C respectively at n0; and it was 26.68°C, 26.88°C, and 26.56°C for these three depths in August, respectively. The highest soil temperature at 0, 2, and 10 cm in the three months was 28.94°C, 28.58°C, and 28.11°C, respectively, which appeared on 11, 8, and 9 August respectively.
Fig. 4 (b) shows the diurnal variation of soil volumetric water content on 13 July 2018. The soil moisture for all the measurements decreased from midnight. Both the largest content and change occurred in the shallowest subsurface depth of 2 cm at n0, which was under the trees and covered by shrubs and leaf litter. The soil moisture at 10 and 20 cm at n1 was nearly the same, because this site is barren, gravelly soil containing little vegetation.
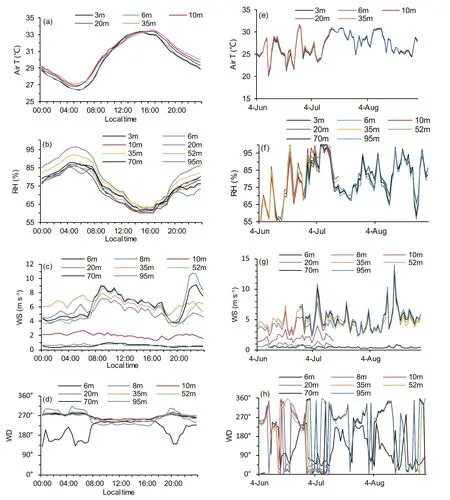
Fig. 3. (a-d) Diurnal variation of (a) air temperature, (b) relative humidity, (c) wind speed, and (d) wind direction on 13 July 2018. (e-h) Temporal variation of(e) air temperature, (f) relative humidity, (g) wind speed, and (h) wind direction in summer 2018.
The temporal variations of soil moisture for summer were larger than on the clear day, with similar trends of change, because they were mainly determined by the rain ( Fig. 4 (e)).
The soil COconcentration at 10 cm was larger than that at 2 cm in the shallow layer ( Fig. 4 (c)). The soil COconcentration of both layers tended to be high during the night and low in the afternoon, showing a relatively similar trend to the soil volumetric moisture content but an opposite tendency to soil temperature. This lower afternoon soil COconcentration phenomenon may be related to the lowering of the COconcentration removed from the air by strong photosynthesis in the afternoon under the plant canopy. However, this speculation needs to be properly verified in future work. The COconcentration reached a maximum of 4754 ppm and minimum of 4220 ppm at 10 cm, and a maximum of 1794 ppm and minimum of 1656 ppm at 2 cm, with some time lag in the deep layer. The diurnal change in the COconcentration was 534 ppm at 10 cm, with a slight variation of 138 ppm at 2 cm, on the clear day of 13 July. The daily average soil COconcentration was 1726 and 4481 ppm for 2 and 10 cm, respectively. The results are consistent with another study around the same soil depth under the forest canopy( Hirano et al., 2003 ).
The soil COconcentration was low in June and increased in July and August ( Fig. 4 (f)). It reached its largest daily mean of 2483 and 5010 ppm for 2 and 10 cm, both in August. The largest monthly mean was 4400 ppm in August for 10 cm, and 1640 ppm in July for 2 cm.The soil COconcentration changed with soil volumetric moisture content ( Fig. 4 (e,f)) and the relationship between them was very strong(R
values of 0.733 and 0.863 at 2 cm and 10 cm, respectively). However, the soil COconcentration showed a weak correlation with the soil temperature (R
<
0.024). These summertime results for soil COconcentration and its relationship versus soil volumetric moisture content and soil temperature are similar to those reported in other studies (( Bekele et al., 2007 ; Lathuillière et al., 2017 ), but showed interesting specific characteristics. Future investigations from the measurements are expected to result in further papers and collaborative research.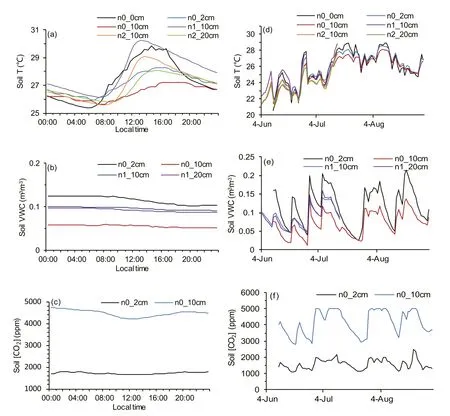
Fig. 4. (a-c) Diurnal variation of (a) soil temperature, (b) soil volumetric moisture content, and (c) soil CO2 concentration on 13 July 2018. (d-f) Temporal variation of (d) soil temperature, (e) soil volumetric water content, and (f) soil CO 2 concentration in summer 2018 (30-min intervals for n0; 10-min intervals for n1 and n2).
4. Summary and conclusion
This paper introduces the long-term field observatory of ecosystem and atmosphere interaction in Huainan over a hilly forest ecosystem located in the transitional monsoon climate zone in the southern Huaihe River basin. A preliminary analysis is made using the data of summer 2018, which was when the first three months of data were collected from the low tower. The diurnal and temporal variations of the observed net radiation and its four components, albedo, air temperature, relative humidity, wind speed and direction, soil temperature, soil moisture, and soil COconcentration, were analyzed. Results showed that the field experiment data demonstrated reasonable variabilities, and the variables exhibited significant diurnal variation, characteristics of summer values,and considerable differences in summer months.
The radiation components above the canopy showed conventional symmetric structures on a typical clear day, but the radiation in the middle and below the canopy showed different structures owing to the shading effect of the canopy. The daily and monthly average albedos above the canopy were both 0.13.
The dominant wind direction was northwest, and the average wind speed was 5.0-7.0 m sabove the height of 10 m. With the effect of trees, the winds were gentle in the canopy and showed a different pattern of change around the height of trees.
The daily average soil COconcentration was 1726 and 4481 ppm at 2 and 10 cm, respectively. The soil COconcentration showed a very strong relationship with soil volumetric moisture content, but a weak relationship with soil temperature in summer 2018. Also, the soil moisture and temperature were affected by rain and demonstrated different variation with various underlying surface conditions of barren soil, grass,shrubs, and leaf litter.
As HCEO continues to operate and collate data, further investigations into the long-term characteristics of monsoon variation will be performed in the future. HCEO will maintain and provide long-term data for investigations of ecosystem and atmosphere interaction, as well as for assessing and developing climate models.
Funding
This research was supported by the National Natural Science Foundation of China [grant number 41575092 ] and the National Key Research and Development Program [grant number 2018YFC1506600 ].
 Atmospheric and Oceanic Science Letters2021年1期
- Atmospheric and Oceanic Science Letters的其它文章
- An interdecadal decrease in extreme heat days in August over Northeast China around the early 1990s
- Thermal contrast between the Tibetan Plateau and tropical Indian Ocean and its relationship to the South Asian summer monsoon
- Land-sea breeze circulation structure on the west coast of the Yellow Sea,China
- CWRF-based ensemble simulation of tropical cyclone activity near China and its sensitivity to the model physical parameterization schemes
- Possible contribution of the PDO to the eastward retreat of the western pacific subtropical high PDO
- Simulated response of the active layer thickness of permafrost to climate change
