NIRS Prediction of SOM, TN and TP in a Meadow in the Sanjiang Plain, China
Zhao Yi-hang, Jiang Jing-wen, Yang Yu-peng, Zhang Xiao-meng, Meng Ling-dong, Ma Ze-wang, Hu Yao, and Yin Xiu-jie
College of Animal Sciences and Technology, Northeast Agricultural University, Harbin 150030, China
Abstract: The aim of this study was to establish the applicability of near-infrared reflectance spectroscopy (NIRS) as a rapid method for the accurate estimation of nutrient components in agricultural soils. Focusing on the soil of the Sanjiang Plain, NIRS was used to predict soil organic matter (SOM), the total nitrogen (TN) and the total phosphorus (TP). A total of 540 samples were collected from the three different depths (180 samples from each depth: 0-10, 10-20 and 20-30 cm), from 2015 to 2017, from the Sanjiang Plain in Heilongjiang Province, China. From every depth, 120 samples were used to construct the calibration set. Other 60 samples were used to check the efficiency of the model. Combining the first-order differentiation with the partial least square (PLS) method, a prediction model was obtained to measure SOM, TN and TP. The correlation coefficient of SOM from 0 to 10 cm was R2=0.9567, from 10 to 20 cm was R2=0.9416, and from 20 to 30 cm was R2=0.9402. The corresponding ratio (standard deviation [SD]/root mean square error of prediction [RMSEP]) was >2.96. R2 of TN with the three depths was 0.9154, 0.9028 and 0.9024, respectively, all with SD/RMSEP>2.89. Meanwhile, R2 of TP with the three depths was 0.8974, 0.8624 and 0.7804, respectively, all with SD/RMSEP>2.50. These results demonstrated that NIRS based on the first-order differentiation and PLS could efficiently predict SOM, TN and TP from different soil depths.
Key words: near-infrared reflectance spectroscopy (NIRS), organic matter, total nitrogen, total phosphorus
Introduction
The Sanjiang Plain, located in Heilongjiang Province, Northeast China, has the largest wetland of China.Deyeuxia angustifoliais the dominant species in this world-famous natural, low-humidity grassland.Deyeuxia angustifoliameadows are important resources for animal husbandry and provide ecological barriers in northern China. Researches on the soil nutrient components of the Sanjiang Plain grassland and their uses are important (Liet al., 2010; Liet al., 2011; Shiet al., 2015; Yiet al., 1985).
Since soil provides the necessary nutrition for vegetation, changes in soil ingredients and their amounts will alter the corresponding plant growth and production. Precise soil information is important for protecting and exploiting grasslands (Wanget al., 2015). The soil organic matter (SOM), the total nitrogen (TN) and the total phosphorus (TP) are important factors that reflect the soil fertility, the land production capacity and the degree of soil degradation (Cenetal., 2011). Generally, standard methods require a long time and are expensive. Meanwhile, it will cause soil pollution, during those analyses. These shortcomings limit the application of standard methods. Nearinfrared reflectance spectroscopy (NIRS) offers a rapid and low-cost analysis of nutrient composition. With the developments of new equipment and efficient models, NIRS has been extensively used for scientific researches and industrial applications, such as agriculture (Bellon-Maurel and McBratney, 2011; Keady and Hanrahan, 2015; Teixeiraet al., 2015; Viegaset al., 2016; Shuet al., 2009), the petrochemical industry (Liuet al., 2008; Teyeet al., 2015) and scientific researches (Brakeret al., 1998; Castro-Gonzalezet al., 2005; Powellet al., 2015; Bollinget al., 2015; Nakagawaet al., 2015). NIRS has played an important role in edaphology and is a useful tool in soil analysis (Chaudharyet al., 2012; Kolomietset al., 2004; Kuanget al., 2011; Summerset al., 2011; Vohland and Emmerling, 2011). Many studies have investigated the soil moisture (Chang and Laird, 2002; Malleyet al., 1999; Morraet al., 1991), as well as SOM, the total carbon and the soil organic carbon (SOC) and TN (Summerset al., 2011; Barthèset al., 2008; Confalonieriet al., 2001; Coûteauxet al., 2003; Cozzolino and Morón, 2006; Marchãoet al., 2009; Stevenset al., 2008) by this approach.
Bowers and Hanks (1971) studied the reflection of radiant energy from the soil. Al-Abbaset al. (1972) developed statistical models to estimate the quantity of SOM and clay in the surface soil. Dalal and Henry (1986) used near-infrared diffuse reflectance spectrophotometry within the wavelength range of 1 100-2 500 mm to predict the moisture, SOC and TN of air-dried soil. Wagneret al. (2001) used NIRS to successfully predict SOM and obtained a correlation coefficient ofR2=0.91. Based on NIRS, Chodaket al. (2002) predicted SOC with high accuracy, meanwhile, they found a regression coefficient between the prediction and measured values ranging from 0.9 to 1.1, withR2≥0.9.
Many studies have used NIRS to predict TN. Mooraet al. (1991), Changet al. (2001) and Chodaket al. (2002) concluded that NIRS can be used to predict N concentrations in the soil. Ben-Dor and Banin (1995) and Malleyet al. (1999) successfully used NIRS to predict the soil mineral contents and declared that this method can rapidly analyze elements in dry soils. Furthermore, many studies have used the partial least square (PLS) method to investigate soil parameters (Liet al., 2011; Kuanget al., 2011; Summerset al., 2011; Vohland and Emmerling, 2011). Focusing on aDeyeuxia angustifoliameadow steppe in the Sanjiang Plain, NIRS and PLS were used to study SOM, TN and TP. An efficient method to monitor the characteristics of the grassland soil in real-time was provided. Databases and scientific guidance were provided for the reasonable use of meadow resources in the Sanjiang Plain.
Materials and Methods
Experimental sites and soil samples
The experimental zone is located between 45°47′8″-46°35′55″ (north latitude) and 131°14′16″-133°29′48″ (east longitude) in Baoqing County of HeilongjiangDeyeuxia angustifoliameadow steppe of the Sanjiang Plain, China. The soil is a typical meadow marsh soil. At all the sample locations, a total of 20 cores (2.5-cm diam.) was collected randomly within a 1-m radius of the geo-referenced location and composited. A total of 540 soil samples was collected from the three different depths. The 180 samples were collected from every depth, 120 samples in the calibration dataset and 60 samples in the estimation dataset. The purpose was to increase the spatial and temporal variability of building samples and improve the robustness of modeling.
The soil samples were collected from 0 to 10, 10 to 20 and 20 to 30 cm, from 2015 to 2017. To eliminate the influence of soil particle sizes on TN and SOM, samples of the same size from three to four soil cores were collected (2.5-cm diam.) (Mouazenet al., 2006; Upadhyayaet al., 2001). All of the samples were randomly taken from the experimental plot. The composite samples were carefully mixed on site, air dried, and gently crumbled and screened by a 2-mm sieve.
Soil analysis
SOM was measured using the potassium dichromate volumetric method with external heating and TN was measured using a FOSS KjeltecTM2300 automatic azotometer (Anet al., 2012). TP was measured using the molybdenum-antimony anti-spectrophotometric method.
Spectral acquisition and pre-treatment
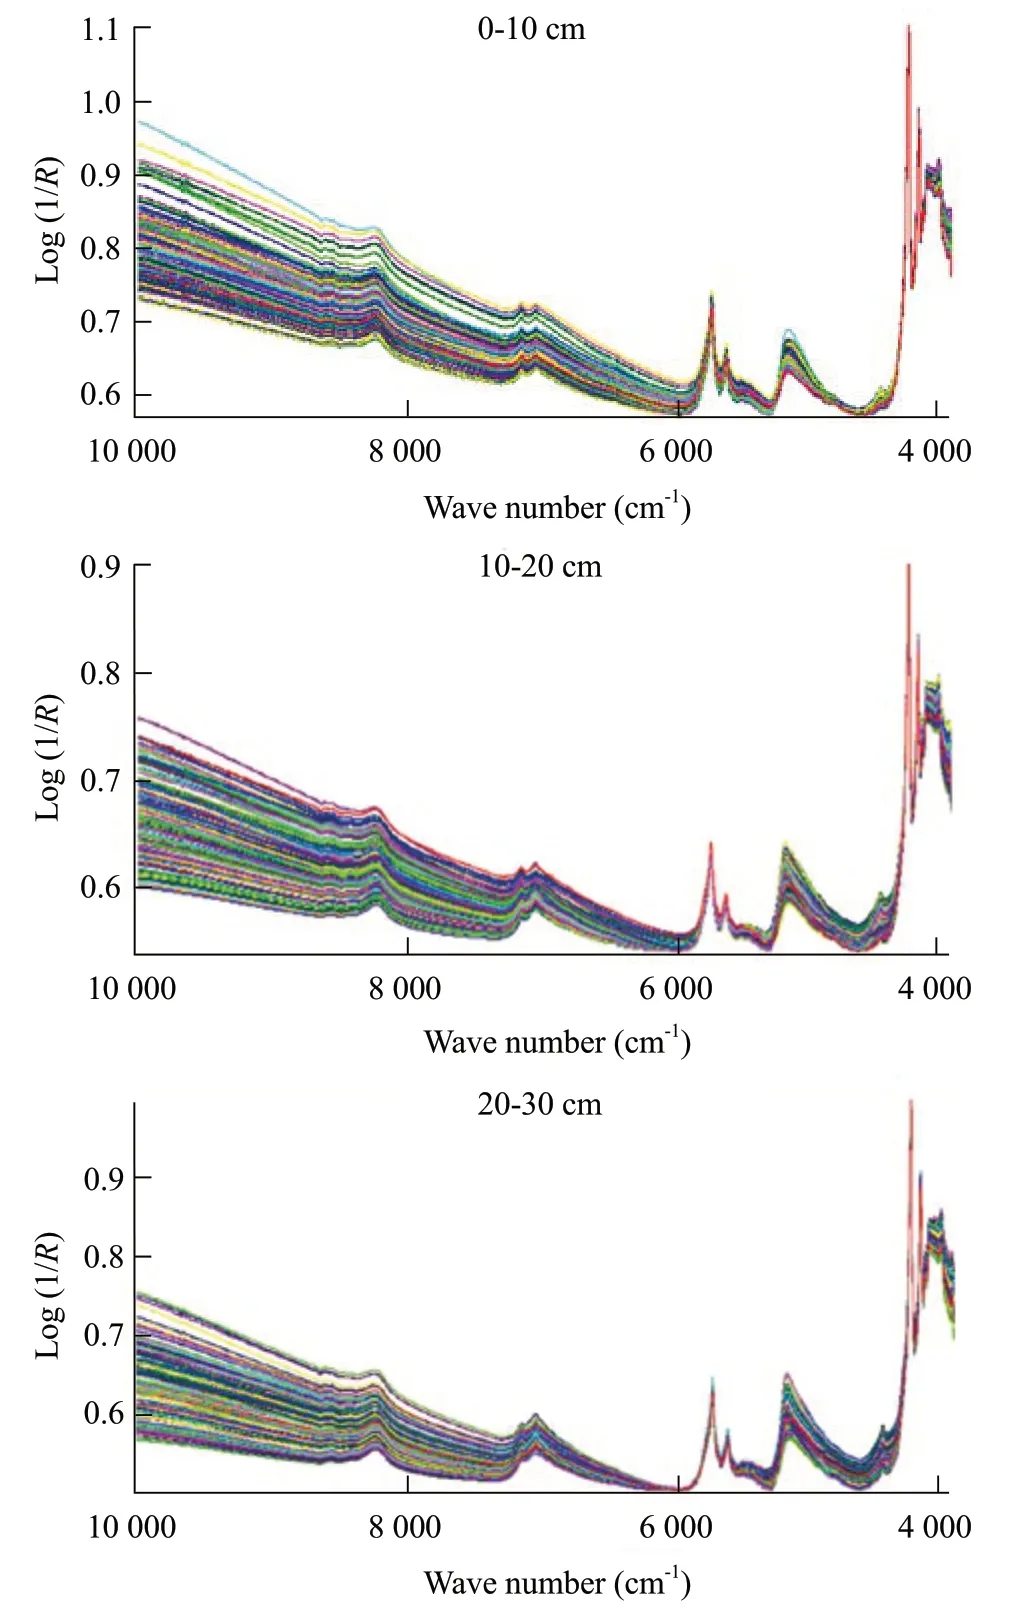
The spectra used in this work were collected using a Fourier transform infrared spectrometer (ANTARIS II, Thermo Nicolet) in Northeast Agricultural University. The operator was preheated for 60 min before scanning. The absorbance [log (1/R), whereRwas the reflectance] of the soil samples was recorded in the visible and near-infrared regions from 4 000 to 10 000 cm-1using a NIRS System 6 500 monochromator (Foss NIR Systems, Inc., Silver Spring, MD) with a cup (one-quarter cup, rectangular) containing approximately 25 mL of soil samples. Each spectrum was the mean of 16 co-added scans to obtain possible operator errors and improve calibration equations (Nduwamunguet al., 2009; Nieet al., 2009). Meanwhile, the resolution was set at 8 cm-1(Fig. 1).

Fig. 1 Near-infrared spectra of soil
Calibration, cross-validation and validation
For every depth range, 180 samples were divided into two sets at a ratio of 2 : 1, i.e., one set contained 120 samples was used to construct the model, while the other set contained 60 samples was collected for validation.
Multiple signal correction (to eliminate interference from the size and homogeneity) and Norris derivative and Savitzky-Golay filters (to smooth the spectra) were used to improve the model, which was designed by using TQ Analyst 8.3. Meanwhile, the first derivative and the second derivative were used to improve the spectra.
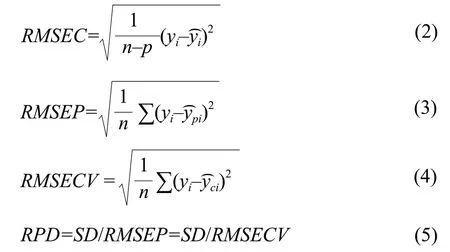
PLS algorithm was selected as the modeling algorithm. PLS was a powerful data-modeling tool that captured and representd the complex correlations between input and output. PLS could avoid human errors on the model. Besides coefficient of determination (R2), root mean square error of calibration (RMSEC), root mean square error of prediction (RMSEP), root mean standard error of cross calidation, (RMSECV) and residual prediction deviation (RPD) were also used to evaluate the forecasting models. Eqs. (1)-(5) presented their calculation formulas.


Where,iwas the serial number soil sample;yiwas the actual value ofisample;was the content measured by NIRS;was the average value of the actual value;nwas the number of soil samples;pwas the number of principal components in the calibration group;was the soil content predicted from the validation group;was the soil content predicted from the calibration group;SDwas the standard deviation of the soil content values measured.
The calibration model with a calibration sample set was established using TQ Analyst 8.3, performed cross-validation, and then the validation samples were used for external verification. Prediction precision, i.e., the closeness to the reference (Williams, 2001), was assessed using the validation statistics proposed by Nduwamunguet al. (2009): (i)R2and (ii) residual prediction deviation (RPD).RPDwas calculated by dividing the standard deviation (SD) of the reference data by the standard error of prediction (SEP) corrected for bias [SEP(C)] (Nieet al., 2009; Nduwamunguet al., 2009). Meanwhile,RPDin the cross-validation set was calculated usingSDof the reference data and the standard error of cross-validation (SECV). Here, the very reliable (VR) models were those withR2>0.9 andRPD>3; reliable (R) models were 0.7≤R2≤0.9 and 1.75≤RPD≤3; and less reliable (LR) models wereR2<0.7 andRPD<1.75 (Nduwamunguet al., 2009; St Luceet al., 2012).
Results
Reference data
The statistical distributions of SOM, TN and TP are shown in Table 1. The ranges of SOM, TN and TP in the soils covered large intervals. As the soil depth increased, the contents of each component decreased.

Table 1 SOM, TN and TP of soil samples
Model and its optimization
This model was optimized by selecting suitable wavelength ranges and factors. The details for SOM, TN and TP are listed in Table 2.
Calibration statistics
The optimization results for the calibration of SOM, TN and TP are shown in Table 3.R2of SOM and TN for the three depths was >0.90, indicating that the chemical analysis was almost accurate and had a better prediction in the near-infrared calibration model. Meanwhile,RPDof SOM, TN and TP was >2.5, indicating that the chemical analysis was accurate. Thus, considering the above results, NIRS was efficient for predicting SOM, TN and TP.

Table 2 Optimal conditions for establishing NIRS prediction model

Table 3 Optimization results for calibration of model predicting SOM, TN and TP
Prediction of SOM, TN and TP
Using the correction model, the effect of inspection was measured using an external authentication method for the pre-built model. Table 4 showed the correction contents of SOM, TN and TP of the 60 samples. In Table 4, focusing on SOM, TN and TP, aTtest (P>0.05) of the values predicted by NIRS and the measured values showed that the differences were not significant.

Table 4 Evaluation of calibration models using validation sets
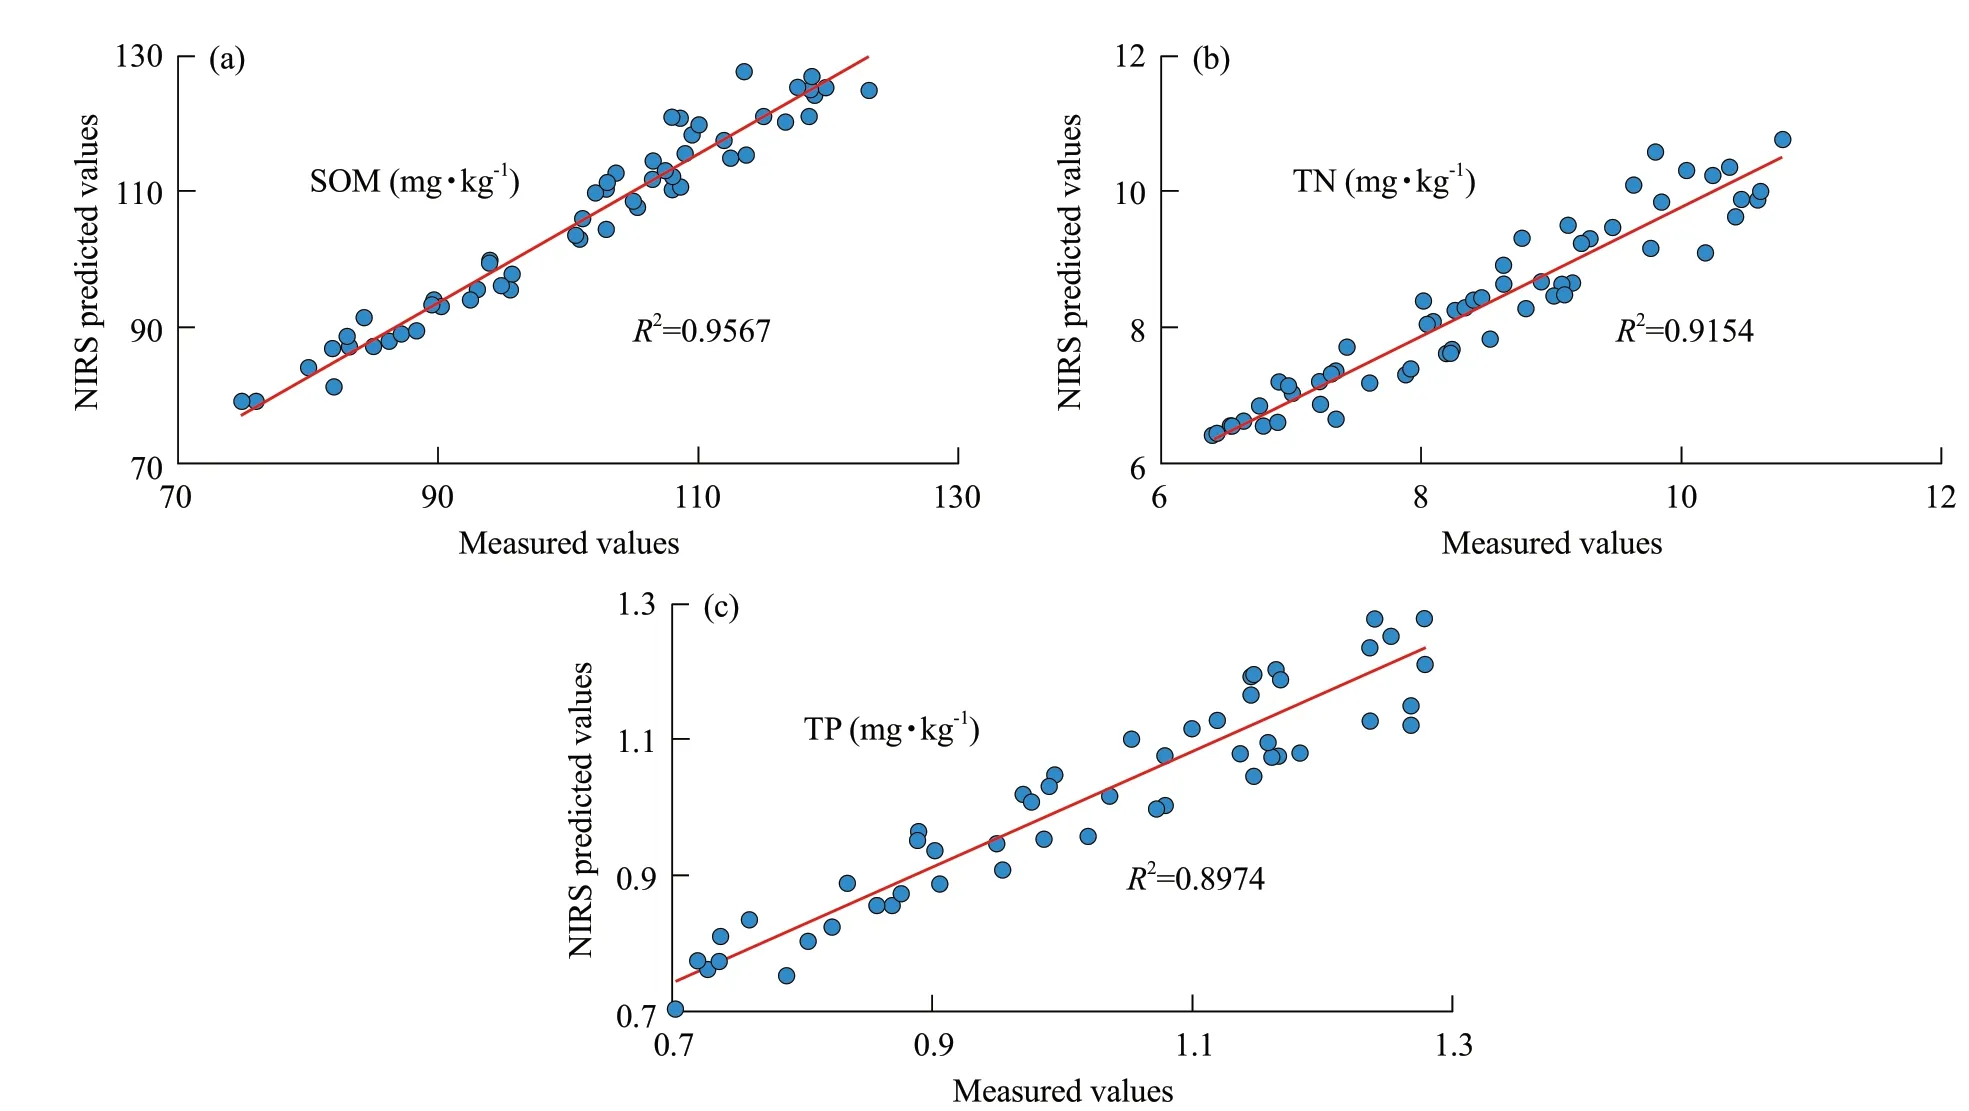
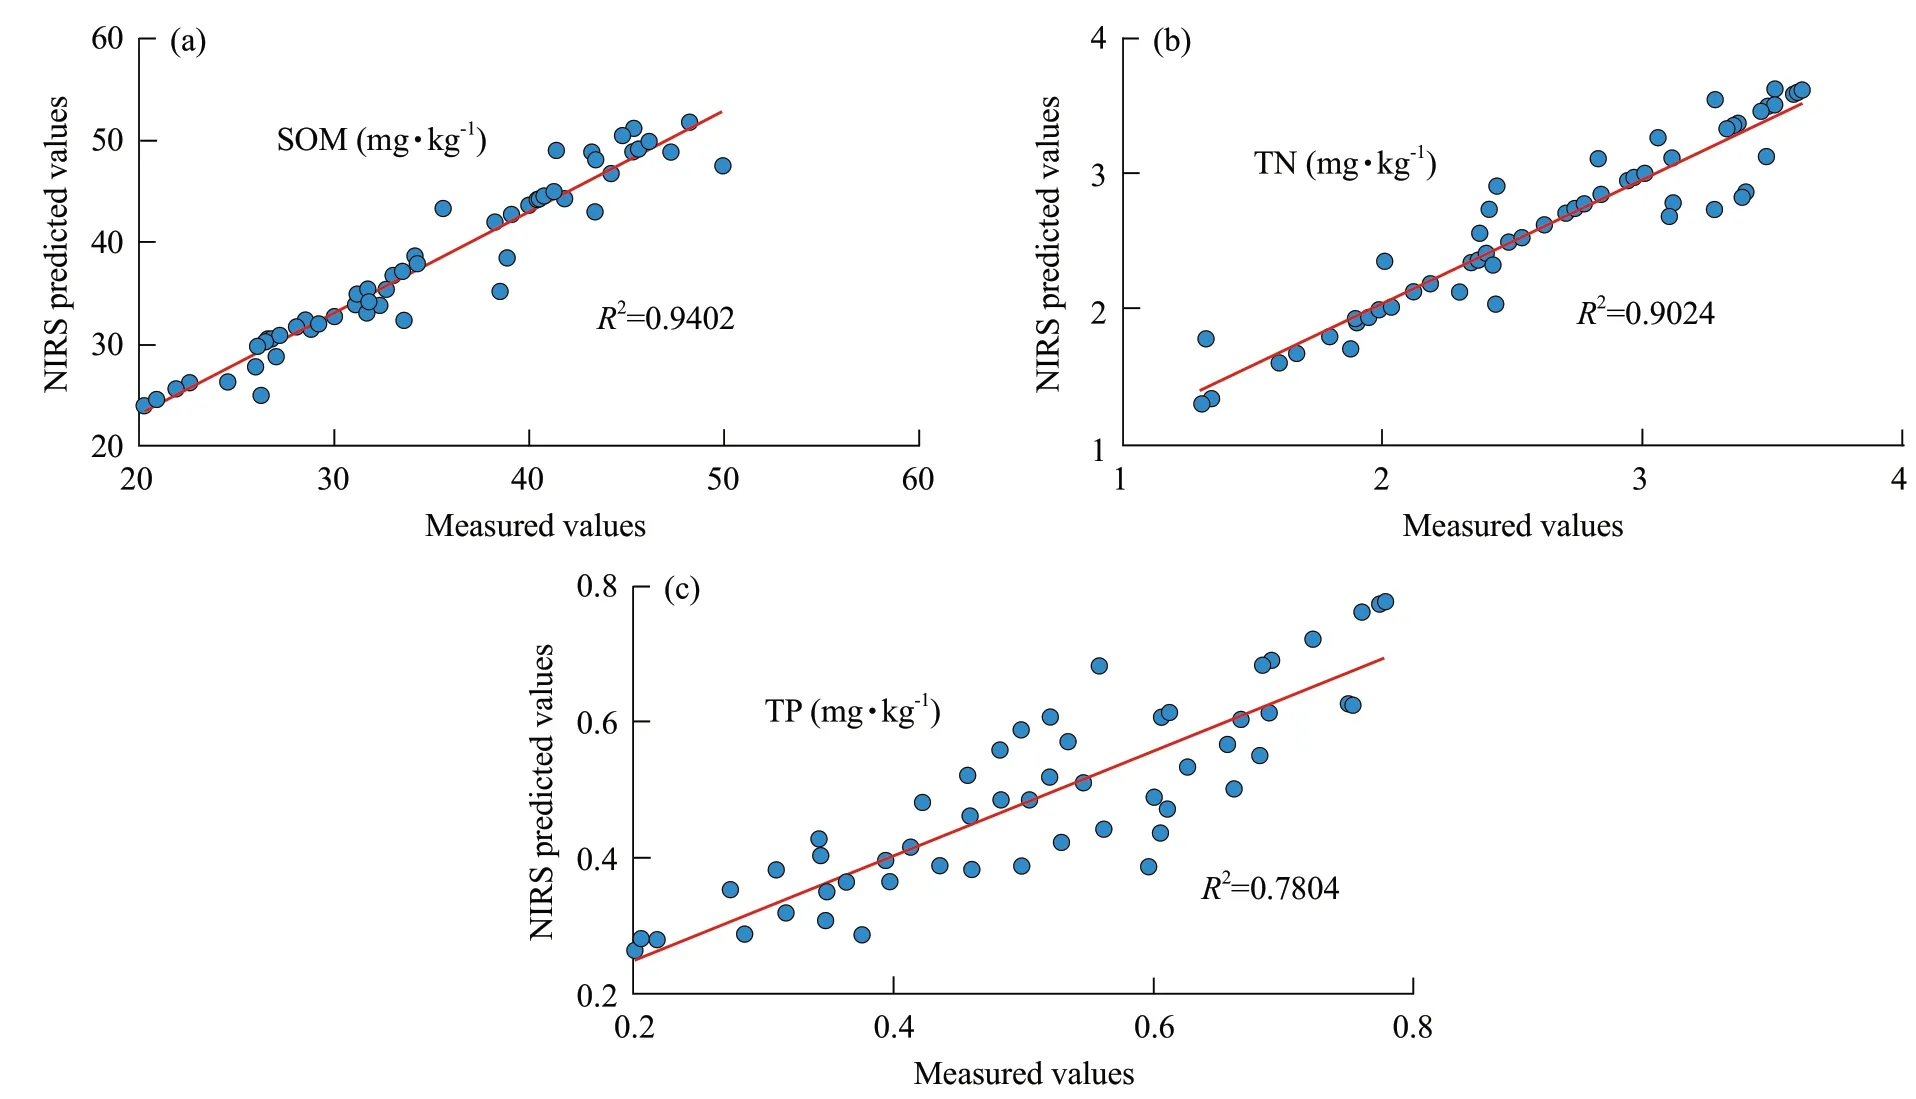
Table 4 showed the predicted SOM, TN and TP of the 60 samples. For the samples from 0 to 10 cm,RMSEPof SOM, TN and TP was 4.74, 0.40 and 0.06, respectively. Meanwhile, Fig. 2 showedR2values of 0.9567, 0.9154 and 0.8974 for SOM, TN and TP,respectively. For the samples from 10 to 20 cm,RMSEPof SOM, TN and TP was 2.95, 0.25 and 0.06, respectively, andR2values were 0.9416, 0.9028 and 0.8624, respectively (Fig. 3). For the samples from 20 to 30 cm,RMSEPof SOM, TN and TP was 2.61, 0.22 and 0.05, respectively, andR2values were 0.9402, 0.9024 and 0.7804, respectively (Fig. 4).

Fig. 2 PLS model for samples from 0 to 10 cm of SOM, TN and TP prediction results

Fig. 3 PLS model for samples from 10 to 20 cm of SOM, TN and TP prediction results

Fig. 4 PLS model for samples from 20 to 30 cm of SOM, TN and TP prediction results
Discussion
NIRS was a cost-effective, time-saving, nondestructive and environmentally sound technique that could predict many constituents from the single spectrum of a soil sample (Coûteauxet al., 2003; Rosselet al., 2006), including P (Chodaket al., 2002; Changet al., 2001). Combined with minimal standard methods, NIRS provided a good alternative to routine soil analysis (Nduwamunguet al., 2009) with an at least 80% reduction in chemical use and laboratory costs.
SOM contained a variety of organic functional groups (carboxyl, hydroxyl and amine), therefore, it had identifiable characteristic peaks in the near-infrared region. Wagneret al. (2001) (wavelength of 3 850-10 000 cm-1) successfully predicted SOM (R2=0.91). Successful NIRS predictions had been reported for SOM, soil texture (Coûteauxet al., 2003; Ben-Dor and Banin, 1995; Rosselet al., 2006) and other soil properties, including pH, cation exchange capacity (CEC), N, P, K, Al, Fe, Ca and Zn (Changet al., 2001; Nduwamunguet al., 2009). Future studies should incorporate larger sample sizes and more diverse soils.
The correlation coefficientsR2,RMSEPandRPDwere used to evaluate the model.R2of SOM, TN and TP with the three depths was more than 0.7, all withSD/RMSEP>2.50. Hence, NIRS could be used to predict SOM, TN and TP with different depths. These results demonstrated that NIRS based on the firstorder differentiation and PLS could efficiently predict SOM, TN and TP from different soil depths. NIRS spectroscopy was used to predict the concentrations of SOM, TN and TP in meadow soils, which could reduce the costs for rapid determination of soil nutrients. It also provided soil nutrient spectroscopy of the Sanjiang Plain soils, which would support the setup of the Chinese large soil database.
Literatures suggested that these calibrations could be further improved using more samples for calibration and fewer for validation. This three-year project highlighted the need to include spatial and temporal diversity within the dataset, if calibrations were used beyond the reference sample collection sites. Future studies should also investigate the ability to predict the nutritional value ofDeyeuxia angustifoliaby NIRS. The inexpensive and rapid prediction of the nutritional value of pastures helped producers to optimize feed purchasing decisions, grazing management and animal growth rates.
Conclusions
In this paper, focusing on NIRS for SOM, TN and TP, samples from different soil depths were collected and PLS was used to construct a calibration model for aDeyeuxia angustifoliameadow in the Sanjiang Plain. The correspondingR2of SOM and TN with the three different soil depths was >0.90, withSD/RMSEP>2.80. These results demonstrated that this method could be efficiently used to predict SOM and TN. Meanwhile,R2of TP was 0.8974 (0-10 cm), 0.8624 (10-20 cm) and 0.7804 (20-30 cm), respectively. These results suggested that as the soil depth increased, TP andR2decreased. However,SD/RMSEPwas >2.5, which meant that NIRS successfully predicted TP with different depths.
Acknowledgments
The authors thank the Animal Husbandry and Veterinary Bureau of Heilongjiang Baoqing for assistance in the field. Chemical analyses and NIRS were conducted at the Laboratory of Northeast Animal Nutrition and Feed Science Observation Experimental Station of the Ministry of Agriculture of China Key Laboratory of Forage Germplasm Resources and the Breeding of Heilongjiang Province.
 Journal of Northeast Agricultural University(English Edition)2021年4期
- Journal of Northeast Agricultural University(English Edition)的其它文章
- Journal of Northeast Agricultural University (English Edition)
- Journal of Northeast Agricultural University(English Edition)Total Contents of Volume 28(2021)
- Identification of Typical Rice Diseases Based on Interleaved Attention Neural Network
- Effect of Grain Particle Size on Quality of Multi-grain Chips Under Screw Extrusion Processing
- Isolation, Molecular and Phylogenetic Analysis of Porcine Encephalomyocarditis Virus Strain HLJ in China
- Screening of Feather Degrading Bacteria and Optimization of Fermentation Conditions from Poultry
