Impact of the Rainfall Intensity and Seepage on Slope Stability in Loess Plateau1
ZHANG Yu ,YANG Lixia ,HAN Bingbing and WU Yajie
1) School of Traffic and Transportation,Lanzhou Jiaotong University,Lanzhou 730070,China
2) Gansu Institute of Engineering Geology,Lanzhou 730000,China
3) Shanghai Municipal Engineering Design Institute Group Tenth Municipal Design Institute Co.,Ltd.,Lanzhou 730070,China
In recent years,with the increase of traffic construction in mountainous areas in China,road slope traffic accidents have become more and more common.In addition,natural disasters such as landslides,collapses and subgrade settlements caused by rainfall,driving load,seasonal variation and groundwater distribution are frequent.In particular,rainfall is one of the most common factors leading to slope instability(landslide).Therefore,this paper proposes the seep module based on the application software Geo-studio,and analyzes the slope soil parameters and slope stability under five types of rainfall conditions:light rain (10 mm/d),moderate rain (25 mm/d),heavy rain (50 mm/d),rainstorm(100 mm/d),and torrential rain (250 mm/d).The critical safety factor under rainfall intensity is fitted with nonlinear curve by sine function.The results show that the fitting curve of rainfall intensity and safety factor on the upper slope is excellent.The residual points are evenly distributed in the belt area of ± 0.1,and the data basically conform to the nonlinear sine model,indicating that the curve plays an essential role in slope health diagnosis.
Key words:Rainfall intensity; Seepage; Data monitoring; Stability analysis
INTRODUCTION
Rainfall is one of the most common factors causing slope instability (landslide).According to the survey data of slope landslides,80% of the landslide disasters are associated with rainfall(Huang Qiuxiang et al.,2020; Xu Chong et al.,2013).The road slope instability events induced by by traffic load,seasonal variation and groundwater distribution also occur frequently.Therefore,experts and scholars have conducted numerous investigations in a global scale.The influence of rainfall on slope stability is firstly studied under saturated soil condition.Scholar Pearce proposed a “bathtub model”for seepage situation of saturated soil (Xiao Yao,2016; Zhifang Zhou et al,2014; Lan Min et al,2013).This model studies the effect of rainfall infiltrating into the slope on the stability of the pore pressure of the soil in the slope and the internal displacement and deformation of the soil.After Pearce,Wang and Yoichi successively designed the “flume experiment”applied to landslide (An Shuhong,2003).Through this experiment,we are able to analyze the relationship between the pore water pressure inside the soil,the deformation of slope soil and rainfall infiltration.The research of unsaturated soil seepage is based on Darcy’s law(Hayat T.et al,2018).After the theory of unsaturated soil seepage appeared in succession,worldwide scholars began to delve into the influence of rainfall on slope stability.Giovanna et al used hydrological model to study the relationship between landslide and rainfall(Giovanna et al,2011).A large number of scholars have also studied the influence of seasonal variation on slope stability,with Russia,North America and Europe as the main representatives,laying the foundation for the follow-up study of freeze-thaw soil theory.For example,the relationship between the amount of water content and the water pressure of the rock mass under freezing and thawing conditions has been analyzed.The main reason is that the volume of water increases after freezing,which increases the stress in the rock cracks,resulting in instability failure.
Due to the late start of the transportation development in China,comprehensive domestic research on the impact of slope stability is relatively late.Beginning from the 1950s,the earliest method to study slope stability is the limit equilibrium analysis method(Yang Mingrui et al,2017),In 1965,Wang Fulai,a Chinese scholar,improved the Jabu method (Ma Yuanshun,2010),which,however,was only limited to the study under the influence of a single factor.In the 1980s,the theory of slope stability became more mature(Liu Xinxin,2013) with the development of more advanced methods,such as the emergence of the finite element analysis method (Sun Yanjie,2018).In the follow-up investigations,most scholars in China have studied the influence of driving load on slope stability.Among them,Cao Yuanwen and several other scholars studied the dynamic load effect of vehicles on the road surface under the condition of leveling the road surface,and provided significant information for the subsequent research on the influence of vehicle load on slope stability (Liu Xinxin,2013; Sun Yanjie,2018; Che Han et al,2016; Ni Wujie,2010; Shi Zhenming,2016; Fu Hongyuan et al,2012; Wang Yimin,2004).The research on the influence of seasonal freezing and thawing on slope stability is mainly concentrated in the northeast part of China.Related research also includes water field and temperature field proposed by An Weidong (Liu Xinxin,2013; Chen Tao,2006; Gao Zezheng,2019).In summary,the the diagnosis design for slope stability in China started late.Existing designs are simple,and various influencing factors cannot be considered comprehensively.Zhou Jinxing et aldivided landslides into 9 main types based on different indicators (Jiang Xingwang et al,2002).The temporal and spatial distribution characteristics,influencing factors and mechanism of loess landslides are analyzed.It is pointed out that the time and space distribution of landslides are closely related to topography and landform conditions,earthquakes and rainfall.Wang Tao et al took Yanan area as an example to study the impact of continuous heavy rainfall on geological landslides in the loess area (Wang Haojie et al.,2020).Zhang Jun et al investigated the dynamic characteristics and dynamic mechanism of the heavy rain-type debris flow in the loess area and its formation reasons,and subsquently concluded that the loess area and other areas have different movement and disaster modes.Thus,appropriate prevention and control plans should be formulated (Hou Yunlong et al.,2019).Wang Haojie et al.took the Changhe landslide in Gansu Province as an example,studied the deformation and failure characteristics of rainfall-induced landslides in the loess area,and conducted a preliminary assessment of possible inducing factors and failure mechanisms.This is of great significance for the early identification and risk prevention of landslides in the northwestern loess area in China (Euripedes et al.,2013).Selecting an unsaturated loess landslide at Jiuzhoutai in Lanzhou and a landslide induced by Heifangtai irrigation as the test area,Zhang Fanyu conducted a large number of experiments and analyzed the shear behavior of loess in the drained and undrained circular shear tests,revealing the reasons for the changes of resistance and shear strength parameters.Finally,he used these results to explain the mechanism of the sudden spontaneous instability of the unsaturated loess landslides and the seasonal resurrection of the loess landslides induced by irrigation.(Liu Yanhang,2017).Scholars have conducted detailed studies on the causes of landslides in loess areas in a global scale,but there are few analyses of safety factors for landslides under the conditions of short-term rapid rainfall and different rainfall intensity levels.
1 BACKGROUND
Yongjing County in Lanzhou City is at the intersection of the Qinghai-Tibet Plateau and the Loess Plateau.According to survey statistics,more than 120 landslides have occurred in the Bapanxia reservoir area.In addition,frequent landslides also occur in Jiaojiayaya in Heifangtai.These landslides have made great impact on people’s lives and safety,as well as substantial economic losses.Selecting Laolanggou as the research object,this paper studies the soil parameters and slope stability under five rainfall levels,providing valuable suggestions for the prevention and control of landslides in the Laolanggou region.
Lanzhou City is located in the Loess Plateau region of Northwest China.It is the political,cultural,economic,scientific and educational center of the Gansu Province.Meanwhile,it is also situated on the northeastern edge of the Qinghai-Tibet Plateau and the northwestern part of the Loess Plateau.The Yellow River passes through the city center from west to east and has a typical topography of “two mountains and one valley”.The study area Laolanggou is located on the south side of Lanzhou City,east of Gaolan Mountain and north of National Village,Gaolanshan Township,Chengguan District.The geographic coordinates are 103°50′30″E-103°51′6″E and 36°0′19″N-36°1′31″N,as shown in Fig.1.(Wu Tingyao et al.,2020).The study area is 950 m away from Lanzhou Railway Station.Numerous roads are constructed in front of a local ditch and on the mountain sides.In addition,several narrow roads on the slope make the local traffic more convenient..Public facilities near the study area include Nanshan Old Garden and Lanshan Park,and factories include Lanzhou Yuandong Auto Repair Factory,Gansu Water Conservancy Mechanization Engineering Company,and Euro-Asia Printing Co.,Ltd.
The Lanzhou area belongs to the hilly-gully loess region,in which the local terrain is complex and fragmented.The density of valleys is very high.The slope terrain occupies most of the area,and the slope range is generally 10°-35°.Laolanggou has a typical loess gully area landform,the valley is north-south,about 2.3 km long in the north-south direction,about 0.9 km wide from east to west,and with an area of about 0.84 km2.On the west side of the ditch,there are two branch ditches,both of which are northeastsouthwest,with lengths of 0.5 km and 0.4 km,respectively.The entire study area is high in the south and low in the north.The elevation range is 1 720-2 090 m with a huge elevation difference,resulting in a 31.7° average slope angle of the study area and even 58°at the mouth of the ditch.Steep slopes are an important cause of landslides.(Xin Xing,2018).At the same time,the study area has less vegetation coverage.Although the local government has planted a large number of pine trees to reduce landslide disasters and soil erosion,the loess area itself is ecologically fragile.The occurrence of earthquakes and heavy rains often leads to large-scale landslides,forming unique landslide landforms.
The study area is located in a semi-arid climate region in the mid-latitude zone.The spring and autumn seasons are dry and windy.The average annual wind speed is 0.94 m/s and the dominated direction is northeast.As shown in Fig.2,the annual average temperature in the study area is 9°C,the average temperature in January is -5°C,and the average temperature in July is 23°C,which are the lowest and highest months of the year.The annual sunshine duration in the region of 2 100-2 700 hr.The annual rainfall data in Lanzhou are shown in Fig.3,in which the average rainfall from 1951 to 2015 is 311.65 mm.(Sun Yanjie,2018).Rainfalls frequently occur from July to September each year.The concentrated rainfalls have caused a sudden increase in landslide events during this period.
Field surveys and related data show that the Laolanggou stratum is relatively simple.The loess layer is widely distributed and constitutes the main body of the study area.The tertiary mudstone and Wuquan conglomerate in the lower part are only exposed at the mouth of the ditch.The overlying stratum is Holocene loess-like soil and Malan loess(Q3),which are light grayish yellow,with relatively uniform grains.These loess layers are dominated by loose silt in block shape,and they are characterized by significant macropores and vertical joints,with a maximum thickness of 44 m.The underlying Lishi loess (Q2) and Wucheng loess (Q1) are yellow and reddish in color,with uniform texture,compactness,and solidity,with well-developed joints.The thickness generally reaches more than 100 m,and locally reaches 250 m.The mudstone exposed at the mouth of the study area has a dip angle of 21°.(Jiang Xingwang et al.,2002)
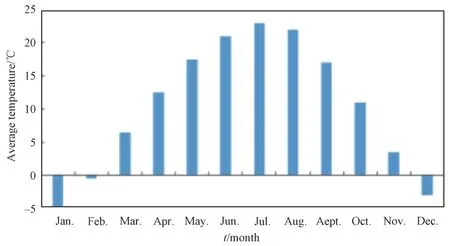
Figure 2 Monthly average temperature in Lanzhou
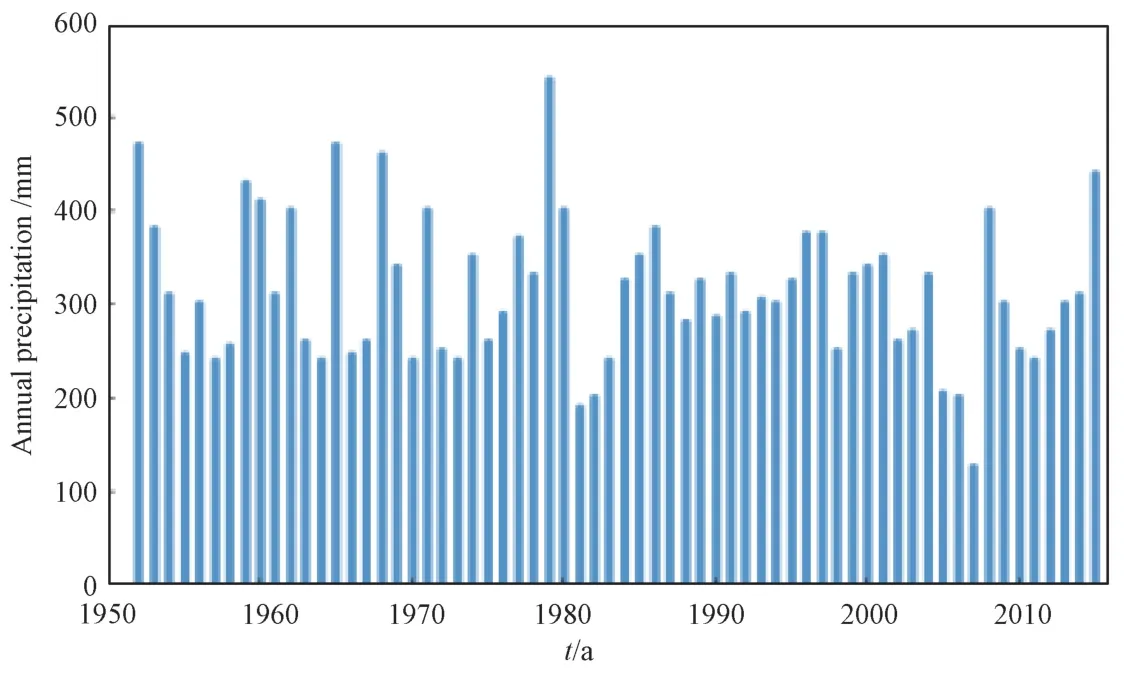
Figure 3 Annual precipitation in Lanzhou from 1951 to 2015
2 DATA AND METHODS
2.1 Model Establishment
Aiming at understanding the geological structure of Laolanggou,a slope model with a surface height of 25 m and a width of 40 m is selected to build a slope model.Thee type of subgrade on the slope is half-fill and half-cut subgrade,mainly composed of three types of soils:the top layer is silty clay,the middle layer and the lower layer are composed of silt and sand respectively.The specific structure distribution is shown in Fig.4(a).The SEEP module in Geo-studio is used to build a model of this slope as shown in Fig.4(b):

Figure 4 CAD and model of the slope
2.2 Parameter Selection
After field sampling and indoor physical parameter tests,as well as consulting a large amount of data for comparison (Hou Yunlong et al.;2019; Do Amaral Vargas E et al.,2013; Liu Yanhang,2017; Wu Tingyao et al.,2020; Liu Zhenhua et al.,2017; Yang Yongtao et al.,2020),the soil parameters are selected according to the specific parameters of the actual project as shown in Table 1:

Table 1 Value of soil parameters
The hydraulic conductivity function and volumetric water content function of various types of soils are obtained by the software Geo-studio combined with the estimation and analysis of soil parameters.The specific regression analysis function is shown in Fig.5:
2.3 Classification of Rainfall Intensity
The division of rainfall intensity interval is based on the division of rainfall intensity levels in The rainfall intensity is divided into 6 levels,namely light rain (rainfall less than 10 mm within 24 h),moderate rain (rainfall within 24 h between 10-25 mm),heavy rain(rainfall within 24 h between 25-50 mm),rainstorm (the rainfall is between 50-100 mm in 24 h),torrential rain (the rainfall is between 100-250 mm in 24 h),and extremely heavy rain (the rainfall exceeds 250 mm in 24 h).We select the maximum critical value of each rainfall level (10 mm/d,25 mm/d,50 mm/d,100 mm/d,and 250 mm/d) for calculation and analysis.The corresponding value of the critical value of each rainfall level is shown in Table 2.In order to obtain the unity of analysis and comparison,the duration of each rainfall intensity is set as 0.1 d,which is equivalent to 144 min.

Table 2 Corresponding numerical table of rainfall level
3 RESULTS AND ANALYSIS
3.1 Light Rain Seepage Analysis
The SEEP module in Geo-studio is used to analyze the rainfall and seepage under different rainfall conditions,and the simulation of each rainfall intensity is completed using the boundary conditions of the SEEP module.
(1)Analysis of slope soil parameters under 10 mm/d rainfall;
Using the SEEP module to analyze the 10 mm/d rainfall amount,it is possible to obtain the changing degree of the total water head,pore water pressure and pressure head in the soil during the rainfall period,as shown in the following Fig.6:
From the comparison of Fig.6(a) and Fig.6(d),it can be seen that the total water head of the slope body changes significantly in a short period of time under 10mm/d rainfall.As the upper part of the soil is affected by rainfall,the upper soil type changes from unsaturated soil to saturated soil in a short time.Furthermore,due to soil penetration,the total water head gradually decreases from top to bottom,but the total water head of the lower soil body is higher than the original state of soil body.Because there is a 2 m high water flow at the bottom of the slope,the total water head pressure direction decreases in the original state.Due to seepage,the total head directly descends towards the bottom water flow.Through the comparative analysis of Fig.6(b) and Fig.6(e),it can be seen that the pore water pressure at the top of the slope under the 10 mm/d rainfall condition is higher than that under the original condition,and the direction is pointing to the water flow direction at the bottom of the slope.In addition,the pore water pressure distribution on the upper part is not balanced,unlike the homogeneous distribution in the original state.
Through the comparative analysis of Fig.6 (c) and Fig.6(f),all of the upper part of the slope is characterized by negative pressure head.In the original state,the negative pressure head is relatively large,and the negative pressure head is small in the 10 mm/d rainfall state.
(1)Analysis of slope stability under 10mm/d rainfall;
The subgrade on this slope is half-filled and half-cut; thus,there are three possibilities for landslides:landslides above the subgrade,landslides below the subgrade,landslides above and below the subgrade.The landslide pattern above is analyzed in Fig.7 and Fig.8:
It can be obtained from Fig.7(a) that the minimum safety factorKof the upper part of landslide is 1.097.The critical sliding surface is shown by the white sliding surface line in the figure.Fig.8(a) is the color map of all potential sliding surfaces.The safety factorKof all other sliding surfaces is greater than 1.097.
The landslide pattern under the roadbed is shown in Fig.7(b) and Fig.8(b).Fig.7(b)indicates that the minimum safety factorKof the lower part of landslide is 0.855.Compared with the upper part,the possibility becomes greater and the potential safety hazard is greater,leading to the necessity of safety reinforcement measures.It can be seen from Fig.8(b) that the possibility of landslides in the lower part is generally higher.
The whole roadbed landslide pattern is shown in Fig.7(c) and Fig.8(c):From the Figure,the overall safety factor of the slope landslide is low,and the overall critical slip safety factor is 1.007.Therefore,the slope has potential safety hazards and reinforcement measures are required.
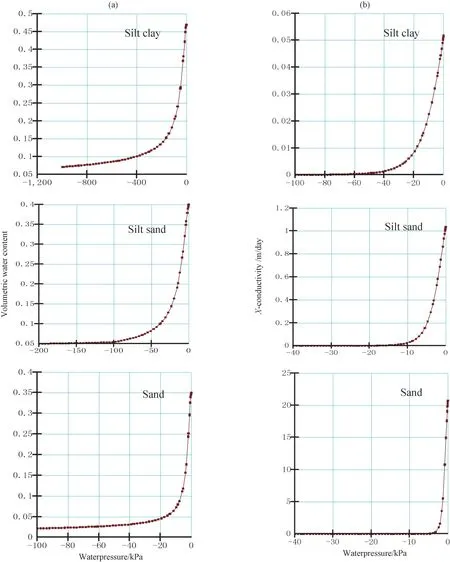
Figure 5 Hydraulic conductivity function and volumetric water content function diagram of water pressure

Figure 6 Comparison chart of total water head,pore water pressure,and pressure head under the condition of no rainfall and 10mm/d rainfall

Figure 7 Critical slip surface of the upper and lower parts and the whole slope

Figure 8 All potential slip surfaces of the upper and lower parts and the whole surface
3.2 Moderate Rain Seepage Analysis
(1) Analysis of slope soil parameters under the condition of 25 mm/d rainfall;
The influence of moderate rain 25 mm on soil parameters is similar to that under light rain due to the fact that the difference between pore water pressure and pressure head in the slope is small.The results of the total water head and pore water pressure are shown in Fig.9(a) and Fig.9(b).

Figure 9 Total water head and pore water pressure under 25mm/d rainfall
(2)Analysis of slope stability under 25 mm/d rainfall:
The change of total water head and pore water pressure in the soil under the condition of 25 mm/d rainfall is slightly larger than that under the condition of 10 mm/d rainfall.The influence on the safety factor of the slope is shown in the Fig.10.
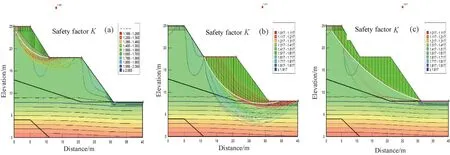
Figure 10 All potential slip surfaces of the upper and lower parts and the whole one
From the above figure,it can be seen that the minimum critical safety factorKof the upper slippage under 25 mm/d rainfall condition is 1.366,the minimum critical safety factorKof lower slippage is 1.017,and the minimum critical safety factorKof the whole slip (Fig.10(c)) is 1.017.
3.3 Analysis of Heavy Rain Seepage
(1) Analysis of slope soil parameters under the condition of 50 mm/d rainfall.
Through software simulation and calculation,it is found that the pore water pressure of the slope body and the total water head varies greatly under the condition of heavy rain (50 mm/d),especially the bottom of the slope.The total water head diagram (Fig.11(a)) and pore water pressure diagram (Fig.11(b)) under heavy rain intensity are shown as follows:

Figure 11 Total head and pore water pressure under 50 mm/d rainfall
(2)Slope stability analysis under 50 mm/d rainfall.
Due to the special structure of the slope,it is found that the stability of the slope has deteriorated under heavy rain conditions,especially the overall stability of the slope which has dropped significantly.The specific stability changes of various types of landslides are shown in Fig.12:

Figure 12 All potential slip surfaces of the upper and lower parts and the overall surface
Under heavy rain (50 mm/d),the critical safety valueKof the upper part of the slope is 1.038(Fig.12(a)),the lower critical safety valueKis 0.845(Fig.12(b)),and the minimum critical safety factorKof the overall sliding (Fig.12 (c)) is 0.688.In general,the stability of the slope under the heavy rain condition decreases,and the stability of the lower part and the overall slippage does not meet the requirements,indicating that safety reinforcement is required.
3.4 Analysis of Rainstorm Seepage
(1) Analysis of slope soil parameters under 100 mm/d rainfall conditions.
Under rainstorm conditions,the total water head and pore water pressure in the slope body changes greatly.The pore water pressure in the surface layeris no longer negative,and the positive pore water pressure of the surface layer is larger than 20 kPa.The rainfall intensity is greater than the soil permeability coefficient;thus,in a short period of time,the surface of the soil first reaches the state of saturation.As the depth increases,the pore water pressure of the soil decreases in a short period of time,and the total water head diagram still conforms to the general law.As the depth increases further,the total water head decreases.The specific changes are shown in Fig.13(a) and Fig.13(b).

Figure 13 Total water and pore water pressure under 100 mm/d rainfall
(2) Analysis of slope stability under 100 mm/d rainfall conditions.
After calculation and analysis,it is found that the high-intensity rainfall under the rainstorm condition destablizes the slope body,and the stability of the upper part,lower part or overall landslide of the mountain slope body is seriously insufficient to meet the requirements.The calculation and analysis results are shown in Fig.14.
From the above figure,it can be seen that the critical safety value of the upper landslide under the rainstorm condition (100 mm/d) is 0.887 (Fig.14(a)),the critical safety value of the lower landslide is 0.660(Fig.14(b)),and the minimum critical safety factorKof the overall slip (Fig.14(c)) is 0.599.Therefore,for safety reasons,the slope must be reinforced.

Figure 14 All potential slip surfaces of the upper and lower parts and the whole surface
3.5 Seepage Analysis of Heavy Rain
(1) Analysis of slope soil parameters under 250 mm/d rainfall.
The torrential rain with high rainfall intensity has changed the boundary conditions of the Simulation software,indicating that the boundary slope is also affected by the rainfall intensity perpendicular to the fracture surface.Under this condition,the total water head and pore water pressure in the slope body should be the highest among all rainfall intensities.In fact,surface runoff occurs and the water head increases under high rainfall intensity.Fig.15(a) and Fig.15(b) below exhibit the total head and pore water pressure under heavy rain (250 mm/d) seepage.
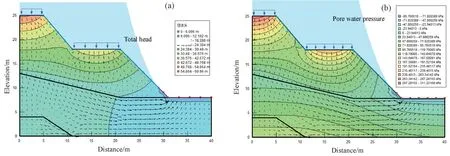
Figure 15 Total head and pore water pressure under 250 mm/d rainfall
(2)Slope stability analysis under 250 mm/d rainfall.
The slope safety factor does not meet the requirements under the heavy rain condition and tends to be even higher.The stability safety factor of the upper part of the slope,the lower part and the overall landslide are all less than 500 mm/d,and the lower part and the overall stability are the lowest,as detailed in Fig.16.

Figure 16 All potential slip surfaces of the upper and lower parts and the whole surface
In Fig.16(a) and Fig.16(b),the upper critical slip coefficient of the slope is 0.405,the lower critical slip coefficient is 0.297,and the overall critical (Fig.16(c)) slip coefficient is 0.298.The slope stability does not meet the requirements and needs to be reinforced.
4 DISCUSSION
4.1 Rainfall Seepage Process Analysis
There are two main factors affecting rainfall infiltration,one is the permeability coefficient of the soil,and the other is the rainfall intensity.In the natural,soil which is not influenced by rainfall (Fig.17),the general distribution law indicates that the uppermost layer is the saturated zone.The second upper layer is the transition zone,the lower layer is the wet zone,and the water content decreases from the uppermost layer to the lowermost layer.When rainfall occurs,if the intensity is less than the permeability coefficient of the upper soil body,all the rainfall will infiltrate into the soil body within a short period of time.In detail,the upper soil body gradually becomes saturated,and the water penetrates downward (Fig.18); On the other hand,if the rainfall intensity is greater than the permeability coefficient of the upper soil,it will reach the water point of the ground in a short time.In this situation,surface runoff occurs on the ground,and water that cannot be infiltrated within a short period of time will flow away on the surface (Fig.19).

Figure 17 Distribution of soil layers without rainfall
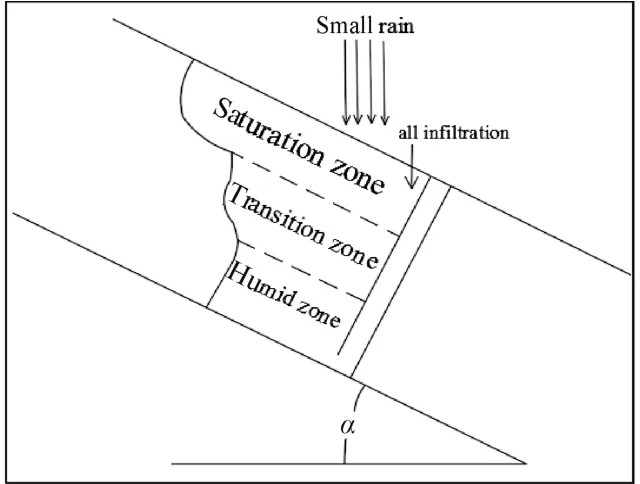
Figure 18 Distribution of soil layers under the consition of light rainfall
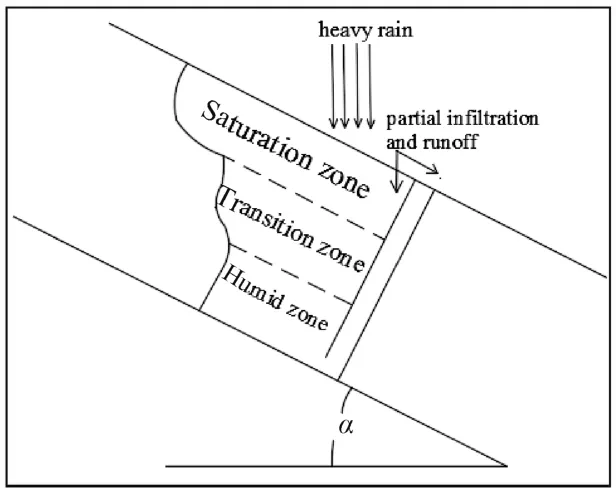
Figure 19 Distribution of soil layer under the condition of heavy rainfall
In the above analysis of the five rainfall intensity levels,after comparing the permeability coefficient of silty clay with each intensity,it is found that surface runoff will occur under heavy rain,which is consistent with the results of software simulation analysis.It further confirms the correctness of the analysis of rainfall infiltration process.
4.2 Analysis of Rainfall Seepage Safety Factor
In the study,we perform statistical analysis on the rainfall intensity to make the data more intuitive.The results reflect the relationship between rainfall intensity,landslide location and safety factors.The distribution map is shown in Fig.20:
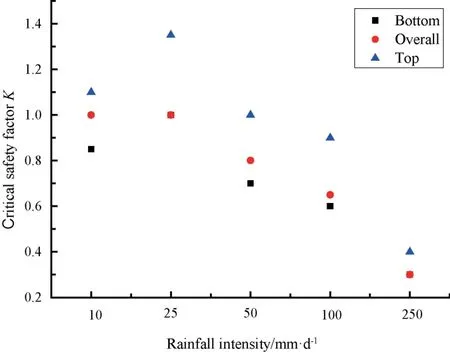
Figure 20 Distribution of safety factor
In order to roughly explore the relationship between rainfall intensity and the safety factor of the slope,we simplify the intermediate impact process of rainfall on the slope,for the purpose of facilitating the diagnosis of the slope.In addition,a sine function model is selected for this set of data to perform nonlinear curve fitting,which is shown as follows:

The fitting results and fitting residuals are shown in the Fig.21:

Figure 21 Fitting curve of safety factor and rainfall under the slope
The fitting curve of the rainfall intensity and the safety factor on the upper part of the slope is relatively good,the residual points are more evenly distributed in the 0.1 zone,and the data basically conforms to the nonlinear sine model.
Fig.23 and Fig.24 are the corresponding fitting curve diagram and fitting residual diagram of the rainfall intensity and safety factor at the lower part of the slope.The residuals of the lower fitting curve are more evenly distributed in the 0.04 zone.Compared with the upper fitting curve,its fitting degree is better and the residual is smaller.
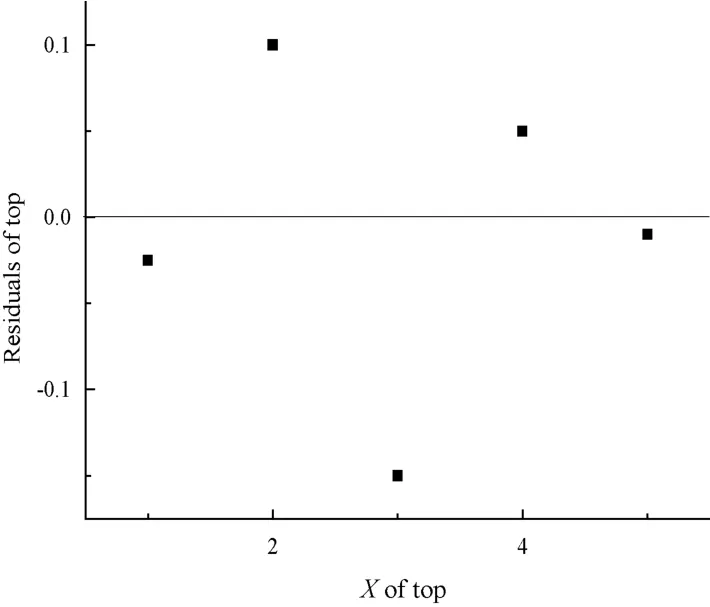
Figure 22 Residual error of fitting curve at the bottom of the slope

Figure 23 Fitting curve of safety factor and rainfall under the slope
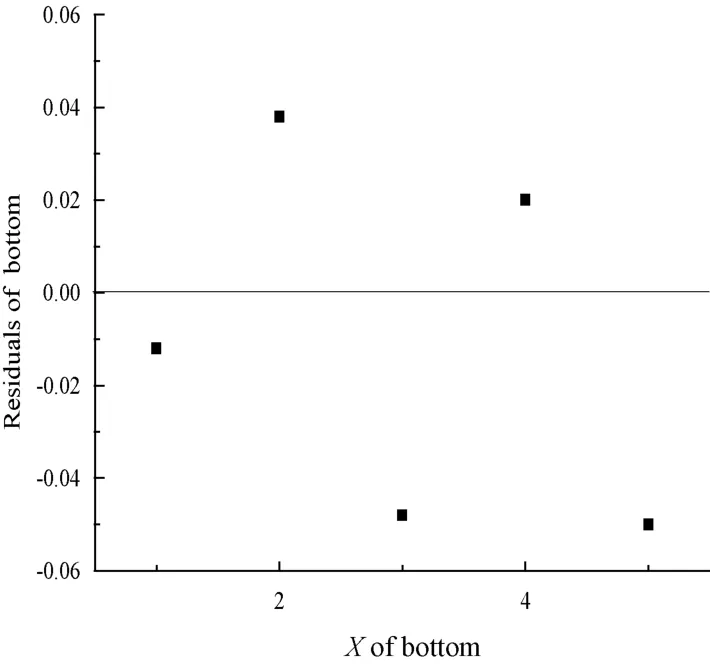
Figure 24 The residual error of the fitting curve of the lower part of the slope
Fig.25 and Fig.26 are the corresponding fitting curve diagram and fitting residual diagram of the overall rainfall intensity and safety factor of the slope.The residuals of the overall fitting curve are more evenly distributed in the 0.1 zone,which is consistent with the residual error of the upper fitting curve.Through the above three fittings,the continuous nonlinear relationship between the rainfall intensity and the corresponding safety factor can be obtained,which is beneficial for the continuous diagnosis of the system.
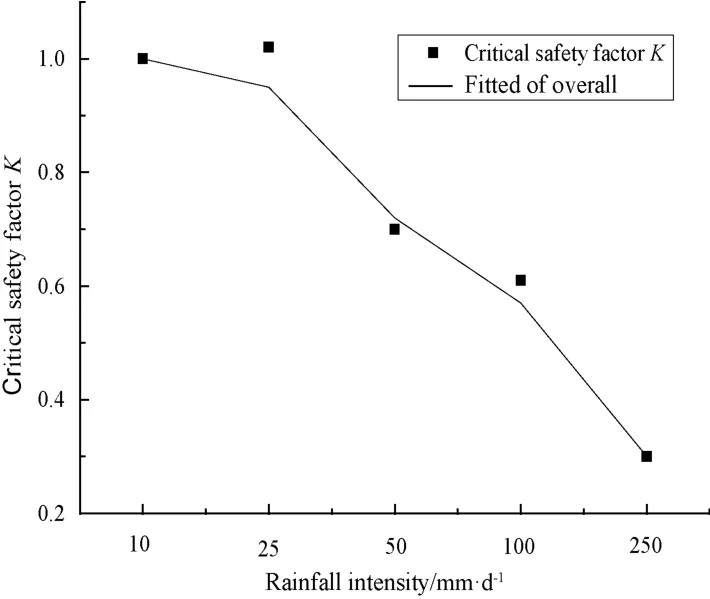
Figure 25 Fitting curve of overall safety factor of the slope
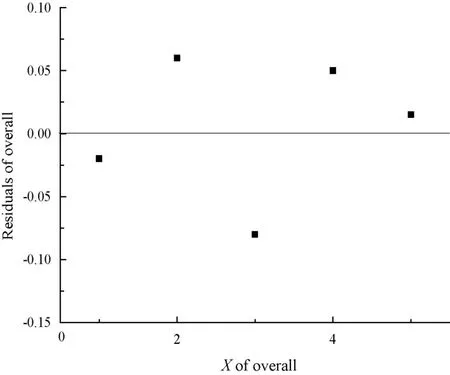
Figure 26 Residual diagram of overall fitting curve of the slope body
5 CONCLUSION
The influence factors of rainfall on slope stability are mainly manifested in two aspects.The first aspect is rainfall intensity.The relationship between rainfall intensity and soil permeability coefficient directly affects the infiltration degree of rainfall.When the rainfall intensity is less than or equal to the permeability coefficient,rainfall will infiltrate into soil.The greater the amount of infiltration,the greater the impact on the stability of the slope.On the other hand,when the rainfall intensity is greater than the permeability coefficient,surface runoff will be formed,and part of the infiltration will flow away.The greater the amount of infiltration,the more unstable the slope will be.The second aspect is the rainfall duration.The longer the rainfall duration,the worse the slope stability.
The stability analysis of each rainfall intensity level,the rainfall intensity of each level and the corresponding safety factor are obtained.On this basis,the continuous relationship between the rainfall intensity and the safety factor is obtained through nonlinear curve fitting,providing a basis for the diagnosis of the slope under the influence of rainfall.
 Earthquake Research Advances2020年4期
- Earthquake Research Advances的其它文章
- Flow Characteristics of Large-Scale Liquefaction-Slip of the Loess Strata in Shibei Tableland,Guyuan City,Induced by the 1920 Haiyuan M8 Earthquake
- Dynamic Response of Double-Sided Loess Slope under Vehicle Load
- Dynamic Response of Shallow-Buried Tunnels Traversing High Loess Slopes
- Early Identification of the Jiangdingya Landslide of Zhouqu Based on SBAS-InSAR Technology1
- Interpretation of the Spatial Distribution Characteristics of the Co-seismic Landslides Induced by the 1920 Haiyuan M8 Earthquake Using Remote Sensing Images1
- Relationship between the Landslides Triggered by the Tongwei M7 Earthquake in 1718 AD and the Disappearance of Yongning Ancient Town
