
Estimation of visceral fat is useful for the diagnosis of significant fibrosis in patients with non-alcoholic fatty liver disease
2020-12-11 07:09:56MartaHernandezCondeElbaLlopCarlosFernandezCarrilloBeatrizTormoJavierAbadLuisRodriguezChristiePerelloMartaLopezGomezJoseLuisMartinezPorrasNataliaFernandezPugaMariaTraperoMaruganEnriqueFragaCarlosFerreAracilJoseLuisCallej
World Journal of Gastroenterology 2020年42期
Marta Hernandez-Conde, Elba Llop, Carlos Fernandez Carrillo, Beatriz Tormo, Javier Abad, Luis Rodriguez,Christie Perello, Marta Lopez Gomez, Jose Luis Martinez-Porras, Natalia Fernandez Puga, Maria Trapero-Marugan, Enrique Fraga, Carlos Ferre Aracil, Jose Luis Calleja Panero
Abstract
Key Words: Non-alcoholic fatty liver disease; Visceral fat; Liver fibrosis; Bioimpedanciometry; Metabolic syndrome; Obesity
INTRODUCTION
Non-alcoholic fatty liver disease (NAFLD) is a major cause of chronic liver disease in the world, ranging from simple steatosis to non-alcoholic steatohepatitis (NASH), which can lead to significant fibrosis, liver cirrhosis and hepatocellular carcinoma[1,2].As the hepatic manifestation of metabolic syndrome (MetS), NAFLD is more prevalent within patients with obesity, type 2 diabetes mellitus, dyslipidemia and/or hypertension[3-5].Particularly, metabolic unhealthy status may have a greater impact on NASH and significant fibrosis than obesity itself[6].Obese subjects do not always develop NAFLD and NAFLD can occur in non-obese subjects[7].In this regard, abdominal fat deposition is closely related with MetS[8].Waist circumference (WC), waist-to-height ratio and waist-to-hip ratio are surrogate markers of abdominal fat, which can rule in MetS[9].However, the visceral component of abdominal fatis most intimately associated with MetS and adverse outcomes, probably through proinflammatory adipokines[8,10,11].Visceral fat (VF) is a key element in the pathogenesis of NAFLD, independently of insulin resistance and liver steatosis[12-17].However,VF cannot be captured by the aforementioned indices.Several works have proposed measuring VF as an indirect marker of NAFLD by using different techniques and thresholds[13,15,16,18-23].None of these studies assessed a possible correlation of VF with liver fibrosis while the prognosis of NAFLD patients is strongly conditioned by fibrosis[24].
Methods for assessing VF and liver fibrosis in NAFLD patients include computed tomography (CT) scan, magnetic resonance imaging and histological analysis, which are impractical in real clinics. Even though transient elastography is simple, noninvasive and reliable for estimating fibrosis in NAFLD, it is not always available[25].On the contrary,bioelectrical impedance analysis (BIA) is innocuous and easy to use. In addition, it is operator-independent and less expensive than CT scan and magnetic resonance imaging[3].
Currently, it is unknown if VF may be a reliable measure of NAFLD severity. On the other hand, BIA may have all the features to become a preferred method for VF estimation. Therefore, we aimed at assessing the role of BIA as a non-invasive tool for assessing NAFLD severity. To this end, we compared BIA with liver biopsy, transient elastography and other indirect methods.
MATERIALS AND METHODS
Study design
This is a cross-sectional study prospectively including consecutive biopsy-proven NAFLD adult outpatientsin a third-level hospital.Exclusion criteria encompassed any other liver comorbidity, history of bariatric or ileal surgery, liver or kidney transplantation, malignancy or treatment with any drug known to induce liver steatosis or insulin sensitization, such as estrogens, amiodarone, methotrexate and tamoxifen. The protocol was approved by the Ethics Committee of the Hospital Universitario Puerta de Hierro-Majadahonda (PI 05-18, 12/03/2018) andit was conducted according to the 1975 Declaration of Helsinki and the Good Clinical Practice guidelines. Written informed consent was obtained from all patients prior to inclusion.
Data collection
Prior to liver biopsy, all the patients underwent abdominal ultrasound, livertransient elastography (FibroScan®502 Touch, Echosens, Paris, France) and controlled attenuation parameter (CAP, Echosens, Paris, France), as clinically indicated. M or XL probes were used as needed[26].CAP (dB/m) was considered only when the associated elastography measurement was valid [median measurement/interquartile range≥0.3 (kPa)]. Liver biopsy was performed as part of the clinical work-up for NAFLD diagnosis. For our study,all the slides were reviewed by an experienced liver pathologist (C.S.) using the NAFLD activity score (NAS)[27].Significant fibrosis was defined as fibrosis stage≥2.
All the patients underwent a complete anthropometric evaluation, blood tests and BIA after overnight fasting by the same investigator, mostly the same day of the liver biopsy. Height, weight and WC were measured with patients in light clothing, after removing their shoes and emptying their bladders.Total and visceral adipose tissuewere measured by BIA (DC430PMA, Tanita, Amsterdam, The Netherlands). A rating between 1 and 12 indicates a healthy level of VF and a rating between 13 and 59 indicates an excessive accumulation of VF.Obesity was defined as a body mass index (BMI) (weight/height2) of≥30 kg/m2and overweight as 25-30 kg/m2.An increased WC was defined as ≥ 102 cm for men and ≥ 88 cm for women[28].Insulin resistance was calculated by the homeostatic model assessment[29].MetS was defined according to the National Cholesterol Education Program Adult Treatment Panel III definitions when three or more criteria were met[30].
Statistical analysis
Quantitative variableswere described as mean ± SD or median and range where appropriate. Categorical variables were described in percentages.For bivariate analysis, quantitative variables were compared using Student´st-test. When normality or equality of variances was not observed, non-parametric tests were used. Categorical variables were compared using Chi-squared and Chi-squared for trend tests, or Fisher’s exact test. Correlations between quantitative variables were assessed using Pearson or Spearman rank correlations, as appropriate. To compare variables in more than two groups,Kruskal-Wallis test was used.Multivariable logistic-regression standardized models were constructed by introducing explanatory variables other than transient elastography measurements, with aP< 0.2, using abackward eliminationmethod. Diagnostic accuracy was determined by the area under the receiver operating characteristic curve (AUROC) and 95%CI.Sensitivity, specificity, positive predictive value and negative predictive value were calculated for the models. Youden index was used to determine the optimal cut-off value for these.Statistical analyses were performed with STATA software 14 (Stata Corporation, College Station, TX, United States) andP< 0.05 was considered statistically significant.
RESULTS
Between September 2017 and February 2020, 390 NAFLD patients were screened for the study, 119 of who were included (SupplementaryFigure 1). Patient characteristics are shown in Table 1.The mean age was 56 ± 10.7 years, 66.4% of the patients were male and 95% were overweight or obese. Type 2 diabetes mellitus and MetS were predominant (55.5% and 61.3%, respectively). Accordingly, mean WC and VF were elevated (109.3 ± 14 cm, 14.8 ± 5.3, respectively). Significant fibrosis was present in 60 patients(50.4%) and cirrhosis was found in 18 patients (15.1%).
VF measurements positively correlated with WC, BMI and liver fat measurement by CAP (r= 0.67;r= 0.64 andr= 0.32, respectively;P< 0.001) (Table 2). We assessed possible associations for all these parameters with the several components of NAS in liver histology. None of these parameters was associated with the presence of NASH, excepting CAP (343 dB/mvs319 dB/m;P= 0.018), which positively correlated with the degree of steatosis and overall activity score (Supplementary Table 1). However, VF was the only parameter associated with histological fibrosis stage (r2= 0.112;P< 0.01). VF measurements were lowest for those patients with F0-1 in liver biopsy and highest for those patients showing F4, with intermediate levels for those with F2-3 (P< 0.01) (Figure 1A), therefore displaying a linear increase (r2= 0.11,P< 0.01). Even though WC and BMI correlated with transient elastography measurements (r= 0.23 andr= 0.25, respectively;P< 0.05), they did not correlate with the gold standard. When focusing on patients with significant fibrosis, VF was the only parameter that was statistically significantly associated (16.4vs13.1,P< 0.001) (Table 3 and Figure 1B). In addition, these patients were older and showed a higher frequency of MetS than those without significant fibrosis (61 yearsvs52 years, 73.3%vs49.2%;P< 0.01 for both). In multivariable regression analysisexcluding transient elastography,age and VF were the only variables independently associated with histologicalsignificant fibrosis(VF, OR: 1.11,95%CI: 1.02-1.22,P= 0.021; age, OR: 1.08, 95%CI: 1.03-1.12,P= 0.001). A model including these variables showed an AUROC of 0.75 (95%CI: 0.66-0.84),with a sensitivity of 70%, a specificity of 67.8%, as well as positive and negative predictive values of 68.9% and 69%, respectively(Figure 2A). When comparing our model AUROC with the AUROCs for transient elastography and NAFLD fibrosis score, we found no significant differences among them (0.82 and 0.78vs0.75,P= 0.099 and 0.345, respectively, Figure 2B). Based on our results, we built a simple nomogram including age and VF for the prediction ofsignificant fibrosisin routine practice (Figure 3). A nomogram probability of 50% was the cut-off that best identified patients withsignificant fibrosis, showing an AUROC of 0.7 (sensitivity, 67%; specificity, 73%).
DISCUSSION
NAFLD is one of the most prevalent chronic liver diseases worldwide, which can progress to steatohepatitis, fibrosis, cirrhosis and rarely hepatocellular carcinoma without cirrhosis[1,2].NAFLD is associated with diet, MetS, obesity and adverse cardiovascular events[3,31-33].Even though fat deposition is a key pathophysiologic element, the distribution of fat deposits must be underscored.Large population studies have shown markers of increased VF to be independent predictors of cardiovascular and overall mortality[10,34]. In addition, central body fat distribution has been associated with the development of NAFLD[22].CT scan is the most effective method to differentiate subcutaneous from visceral obesity. However, it has many limitations such as price, radiation and availability[35].Therefore, identifying simple anthropometric markers of VF in clinical practice may be extremely useful to assess metabolic status. In our study including 119 patients with biopsy-proven NAFLD, we investigate the value of VF estimated by BIA as a non-invasive marker of NAFLD severity
A number of studies show that simple anthropometric indices related with abdominal obesity, such as BMI and WC, are able to predict the presence of NAFLD[19,36,37].In our study including patients already diagnosed with NAFLD, all WC, BMI and CAP showed increased values, and VF measurements positively correlated with them. Yet, when assessing liver histology, which is the gold standard, associations with NAS features were overall poor. Here, VF was the only parameter associated with fibrosis stage, even though VF was not associated with the degree of steatosis. Liver fibrosis is the strongest histological feature influencing outcomes in the long term and late stages of NAFLD may have waning degrees of steatosis[24].All thesefindings concur with previous studies suggesting that body composition is capital to assess NAFLD and metabolic risk factors as a whole. Although BMI is a robust marker for obesity, itdoes not provide any information about the anatomic distribution of fat[21,23,38].Similarly, WC is a well-known and simple parameter included in the definition of MetS, but it may fail to distinguish visceral from subcutaneous fat and is influenced by patient height[19,39].In addition to depending onweight gain,visceral adipose tissue also accumulates more rapidly with increasing age, which allows time for disease progression as well[40].Thus, an increased prevalence and severity of NAFLD is expected for older ages[41].In our study, thosepatients with significant fibrosis were older than F0-1 patients.

Table 1 Patient characteristics
Ourhypothesis was supported bythe multivariable model, which confirmed VF and age as the only independent risk factors for significant liver fibrosis measured by liver biopsy. The fact that MetS and its components lost their significance in the multivariable analysis, points again to VF as an active mediator, rather than just a marker of MetS. Although obesity is a risk factor for NAFLD, insulin resistance and cardiovascular diseases, not every obese patient is insulin resistantor at high risk for liver and cardiovascular diseases. In fact,VF seems to influenceNAFLD genesisindependently of insulin resistance[12,42,43].The precise mechanisms by which VF exerts its damaging consequences remain controversial, but it has been suggested thatvisceral adipose tissue may be infiltrated with inflammatory cells and release inflammatory cytokines which travel through the portal vein to the liver, in addition to free fatty acids[10,31,37,43-46].Visceral obesity is probably the most important target for future interventions in MetS and NAFLD.

Table 2 Correlations of visceral fat with anthropometric parameters, liver fat and liver fibrosis
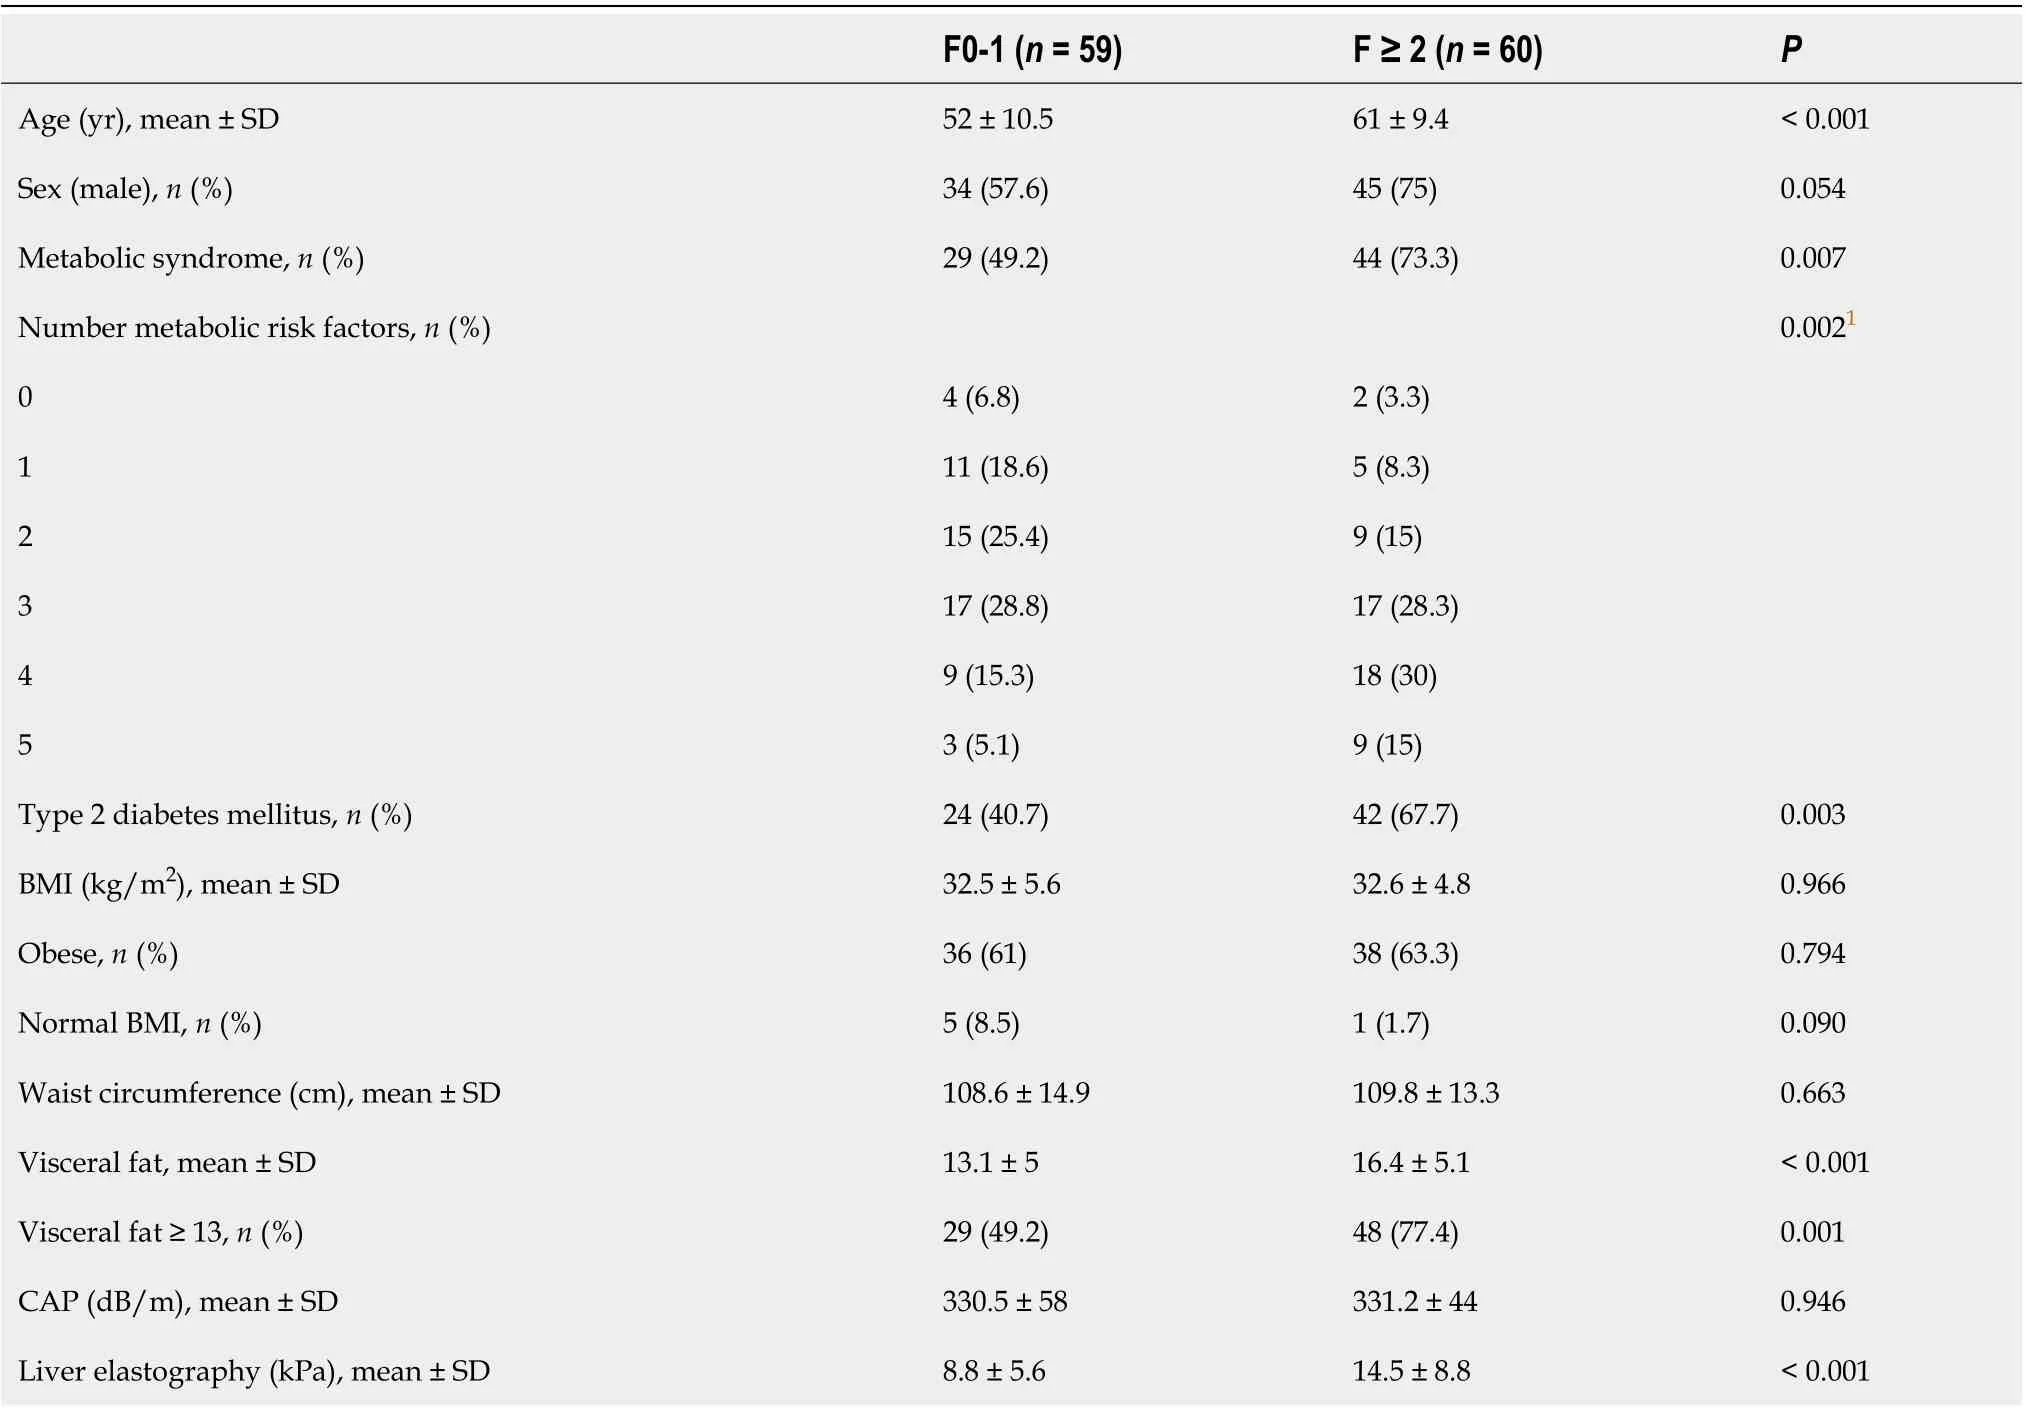
Table 3 Patient characteristics according to significant liver fibrosis (F ≥ 2)

Figure 1 Visceral fat measurement by bioimpedanciometry, according to histological fibrosis stage. A: Visceral fat measurements increased along with fibrosis stage assessed by histological analysis (F0-1, 12; F2-3, 14; F4, 16; Kruskal-Wallis cP < 0.001). A line can be fit by linear regression, showing linear association (r2 = 0.11, cP < 0.001); B: Visceral fat measurements were greater for those patients with significant fibrosis (16.3 vs 13.1, cP < 0.001).

Figure 2 Area under the receiver operating characteristic curve. A: Receiver operating characteristic (ROC) curve for non-invasive diagnosis of significant liver fibrosis by a model including age and visceral fat; B: Comparison of the areas under ROC curves for a model using age and visceral fat versus liver elastography measurement, to predict significant liver fibrosis. Circles denote our model, triangles indicate non-alcoholic fatty liver disease fibrosis score and crosses denote liver elastography.
Because NAFLD has become a major Public Health concern, it is essential to find screening tools to identify patients at risk of NASH or significant fibrosis for specialist referral, before they present with important complications[47]. Accurate assessment of liver fibrosis in primary care and other settings is limited by a reliance on blood tests, which correlate poorly with liver fibrosis, as well as a restricted access to more discriminatory tests such as transient elastography[48].Our model was built excluding transient elastography and is able to identify advanced liver fibrosis with an AUROC of 0.75 by using BIA measurement and age. Of note, this AUROC was not significantly different from that of transient elastography or NAFLD fibrosis score.To simplify the model and enhance its utility, we built a nomogram, which provides visual means of calculating the probability for a given patient to have significant fibrosis. Potentially, this would allow initial assessment in a wide variety of clinical and resourceavailability settings, since no blood draw would be needed and bioimpedanciometry devices are less costly than other equipment, with no or minimal training.
Certainly, our study has a number of limitations. The cross-sectional design does not allow for causation and prognosis assessment. On the other hand, sample size is relatively limited, although biopsies were available. The population studied was Caucasian while other populations may be more or less prone to abdominal obesity and VF accumulation, thus needing specific calibration. The absence of a control group may be controversial as a limitation since liver biopsy is indicated only for those NAFLD patients with suspicion of significant fibrosis. Finally, VF was not evaluated by CT scan but BIA has been shown to have a high correlation with CT scan[49].Additionally, BIA is easy to operate, inexpensive, highly reproducible, and radiation free.

Figure 3 Nomogram for assessing the probability of significant liver fibrosis in a clinically useful manner. With the variables resulting from the multivariate regression model, we built an easy-to-use visual tool. In an individual patient, visceral fat levels and age correspond to a score. Combining these scores gives a total score that can be converted to a probability of that patient having significant fibrosis in liver biopsy. For example, a patient with a visceral fat level of 12 (score 2) and with 55 years old (score 7) would have a total score of 9 and a corresponding probability of histological significant fibrosis of 43%.
CONCLUSION
In conclusion, our study demonstrates that BIA-estimated visceral adipose tissue is useful for detecting advanced NAFLD, independently of MetS. Our proposed simple method would allow referral to specialized care in a wide variety of resource-limited settings. Future studies will aim at validating this tool in larger prospective cohorts.
ARTICLE HIGHLIGHTS

Research perspectives
Future studies will aim at validating this tool in larger prospective cohorts.
 World Journal of Gastroenterology2020年42期
- World Journal of Gastroenterology的其它文章
- Nonalcoholic fatty liver disease in lean subjects: Prognosis, outcomes and management
- Modern surgical strategies for perianal Crohn's disease
- Simultaneous colorectal and parenchymal-sparing liver resection for advanced colorectal carcinoma with synchronous liver metastases: Between conventional and mini-invasive approaches
- Nomograms and risk score models for predicting survival in rectal cancer patients with neoadjuvant therapy
- Attention deficit hyperactivity disorder and gastrointestinal morbidity in a large cohort of young adults
- Reactive oxygen species-induced activation of Yes-associated protein-1 through the c-Myc pathway is a therapeutic target in hepatocellular carcinom