
The dynamics of a nanosecond gas discharge development with an extended slot cathode in argon
2020-12-02 08:11:16ASHURBEKOVIMINOVSHAKHSINOVZAKARYAEVAandRABADANOV
Plasma Science and Technology 2020年12期
N A ASHURBEKOV , K O IMINOV, G S SHAKHSINOV,M Z ZAKARYAEVA,2 and K M RABADANOV
1 Dagestan State University, Faculty of Physics, Makhachkala 367000, Russia
2 Institute of Physics, DFRC of RAS, Makhachkala 367015, Russia
Abstract
Keywords: nanosecond gas discharge, numerical simulation, argon, excited atoms
1.Introduction
In recent years,plasma technologies based on low-energy ion flux sources have undergone significant development for various precision technological applications, for example, in atomic/molecular-layer surface etching of micro- and nanoelectronic materials [1-9].For such technological applications, various plasma systems for the formation and generation of ion fluxes with controlled ion energy are investigated.One of the effective sources of low-energy ion fluxes consists of a beam plasma having the spatial configuration of a‘plasma sheet’whose surface functions as a wide-aperture ion emitter in the transverse direction [4, 10, 11].For the formation of such ion flux sources, extended ribbon electron beams are required, particularly in terms of a high-voltage transverse nanosecond discharge generated by an extended slot cathode.In such a gas-discharge system,a ribbon electron beam is generated as a result of the emission of electrons from a cold cathode under the influence of bombardment by highenergy ions and atoms, as well as their acceleration in the region of the cathode potential drop(CPD)[12,13].By using ribbon electron beams behind the mesh anode in the region beside the collector, it has been shown that a beam plasma is created in the form of a thin ‘plasma sheet’ acting as the emitting surface of a wide-aperture beam formed by accelerated ions [11].Such a constructive use of a nanosecond discharge with a slot cathode requires a more detailed study of the dynamics of formation and the space-time distribution of the main parameters of the discharge.It is necessary to optimize the conditions for the generation of ribbon electron beam and to control the average electron energy in the‘plasma sheet’,which in its turn will make possible to control the energy of ion flows.
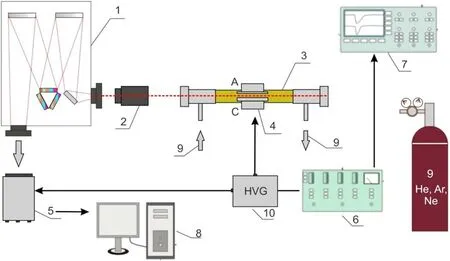
Figure 1.Block diagram of experimental setup: (1) monochromator-spectrograph; (2) objective; (3) chamber; (4) A, C-anode, cathode;(5) high-speed Princeton Instruments PI-MAX3 ICCD camera; (6) Tektronix AFG 3022B synchronisation generator; (7) oscilloscope;(8) PC; (9) gas inlet and evacuation system; (10) HVPG.
The present work is aimed at studying the dynamics of the formation of the main parameters of a high-voltage nanosecond discharge generated by a slot cathode in argon at gas pressures from 1 to 10 Torr at various values of an external electric field applied to the electrodes.The work studies the features of the spatiotemporal distribution of the main parameters of the discharge.
2.Experimental part and results
The experimental setup consists of a high voltage nanosecond pulse generator, synchronisation generator, discharge chamber, gas inflow-evacuation and pressure monitoring systems,as well as the diagnostic systems of discharge electrical and optical characteristics [13] (figure 1).The discharge chamber is assembled as a quartz tube with an internal diameter of 5 cm having a system of aluminium electrodes located inside at a distance of 0.6 cm apart.The anode consists of a flat plate 5 cm long,2 cm wide and 0.5 cm thick,while the cathode has the shape of a cylindrical rod measuring 5 cm in length and 1.2 cm in diameter,with a lengthwise cavity cut in the form of a slot with a width of 0.2 cm and depth of 0.6 cm [14].A Tektronix TDS 2024B oscilloscope was used for measuring the electrical characteristics of the discharge.In order to study the spatiotemporal dynamics of nanosecond discharge development, we used a PI-MAX3 Princeton Instruments high-speed camera equipped with an optical shutter having an adjustable exposure time of 2 ns and a time resolution between frames of up to 3 ns.The depth of field during highspeed photography of the discharge development was about 50 mm, when using a Nikon 200 mm lens with an f/32 fnumber.
The PI-MAX3 system was synchronised with discharge current using a Tektronix AFG 3022B pulse generator.
The radiation of the discharge was projected onto the input of a high-speed photorecorder PI-MAX3 ICCD by means of a photographic objective; next, a time-lapse recording was carried out at various time intervals between the triggering of the thyratron and the launch time of the ICCD camera.The exposure time for frame-by-frame photorecording was selected in the range from 5 to 20 ns,depending on the specific formation conditions for a nanosecond discharge.The signals from the PI-MAX3 camera were sent to a personal computer with subsequent fixation and processing of the optical images.For measurements, a pulseperiodic discharge mode with a frequency of 50 Hz was applied.On one hand, such a discharge repetition frequency greatly increases the intensification of the glow due to accumulation of an optical signal in the recording system.On the other hand, this frequency allows complete recombination of the plasma and the destruction of metastable particles in the interval between individual current pulses (for time≈2×10⁻²s) to take place.
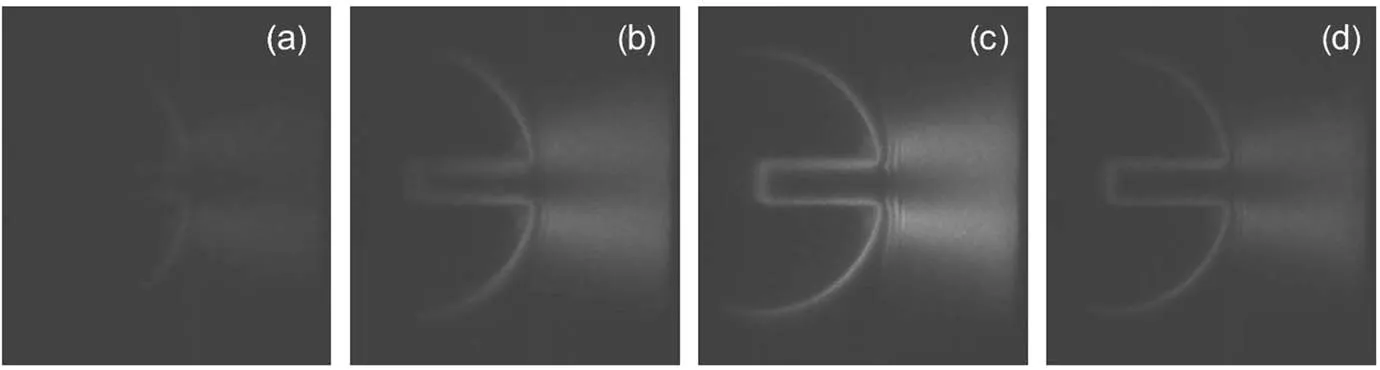
Figure 2.Optical patterns of radiation from a nanosecond discharge with a gap cathode in argon at U0=1 kV and p=1 Torr.(a) t=150 ns, (b) t=200 ns, (c) t=300 ns, (d) t=450 ns.

Figure 3.Optical pattern of integral radiation (a) and pulses of combustion voltage and discharge current in argon (b) at U0=1 kV and p=1 Torr.

Table 1.Estimated discharge parameters.
In order to provide additional verification of the results of numerical simulation of excited atoms density, a nuanced investigation of panoramic discharge emission spectra depending on the amplitude of voltage pulses and gas pressure was carried out.For these purposes, an MS 7504i monochromator/spectrograph from SOL instruments Ltd equipped with a four-position turret for automated change of diffraction gratings (200, 1200, 1800, 2400 lines mm−1) was used.The recorded wavelengths are in the range of 267-1200 nm, the inverse linear dispersion of the device (for a 1200 lines mm−1grating) is 1 nm mm−1, and the spectral resolution is 0.037 nm (with 10 μm slit).The monochromator/spectrograph is equipped with a stepping motor for rotating diffraction gratings with the wavelength setting accuracy of about 0.05 nm, and a Hamamatsu HS 102H S 9840 CCD camera for recording the discharge emission spectrum.
Figure 2 presents the characteristic optical patterns of the discharge at different moments of time from the beginning of a high-voltage voltage pulse (U0) being applied to the discharge gap.The dynamics of the spatiotemporal distribution of optical radiation in the discharge gap shows that the intensity of the optical radiation of the discharge initially increases, reaches its maximum value approximately 300 ns after the application of a voltage pulse to the electrodes, then subsequently decreases, at which point the discharge goes to the final stage.At gas pressures of about 1 Torr, the experiment demonstrates the characteristic spatial distribution of the optical radiation discharge.At all stages in the development of the nanosecond discharge, no discharge is observed inside the cathode cavity:the characteristic glow only appears in the gap between the electrodes.In this case, the radiation intensity is lower in the centre of the gap against the cathode cavity, leading to the formation of a dark region reaching almost to the surface of the anode.The narrow glow layer observed along the cathode surface,including in the cavity,is apparently due to the reflection of radiation from the polished cathode surface.Due to insufficient discharge radiation intensity at the initial stages, it was not possible to experimentally determine the propagation of the ionisation front from the anode surface or the overlap of the discharge gap.

Figure 4.The cross section of the electrode system (a) and the geometry of the region of gas-discharge processes simulation (b).
Figure 3 depicts the optical representation of the discharge integral radiation along with the corresponding discharge current-voltage characteristics.At a gas pressure of 5 Torr, it can be seen that the discharge penetrates into the cathode cavity, a dense plasma is formed in the cavity and a radiation intensity maximum appears at the exit of the cathode slot (figure 3(a)).
The half-height voltage pulse duration is approximately 100 ns relative to a total discharge duration of 500 ns.The discharge current, which reaches its maximum value 200 ns after the start of electric gas breakdown, is equal to about 60 A (figure 3(b)).Using current-voltage characteristics, the approximate discharge parameters obtained at various stages in the development of the nanosecond discharge are as follows:JD-discharge current density,E/N-reduced electric field strength,udr-electron drift velocity and ne-electron density.These estimated values are given in table 1.
The concentration of free electrons in the discharge was calculated on the basis of plasma conductivity.Since the mobility of ions is known to be two orders of magnitude lower than that of electrons, any ionic contribution to the electric current can be discounted.On this basis, for the density of the discharge current,the formulaJD=eneudr,can be written, where e is the electron charge,neis the concentration of free electrons andudris the electron drift velocity.TheJD=I/Scurrent density was calculated by the experimental values of the I current intensity and the S crosssectional area of the discharge.The electron drift velocity was determined from the plots on the basis of the E/N reduced electric field strength, where N is the concentration of gas atoms [15, 16].When determining the values of E in the plasma column, it was considered that, in a discharge with a hollow cathode,as well as in an anomalous discharge,almost all the voltage applied to the gap decreases in the region of the CPD.For estimates, the Up~UD/5 values of the voltage drop across the plasma column were taken [17].
3.Numerical model for the dynamics of ionisation process
Numerical modelling of the problem was carried out in the COMSOL Multiphysics Plasma Module.The ionization coefficients, excitation coefficients and transport coefficients of particles are the required inputs to the drift-diffusion equations, but they are dependent upon the electron energy distribution function (EDF), which is not known beforehand.The EDF was calculated as follows:the slow part of the EDF(the EDF of a slow group of electrons) was calculated as a Maxwell function, and a Gaussian function was used to find the fast part of the EDF(the EDF of a fast group of electrons),where the Gaussian function being 10% of the Maxwell function.Further, both functions were stitched.After that an interpolation table was formed for the EDF and this table was used as inputs of the Plasma Model.The geometry of the modelling area was selected on the basis of the actual dimensions of the discharge chamber; the electrode system used for the experimental studies was as described in the previous paragraph.The geometric model in the program was set to axisymmetric (figure 4).For the cylindrical coordinate system()φr z, ,(dependence onφis not considered), axial symmetry is specified relative to r=0.Further, COMSOL Multiphysics allows for reflecting the results obtained relative to the boundary of axial symmetry in the model.
The aim of numerical modelling is to study the dynamics of the formation and development of a nanosecond gas with an extended slot cathode and flat anode, including the formation of the spatio-temporal structure of the discharge and the distribution of the main discharge parameters depending on the gas pressure and amplitude of the voltage pulses.The results of the modelling support a deeper understanding of the physics of the high-voltage nanosecond discharge operation,as well as helping to explain experimentally-observed features of this discharge in argon.
In the field of modelling, a self-consistent system is solved, consisting of equations for the electric field, density and average momentum of electrons,along with equations for electron energy and transport of heavy particles.
In order to numerically solve the system of equations,thene(t=0,x,y)=ni(t=0,x,y)=n0initial conditions were chosen withn0~108cm−3presenting the initial background plasma density determined by the residual processes in the gas-discharge system under the frequency-periodic plasma generation regime [18].
The boundary conditions were selected as follows:
(1)V=0 is the potential on the walls of the cathode;
(2)V=U(t) is the potential on the anode wall, set from the experimentally measured value of the voltage pulse at the anode;
(3) Boundary conditions on the dielectric walls of the discharge chamber:

whereεris the relative dielectric constant;dsis the thickness of the dielectric layer;Vrefis the reference potential determined by the charge captured on the surface of the dielectric;σsis defined as follows:σs=n×Ji+n×Je,Jiis the normal component of the total density for the wall ion current,Jeis the normal component of the total density for the wall electron current,which was measured experimentally on the electrodes for these discharge conditions.
In order to set the shape and parameters of the electric field potential,the U(t)voltage pulse measured experimentally on the electrodes for the corresponding discharge conditions was digitised.A ballast resistance was introduced into the calculation model that took the characteristics of the discharge circuit into account in accordance withU=U0−Ip×Rb,equation using the value selected by the coincidence of the calculated discharge current pulse with the experimentally measured voltage pulse.
For numerical modelling, a triangular grid is built in the modelling area and the computational cycle is started with a given time step.The values of the electric field potential and the density of charged particles at each internal nodal point of the grid are calculated.In this case, elastic collisions of electrons with argon atoms,processes of electronic excitation,direct and stepwise ionisation of argon atoms, electronic deactivation of metastable states of atoms, as well as the Penning ionisation are taken into account.Here,the destruction of charged particles due to recombination in the volume and on the surface of the boundary material as a result of adhesion processes is also taken into account, along with secondary electron emission from the cathode surface having a coefficient of 0.02.
In numerical modelling, the grid step varies within(1-9)×10-3cm, while the time step is taken to be equal to 10-12s[19].The iterative process used for refining the values of the calculated parameters stops when the specified accuracy is achieved.For the calculation results presented in this paper, the relative accuracy comprises 10-4.
4.Results of numerical modelling for the dynamics of ionisation processes in argon
A numerical modelling for the distribution of the electric field potential in the discharge gap and inside the cathode cavity was carried out during the development of ionisation.Under similar conditions, the formation and development dynamics of the ionisation wave front was calculated along with the spatiotemporal dynamics for the distribution of the charged particle and excited argon atom density, as well as for the energy of electrons along the discharge gap in a gas pressure range from 1 to 10 Torr and voltage pulse of 1 kV amplitude applied to the electrodes.The initial concentration of charged particles is taken to be equal to 108cm-3and uniformly distributed both in the discharge gap and inside the cathode cavity, corresponding in order of magnitude to the residual charge in pulse-periodic mode of gas ionisation.
4.1.Calculation results at gas pressure of 1 Torr
The results of numerical modelling for ionisation processes in a high-voltage nanosecond discharge generated by a gap cathode and obtained at a gas pressure of 1 Torr and a pulse amplitude of 1 kV are provided below.Figure 5 presents the dynamics of the spatiotemporal distribution of the density of charged particles in the discharge gap.As can be seen from the figure,the density of charged particles is redistributed due to electrons being pulled to the anode at the initial stages in the formation of electric gas breakdown.In this case, the electron concentration in the cathode cavity and around the cathode decreases, then gradually increases near the anode surface; in addition, the concentration of charged particles mainly increases in regions located closer to the edges of the flat anode.When a concentration of 5×108cm-3is reached in these regions after about 50 ns, two ionisation waves,directed towards the cathode,are formed(figure 5).Estimates indicate the propagation velocity of ionisation waves to be around 2×107cm s−1.After approximately 150 ns, a solid ionisation front forms at the anode surface between highconcentration regions and advances toward the cathode(figure 5(b)).As a result, a characteristic discharge structure is formed having an uneven distribution of plasma density and a maximum electron concentration of 3×1011cm-3(figure 5(d)).It should be noted that the plasma structure is formed at a distance of about 0.2 cm from the cathode surface;no penetration is observed into the cathode cavity with an approximate CPD region length of lc~0.2 cm (figure 5(d)).
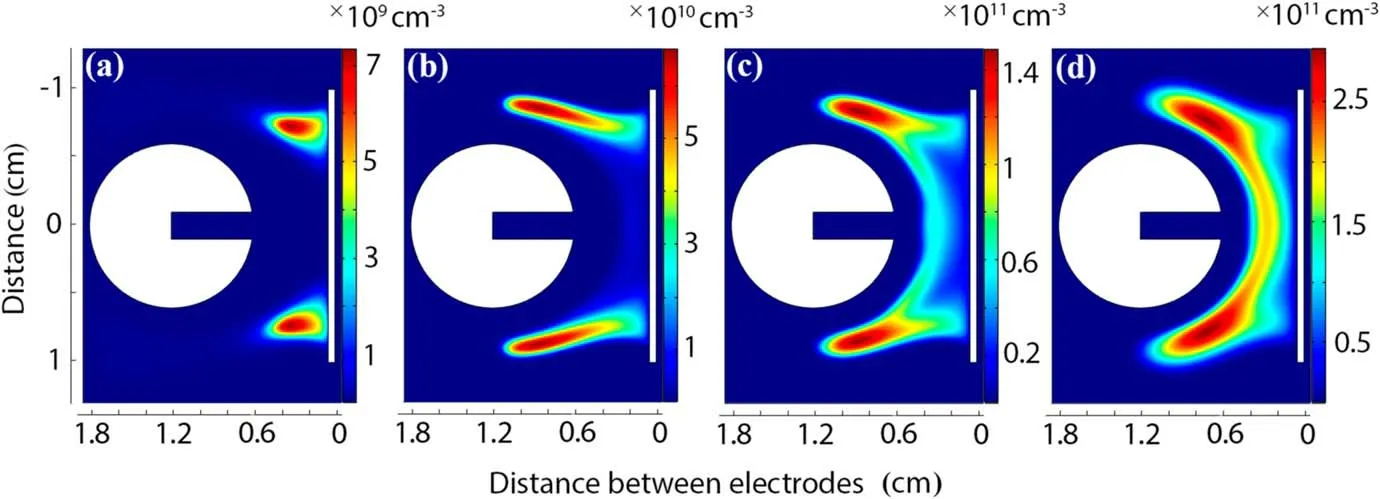
Figure 5.The results of numerical simulation of the dynamics of the spatio-temporal distribution of electron density in the discharge gap atU0=1 kV and p=1 Torr.(a) t=80 ns, (b) t=150 ns, (c) t=200 ns, (d) t=400 ns.

Figure 6.The results of numerical simulation of the distribution of the electric field potential(a)and the distribution of the average electron energy (b) in the center of the discharge gap at U0=1 kV and p=1 Torr.
The characteristic distribution features of the intensity of the optical discharge radiation in the experimentally-obtained optical patterns(figure 2)are in qualitative agreement with the results of numerical modelling (figure 5).However, as compared to the results of numerical modelling, the beginning of the plasma column in optical patterns turns out to be closer to the cathode surface; here, the lc~0.2 cm value can be considered as an upper estimate.At a gas pressure of p=1 Torr,a classical high-voltage hollow-cathode discharge pattern is realised.If the cathode cavity from the end is completely open, i.e.the h slot width in the cathode coincides with the size of the exit hole and no enough space is provided between the walls of the slot to accommodate the CPD areas(h<2lc),then no transmission of the electric field occurs in the cathode cavity.
For an abnormal discharge in argon,an estimate of the lcvalue can be provided from a formula obtained by extrapolating the experimental data [20]

At a gas pressure of p=1 Torr, lc=0.122 cm is obtained from formula (1).Since the cathode slot width h=0.2 cm under the conditions of this work,h<0.244 cm;consequently, no discharge formed by the cathodic potential drop will be observed inside the cathode cavity.This is also confirmed by the results of modelling the distribution of the electric field potential along the centre of the discharge gap(figure 6(a)), which predicts that the electric field at the entrance of the cathode cavity will first increase,then achieve its maximum value and finally drop.During the entire period of the formation of electric breakdown of the gas,the electric field hardly penetrates into the cathode cavity (figure 6(a)).
Although some of the ions penetrate the cathode cavity,their density inside the cathode cavity is insufficient for a substantial change in the distribution of the electric field inside the cavity.These ions then reach the inner surface of the cathode cavity to cause secondary electron emission.Since there is practically no accelerating electric field inside the cathode cavity, secondary electrons diffuse from the cavity towards the exit for some time.At the exit, these electrons enter the cathode region and are accelerated to high energy.The mean free path of an electron with respect to inelastic processes comprises λ=1/(N·σ)=0.17 cm,where N=3.3×1016cm-3and σ=1.8×10⁻¹⁶cm2[21].Consequently, lc<λ and the electrons in collisionless mode pass the CPD region to gain ε=eUc~900 eV energy

Figure 7.The results of numerical simulation of the distribution of electron density(a)and the density of excited atoms(b)in the center of the discharge gap at U0=1 kV and p=1 Torr.
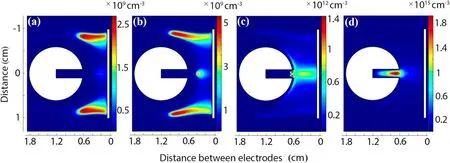
Figure 8.The results of numerical simulation of the dynamics of the spatio-temporal distribution of electron density in the discharge gap atU0=1 kV and p=5 Torr.(a) t=100 ns, (b) t=110 ns, (c) t=130 ns, (d) t=400 ns.
(figure 6(a)).The results of numerical modelling confirm the high electron energy at the exit from the cathode cavity(figure 6(b)).An average electron energy of up to 80 eV designates the presence of a sufficient number of high-energy electrons in the discharge.Under the same conditions,the results of numerical modelling presented in [22] indicate the presence of electrons with energies of above 1000 eV in the discharge gap.The path length of accelerated electrons can be estimated according to the formulawhere εi=26 eV is the energy of formation of an argon ion pair.These estimates demonstrate that the accelerated electrons freely reach the anode surface at p=1 Torr.The low electron concentration in the discharge gap (figure 7(a)) is explained by the absence of the hollow cathode effect in the discharge,resulting in a dramatic increase in the electron concentration and discharge current.Under the considered conditions, the results of numerical modelling also showed the concentration of excited atoms to be comparable with the concentration of free electrons (figure 7(b)).
This fact also confirms the presence of high-energy electrons in the discharge, producing more than ten acts of electronic excitation of atoms.The results suggest that highvoltage nanosecond discharge generated by a slot cathode at gas pressures of about p=1 Torr is applicable for the effective generation of a high-energy electron beam.
4.2.Calculation results at gas pressure of 5 Tor r

Figure 9.The results of numerical simulation of the distribution of the electric field potential(a)and the distribution of the average electron energy (b) in the center of the discharge gap at U0=1 kV and p=5 Torr.
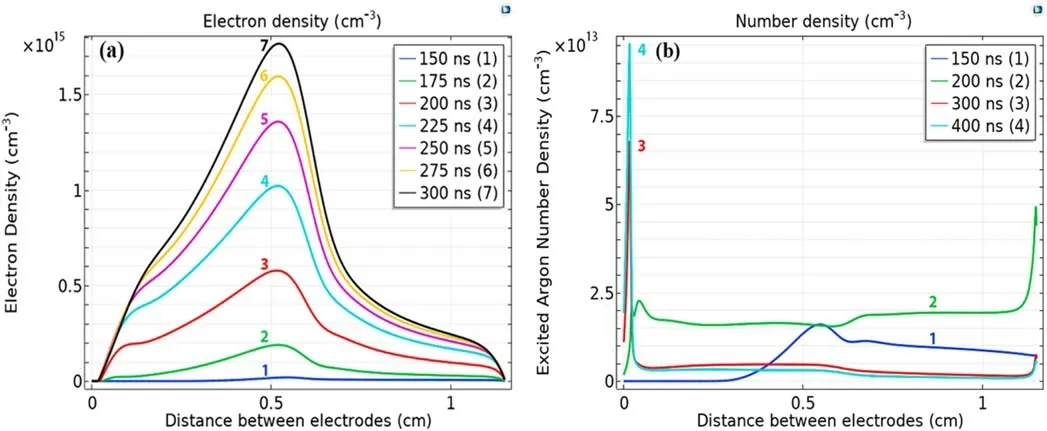
Figure 10.The results of numerical simulation of the distribution of electron density(a)and the density of excited atoms(b)in the center of the discharge gap at U0=1 kV and p=5 Torr.
According to the numerical modelling, the dynamics of discharge formation at a gas pressure of 5 Torr remains the same as at p=1 Torr in the initial stages.Then, approximately 100 ns after the application of a voltage pulse to the electrodes from the centre of the flat anode, a third ionisation wave is formed, qualitatively altering the consequent discharge development dynamics along with the parameters of the formed plasma.An ionisation wave propagating at a speed of about 1.7×107cm s−1toward the cathode (figure 8(b))approaches the entrance to the cathode cavity, penetrating it when the electron concentration reaches ~1012cm-3(figure 8(c)).An estimate by formula (1) at a gas pressure of 5 Torr gives the value lc=0.024 cm; therefore, h>2×lc=0.048 cm and the cathode cavity is penetrated by the electric field (figure 9(a)),forming plasma behind it.A dense plasma with a concentration of about 1012cm−3shields the applied electric field, which is mainly localised in the cathode layer.Further,ions are accelerated in the cathode layer,penetrating into the cathode cavity to enhance the electric field.An electric field penetrating the cathode cavity also accelerates the initial electrons inside the cathode cavity with the subsequent generation of a quasi-neutral plasma accelerating the penetration of plasma from the discharge gap into the cavity of the cathode.As a result, a CPD region is formed in the cavity where ions are accelerated causing secondary electron emission.Electrons emitted from the side surfaces of the cavity pass through the CPD region without collisions (lc=0.024 cm<λ=0.030 cm)and are accelerated to energies of ε=eUc~650 eV (figure 9(a)).This is reflected in the reversed field from the opposite side, making oscillatory movements in the cathode cavity and repeatedly returning to the region of negative glow.
As a result of such oscillations of electrons inside the cathode cavity, a multiple increase in gas ionisation occurs,while areas of negative glow at the side surfaces of the slot overlap and the hollow cathode effect is fully manifested.The presence of high energy electrons in the cathode cavity is also confirmed by the results of numerical modelling(figure 9(b)).Instead of oscillating between the walls of the cathode cavity,electrons accelerated inside the cavity in the cathode move towards the anode under the influence of an external electric field, resulting in an increase in their concentration at the cavity exit.At the same time, due to energy relaxation,accelerated electrons at the exit move to the energy region of the maximum values for excitation and ionisation crosssections.These two factors lead to the formation of a region having the maximum concentration of excited atoms and charged particles at the cathode cavity exit(figures 8(d),10(a)and (b)).The electron concentration in this plasma structure of ne~1015cm−3is an order of magnitude greater than that obtaining in the discharge gap (figures 8(d) and 10(a)).The concentration of excited atoms at the maximum reaches the value of 1014cm-3(figure 10(b)).
The results of numerical modelling appear to be in good agreement with those obtained experimentally (figure 3(a)),where the bright elliptical glow region at the cathode cavity exit is visible in the optical picture of the discharge.The concentration of free electrons in the discharge gap obtained in the numerical experiment (ne~1014cm-3) is also consistent with the estimate of the electron concentration using conductivity (ne~8×1013cm-3) and given in table 1.

Figure 11.The results of numerical simulation of the dynamics of the spatio-temporal distribution of electron density in the discharge gap at U0=1 kV and p=10 Torr.(a) t=50 ns, (b) t=85 ns, (c) t=150 ns, (d) t=400 ns.
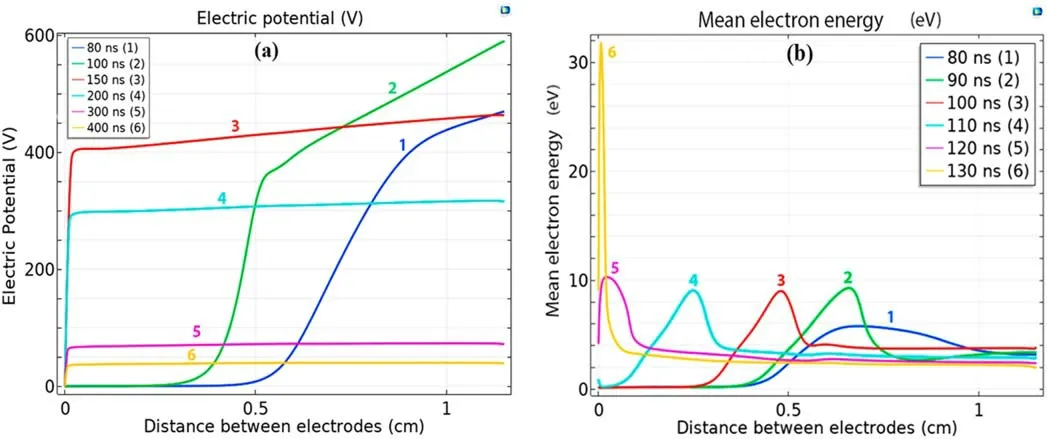
Figure 12.The results of numerical simulation of the distribution of the electric field potential(a)and the distribution of the average electron energy (b) in the center of the discharge gap at U0=1 kV and p=10 Torr.
Some accelerated electrons (Λ~0.68 cm) reach the anode to provide ionisation both in the entire gap and on the surface of the anode,as well as compensating for ionic losses at the cathode.
The current density of the anomalous glow discharge in argon can be estimated using the approximation formula[20]:

An estimation of current density according to formula(2)for the conditions of table 1 at t=200 ns gives the value JAD~0.36 A cm−2,which is almost 50 times lower than the current density obtained from the experimental data for the considered discharge (table 1).Such a large difference in current density indicates that a transverse discharge generated by a slot cathode is fundamentally different from an anomalous discharge and is of independent interest for studying this type of discharge.The obtained results demonstrate the applicability of the studied discharge for obtaining high current densities at relatively low voltages applied to the electrodes.The formation of an extended bright plasma column is particularly appropriate as an extended optical radiation source for various applied problems.
4.3.Calculation results at gas pressure of 10 Torr
Figures 11-13 present the numerical modelling results of the development dynamics of ionisation processes,along with the spatial distribution of the main plasma discharge parameters obtained for a gas pressure of 10 Torr.The calculations indicate that the results obtained for a gas pressure of 10 Torr are qualitatively similar to those obtained for a gas pressure of 5 Torr.Indeed,even at a gas pressure of 10 Torr,two extreme ionisation waves are initially formed followed by a third ionisation wave in the centre of the discharge gap(figures 11(a) and (b)).

Figure 13.The results of numerical simulation of the distribution of electron density(a)and the density of excited atoms(b)in the center of the discharge gap at U0=1 kV and p=10 Torr.
At p=10 Torr,ionisation waves are formed earlier than those at p=5 Torr; here, the concentration of charged particles in the discharge gap grows faster,while the propagation speed of the ionisation wave decreases.When the density of charged particles reaches 1012cm-3, the plasma begins to penetrate into the cathode cavity and the plasma column contracts to the centre of the discharge gap (figure 11(c)).Next, the cathode layer forms; this is followed by the production of charged particles inside the cathode cavity.The electrons emitted from the side surfaces of the cavity in the cathode pass the CPD region without collisions(for this case,lc=0.012 cm <λ=0.015 cm) and are accelerated to energies of ε=eUc~400 eV(figure 12(a)).Further,accelerated electrons result in overlapping areas of negative glow at the side surfaces of the cathode slot and the hollow cathode effect is manifested.The generation of accelerated electrons in the cathode cavity is confirmed by the numerical modelling results (figure 12(b)).The average electron energy at the bottom of the cathode slot of around 32 eV (figure 12(b)) is almost three times less than that at p=5 Torr (figure 9(b)).
The development of ionisation processes in the discharge also leads to the formation of a plasma structure at the exit of the cathode cavity with a maximum concentration of charged particles (figure 11(d)), promoting the self-limiting discharge current effect as discovered and studied in [23].
The electron concentration in this plasma structure equal to ne~1015cm-3is an order of magnitude greater than in the discharge gap (figure 13(a)).Under similar conditions, the concentration of excited argon atoms behaves in a complex way.Initially, the atom electronic excitation processes proceed mainly in the discharge gap between the electrodes;however, after 120 ns, the density of excited atoms reaches a maximum of~5×1013cm-3at the entrance to the cathode cavity (figure 13(b)).Further, an increase is observed in the concentration of excited atoms inside the cathode cavity,especially at the cavity base; after about 200 ns, their characteristic spatial distribution is established with a sharp density peak of~1014cm-3at the cavity base.By this time, the density of excited atoms inside the cathode cavity and in the discharge gap drops to ~5×1012cm-3.
It is interesting to note that the spatiotemporal distribution of the density of excited atoms appears to be appropriate for qualitative confirmation of the presence of high-energy electrons in the discharge,as well as for estimating the energy of these electrons and their density distribution in the discharge gap.At p=1 Torr, the maximum concentration of free electrons in the discharge comprises~1011cm-3, with the concentration of excited atoms reaching ~4×1011cm-3at the cathode cavity exit followed by a slight decrease in the gap between the electrodes (figures 6(a) and (b)).This indicates that the generation of high-energy electrons occurs at the cathode cavity exit and that the energy of these electrons is sufficient for carrying out multiple acts of atomic excitation and ionisation in the discharge gap.
At a pressure of p=5 Torr,the maximum concentration of free electrons in the discharge is~1015cm-3, with the concentration of excited atoms equal to ~2×1014cm-3distributed over the entire length of the discharge with a small maximum at the exit from the cathode cavity(figures 8(a)and(b)).Therefore, in this case, accelerated electrons are generated both inside the cathode cavity and in the gap; nevertheless, the energy of these electrons is smaller as compared to p=1 Torr conditions.At a gas pressure of p=10 Torr,the concentration of free electrons turns out to be an order of magnitude higher than the concentration of excited atoms at the base of the cathode cavity and more than two orders of magnitude higher than in the rest of the discharge gap.Therefore, in this particular case, accelerated electrons are only generated inside the cathode cavity; this is due to that they have an insufficient quantity in the discharge gap and an energy of even less than that at p=5 Torr (figure 12(b)).Indeed,the mean free path of accelerated electrons comprises
Λ~0.23 cm;attainment of the middle of the discharge gap is not observed for these electrons due to a relaxation of the electron energy in inelastic collisions with atoms.
5.Conclusion
The experimental study and numerical modelling of the formation and development dynamics of a high-voltage transverse nanosecond discharge generated by a slot cathode in argon indicate that, at gas pressures from 1 to 10 Torr,ionisation waves formed near the anode surface are propagated to the cathode at a speed of about 107cm s−1with the propagation velocity of ionisation wave decreasing with an increase in the gas pressure.At a pressure of p=1 Torr, a classical version of high-voltage discharge is realised with no penetration of plasma into the cathode cavity or hollow cathode effect observed to take place.The CPD region is formed between the cathode and the plasma column and electrons, which pass this region without collisions and are accelerated and freely reach the surface of the anode.An increase in gas pressure to 5 Torr leads to a penetration of plasma into the cathode cavity with the formation of a CPD region in the cavity,where ions are accelerated,subsequently causing secondary electron emission.The electrons emitted from the side surfaces of the cavity pass through the CPD region without collisions to oscillate inside the cathode cavity.This leads to overlapping areas of negative glow at the side surfaces of the cathode slot and a manifestation of the hollow cathode effect.
At p=10 Torr, the modelling results qualitatively coincide with the results at p=5 Torr;however,in this case,no accelerated electrons are observed in the gap between the electrodes due to a relaxation in their energy, which occurs inside the cathode cavity as well as at the exit therefrom.In both cases, a single plasma structure is formed at the exit of the cathode cavity with the concentration of charged particles being an order of magnitude higher than in the rest of the gap,producing the self-limiting discharge current effect.
The results of numerical modelling are in good agreement with those obtained over the course of experimental studies.
Acknowledgments
This work was supported by a grant from the Russian Foundation for Basic Research No.19-32-90179 and state assignment FZNZ-2020-0002.
ORCID iDs
N A ASHURBEKOV https://orcid.org/0000-0003-3045-9800
 Plasma Science and Technology2020年12期
- Plasma Science and Technology的其它文章
- A large-grain-size thick-film polycrystalline diamond detector for x-ray detection
- In vitro study of nonthermal atmospheric pressure plasma in improving the durability of the dentin-adhesive interface with an etch-and-rinse system
- Coupling model of AC filter branch in SF6 circuit breaker during the break process
- Molecular dynamics simulations of the interaction between OH radicals in plasma with poly-β-1-6-N-acetylglucosamine
- New method for rekindling the explosive waves in Maxwellian space plasmas
- Mitigation of blackout problem for reentry vehicle in traveling magnetic field with induced current