Seasonal Variations of Picoeukaryote Community Structure in Zhoushan Fishing Ground, East China Sea
YANG Mingyu, LIU Qiang, MI Chunrong, and ZHAO Shujiang
Seasonal Variations of Picoeukaryote Community Structure in Zhoushan Fishing Ground, East China Sea
YANG Mingyu1), #, LIU Qiang1), 2), #, MI Chunrong3), and ZHAO Shujiang1), *
1)National Engineering Research Center of Marine Facilities Aquaculture, Zhejiang Ocean University, Zhoushan 316022, China 2) Chinese Research Academy of Environmental Sciences, Institute of Water Environment Science, Beijing 100020, China 3)Institute of Zoology, Chinese Academy of Sciences, Beijing 100000, China
Picoeukaryotes (<2–3μm) are major oceanic primary producers and play a crucial role for the functioning of marine ecosystems. However, the community structure of such communities remains poorly understood, especially in the East China Sea (ECS). We investigated the seasonal variations of abundance and diversity of picoeukaryotes, and recorded environmental variables, along a transect in Zhoushan Fishing Ground. High-throughput sequencing was used for sequencing the V4–V5 variable region within the 18S rRNA gene to analyze genetic diversity and relative abundance of picoeukaryotes. A total of 40 phyla, 68 classes, 99 orders, 126 families, and 140 genera were observed.The estimated richness and diversity indices were both higher in each season. The composition and dominant picoeukaryotes changed significantly at the class level with the seasons alternating. Basidiomycota, Ciliophora, Ascomycota and Cryptomonadales were observed throughout the year. The Linear Discriminant Analysis (LDA) revealed the predominant discriminant taxa of four seasonal groups. Redundancy analysis (RDA) showed that NO2−and salinity played very important roles to picoeukaryotes for all the spring samples and DS5 sample in winter, PO43−and pH affected mostly picoeukaryotes for winter samples and autumn samples.
picoeukaryotes; Zhoushan Fishing Ground; high-throughput sequencing; 18S rRNA gene; community structure; diversity
1 Introduction
Picoeukaryotes (Peuk), defined operationally as cells no more than 2–3μm in diameter, are the most abundance of eukaryotic species on the earth (Li 1994; Jardillier., 2010). They appear in the global marine environments and are considered as basic components of marine ecosystems in the oceans in the light of their significant biomass and high primary productivity (Falkowski., 2008; Massana., 2011; Caron., 2012). Picoeukaryotes, as a critical member of the micro-food web, mainly include picophytoplankton and various protozoa, organically linked the micro-food web and the classic food web by feeding on ciliates (Christaki., 2009).
Due to its extremely small cell size and the lack of significant morphological features, it was only since the introduction of flow cytometry into the field of microbial ecology in the 1980s that the research on picoeukaryotes had been promoted (Chisholm., 1988). The research on picoeukaryotes in the world lagged behind the prokaryote for about 10 years. Early studies were conducted to investigate their spatial and temporal distribution and abundance (Wang., 2008; Le., 2015), but the research on its molecular diversity is relatively deficient. Hitherto, the applications of denaturing gradient gel electrophoresis (DGGE) or restriction fragment length polymorphism (RFLP) methods in the study of marine picoeukaryotes are more common. For instance, Díez. (2001) used DGGE to explore the diversity of picoeukaryotes in natural marine assemblages. Balzano. (2012) used T-RFLP analysis to investigated the diversity of picoeukaryotes in the northeastern Pacific and the Arctic Ocean. Unfortunately, the potential cloning biases and the high cost of RFLP still has some limitations in practical research. The newly devised high throughput sequencing (HTS) technology is cloning independent and massively parallel, by providing the deep inventories needed both for taxonomic descriptions and sample comparisons, it has enabled microbial ecology to advance greatly (Massana., 2015).
The Zhoushan Fishing Ground adjoins the Changjiang Estuary, located in the East China Sea (ECS). It has a typical community of estuary ecosystems with unique characteristics of biogeochemical cycles. No reports of picoeukaryote communities have been found in this sea area until now. 24 surface water samples were collected from 6 coastal stations across four representative seasons, flow cytometry was used to determinate the abundance of picoeukaryotes for each sample in four seasons. High throughput sequencing (HTS) technology was used to reveal the community structure of picoeukaryotes in the Zhoushan Fishing Ground, ECS. At the same time, Canonical Correspondence Analysis (CCA) was used to explore the relationship between the community structure of picoeukaryotes and environmental factors. This study will help to understand the community structure and temporal-spatial distribution pattern of global oceanic picoeukaryote.
2 Materials and Methods
2.1 Sampling and Ecological Factors Collection
In this study, a total of 6 stations were set up, S1–S6 (Fig.1). Samples were collected on November 11, 2015 (Autumn), January 8, 2016 (Winter), May 7, 2016 (Spring), and August 2, 2016 (Summer). The samples were divided into four seasonal groups, the spring group including CS1, CS2, CS3, CS4, CS5, CS6; the summer group including XS1, XS1, XS2, XS3, XS4, XS5, XS6; the autumn group including QS1, QS2, QS3, QS4, QS5, QS6; and the winter group consisted of DS1, DS2, DS3, DS4, DS5, DS6.
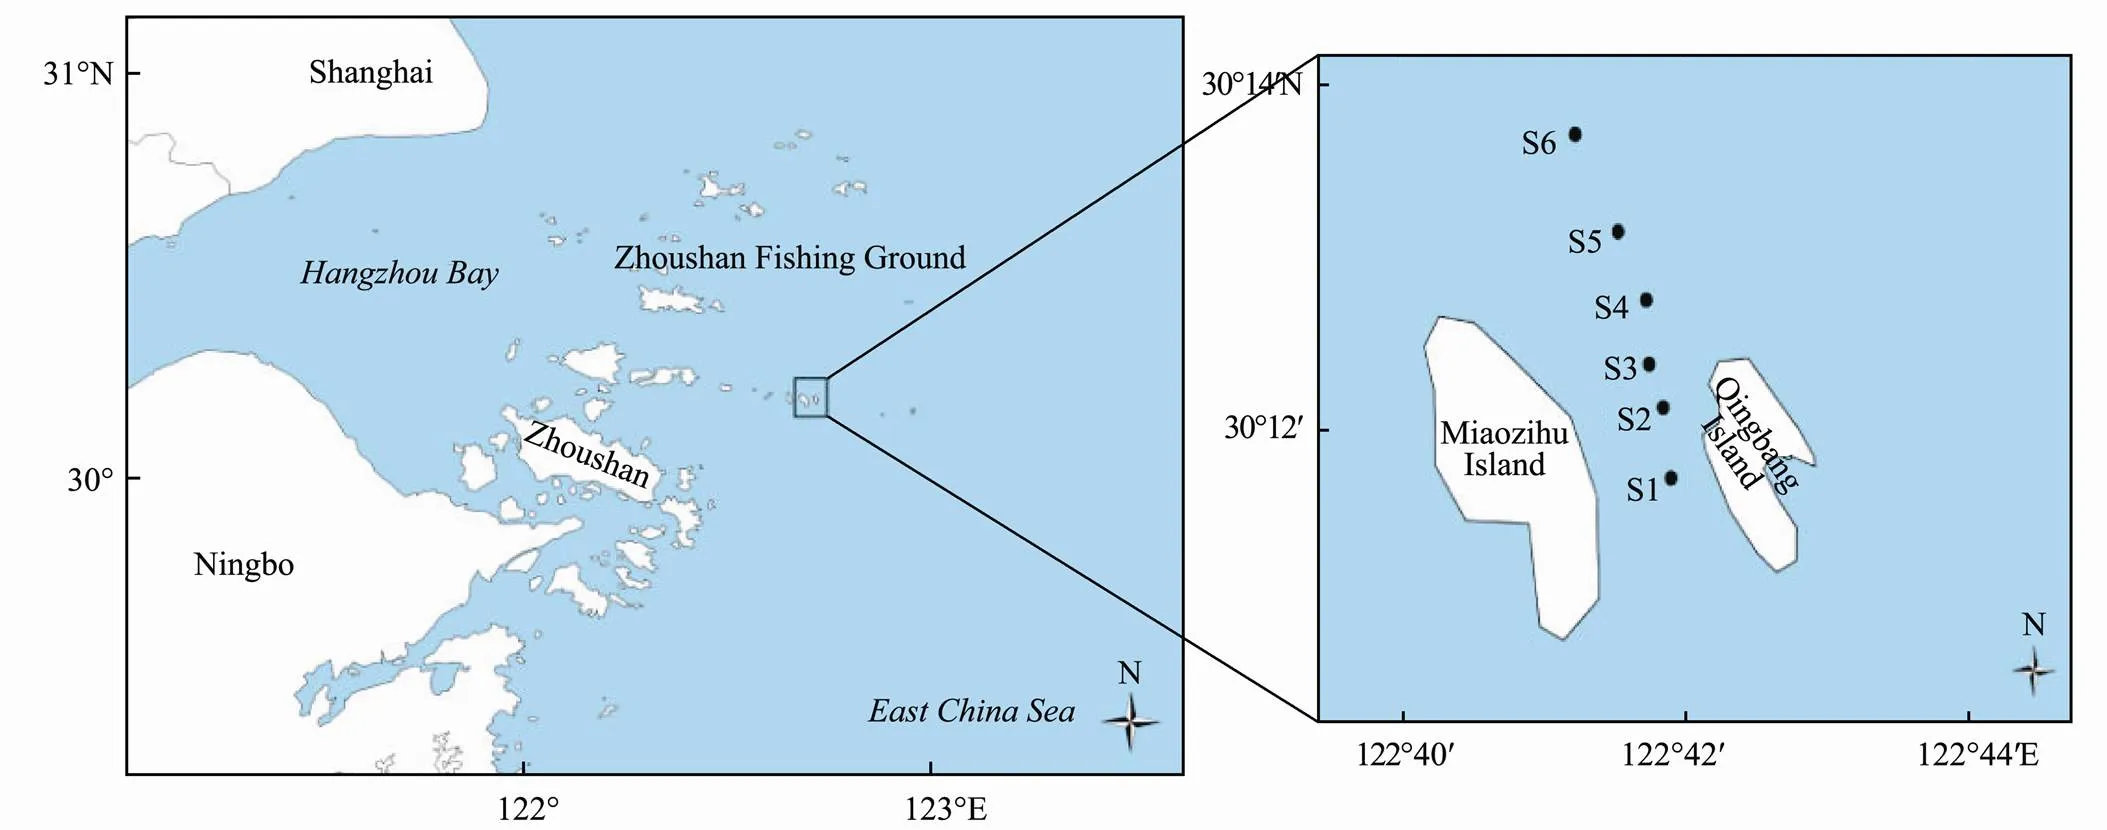
Fig.1 Locations of sampling stations in Zhoushan Fishing Ground.
For the research on molecular diversity of picoeukaryotes, surface (0.5m) seawater samples (1L) were collected from six stations with Niskin bottles respectively. Each water sample was filtered first through a 3 μm and then through a 0.22μm pore-sized polysulphone/ polycarbonate filter (47-mm diameter, Millipore, USA) using a gentle vacuum pump (< 20cm Hg). The 0.22μm filter was then transferred to a 2mL tube and covered with 1.5mL of lysis buffer. Samples were flash frozen in liquid nitrogen and stored at −80℃ until DNA extraction. For flow cytometer counting of picoeukaryotes, aliquots of 1.8mL seawaters were fixed with a mix of glutaraldehyde (0.5% final concentrations), frozen in liquid nitrogen, and stored at −80℃ until processed. physiochemical conditions, including pH, salinity, temperature, dissolved oxygen were recorded with a YSI handheld meter (YSI, proplus, USA). Nutrient parameters were detected by Automatic intermittent chemical analyzer (Smartchem-200, Italy), including phosphate, nitrate, nitrite, and ammonia nitrogen.
2.2 Determination of the Abundance of Picoeukaryotes
Flow cytometry (BECKMAN COULTER FC500, USA) was used to determinate the abundance of picoeukaryotes. The samples were thawed in a 37℃ constant temperature water bath after removed from the −80℃ refrigerator, then placed in Vortex Genie®2 Vortex oscillator shaking well. 990μL sample water and 10μL standard fluorescent globule were transferred to analysis tube. Determination was performed according to the project of Jiao (1999) with some adjustments.
2.3 DNA Extraction, 18S rRNA Gene Amplification, and Illumina MiSeq Sequencing
The total DNA was extracted with OMEGA Water DNA Kit (D525-01, USA), and then was checked by UV spectrophotometer (NANO Drop 2000, USA). All the qualified genomic DNA was High throughput sequenced and analyzed by the Shanghai Majorbio Bio-pharm Biotechnology Co. Ltd. (Shanghai, China). The V4–V5 hypervariable regions of the 18S rRNA gene were amplified by polymerase chain reaction (PCR) (95℃ for 3min, followed by 35 cycles at 95℃ for 30s, 55℃ for 30s, and 72℃ for 45s and a final extension at 72℃ for 10min) with primers SSU 0817F (5’-TTAGCATGGAATAAT RRAATAGGA-3’) and 1196R(5’-TCTGGACCTGGTGA GTTTCC-3’) (Johannes., 2010), PCR reactions were performed in a triplicate 20μL mixture containing 4μL of 5×FastPfu Buffer, 2μL of 2.5mmolL−1dNTPs, 0.8μL of each primer (5mmolL−1), 0.4μL of FastPfu Polymerase and 10ng of template DNA. The PCR products were then purified using an AxyPrep TM DNA Gel Extraction Kit (Axygen Biosciences, Union City, CA), Subsequently quantified by QuantiFluor™-ST blue fluorescent quantification system (Promega USA), each sample were mixed in respective proportions according to sequencing requirement. Purified amplicons were pooled in equimolar and paired-end sequenced (2×300) on an Illumina MiSeq platform according to the standard protocols.
The raw reads in this study were deposited into the NCBI Sequence Read Archive (SRA) database (http:// www.ncbi.nlm.nih.gov/Traces/sra), accession number: SRP104829.
2.4 Data Processing
Usearch software platform (version 7.1, http://drive5. com/uparse/) were used to optimize the sequence of the sequencing and minimize the effects of random sequencing errors (Huse., 2007). Operational Taxonomic Units (OTU) clustering analysis was performed on UPARSE (version 7.1, http://drive5.com/uparse/) at 97% similarity level, and the recognition and removal of the chimera were performed using UCHIME. Multiple diversity indices of OTU was analyzed based on the results of OTU clustering, and statistical analysis of community structure can be carried out at each classification level based on taxonomic information. Finally, a series of in- depth statistical and visual analyzes, such as community structure and phylogeny, was conducted.
2.5 Statistical Analysis
Species diversity index (Shannon, Simpson) and richness index (ACE, Chao 1) of picoeukaryote communities were calculated using the Mothur platform (version v.1.30.1, http://www.mothur.org/wiki/Schloss_SOP#AlpHa_diversity) (Schloss., 2011). Meanwhile, rarefaction analysis was performed using Mothur and the rarefaction curve was drawn using the R language package (Amato., 2013). Utilizing the evolutionary relationship and abundance information between the sequences in each sample the evolutionary distance between samples was calculated, and then the β diversity and species differences analysis was performed. The clustering of ecological factors was performed using the R ‘vegan’ package, then redundancy analysis (RDA) was carried out to show the relationships between environmental variables and picoeukaryote community structure (Blanchet., 2016).
3 Results
3.1 Environmental Characteristics in Zhoushan Fishing Ground
The ecological factor data collected in 4 cruises were shown in Table 1. The lowest and highest temperatures of surface seawater appeared in winter and summer, respectively, and varied greatly throughout the year (12.74– 27.01), with little change in the same season between stations and with no obvious regularity. The salinity was highest in spring and lowest in autumn. The salinity in each station in the same season changed little, but the salinity tended to be larger with the distance from the shore. In the sampling area, the dissolved oxygen concentration in winter was highest overall, with little difference in other seasons. pH changed slightly throughout the year, roughly reflected the trend of autumn> winter> spring> summer. The inorganic nutrient concentration fluctuated greatly in the whole year. PO43−has the lowest concentration in spring, while the NO3−concentration reached the highest level in spring.
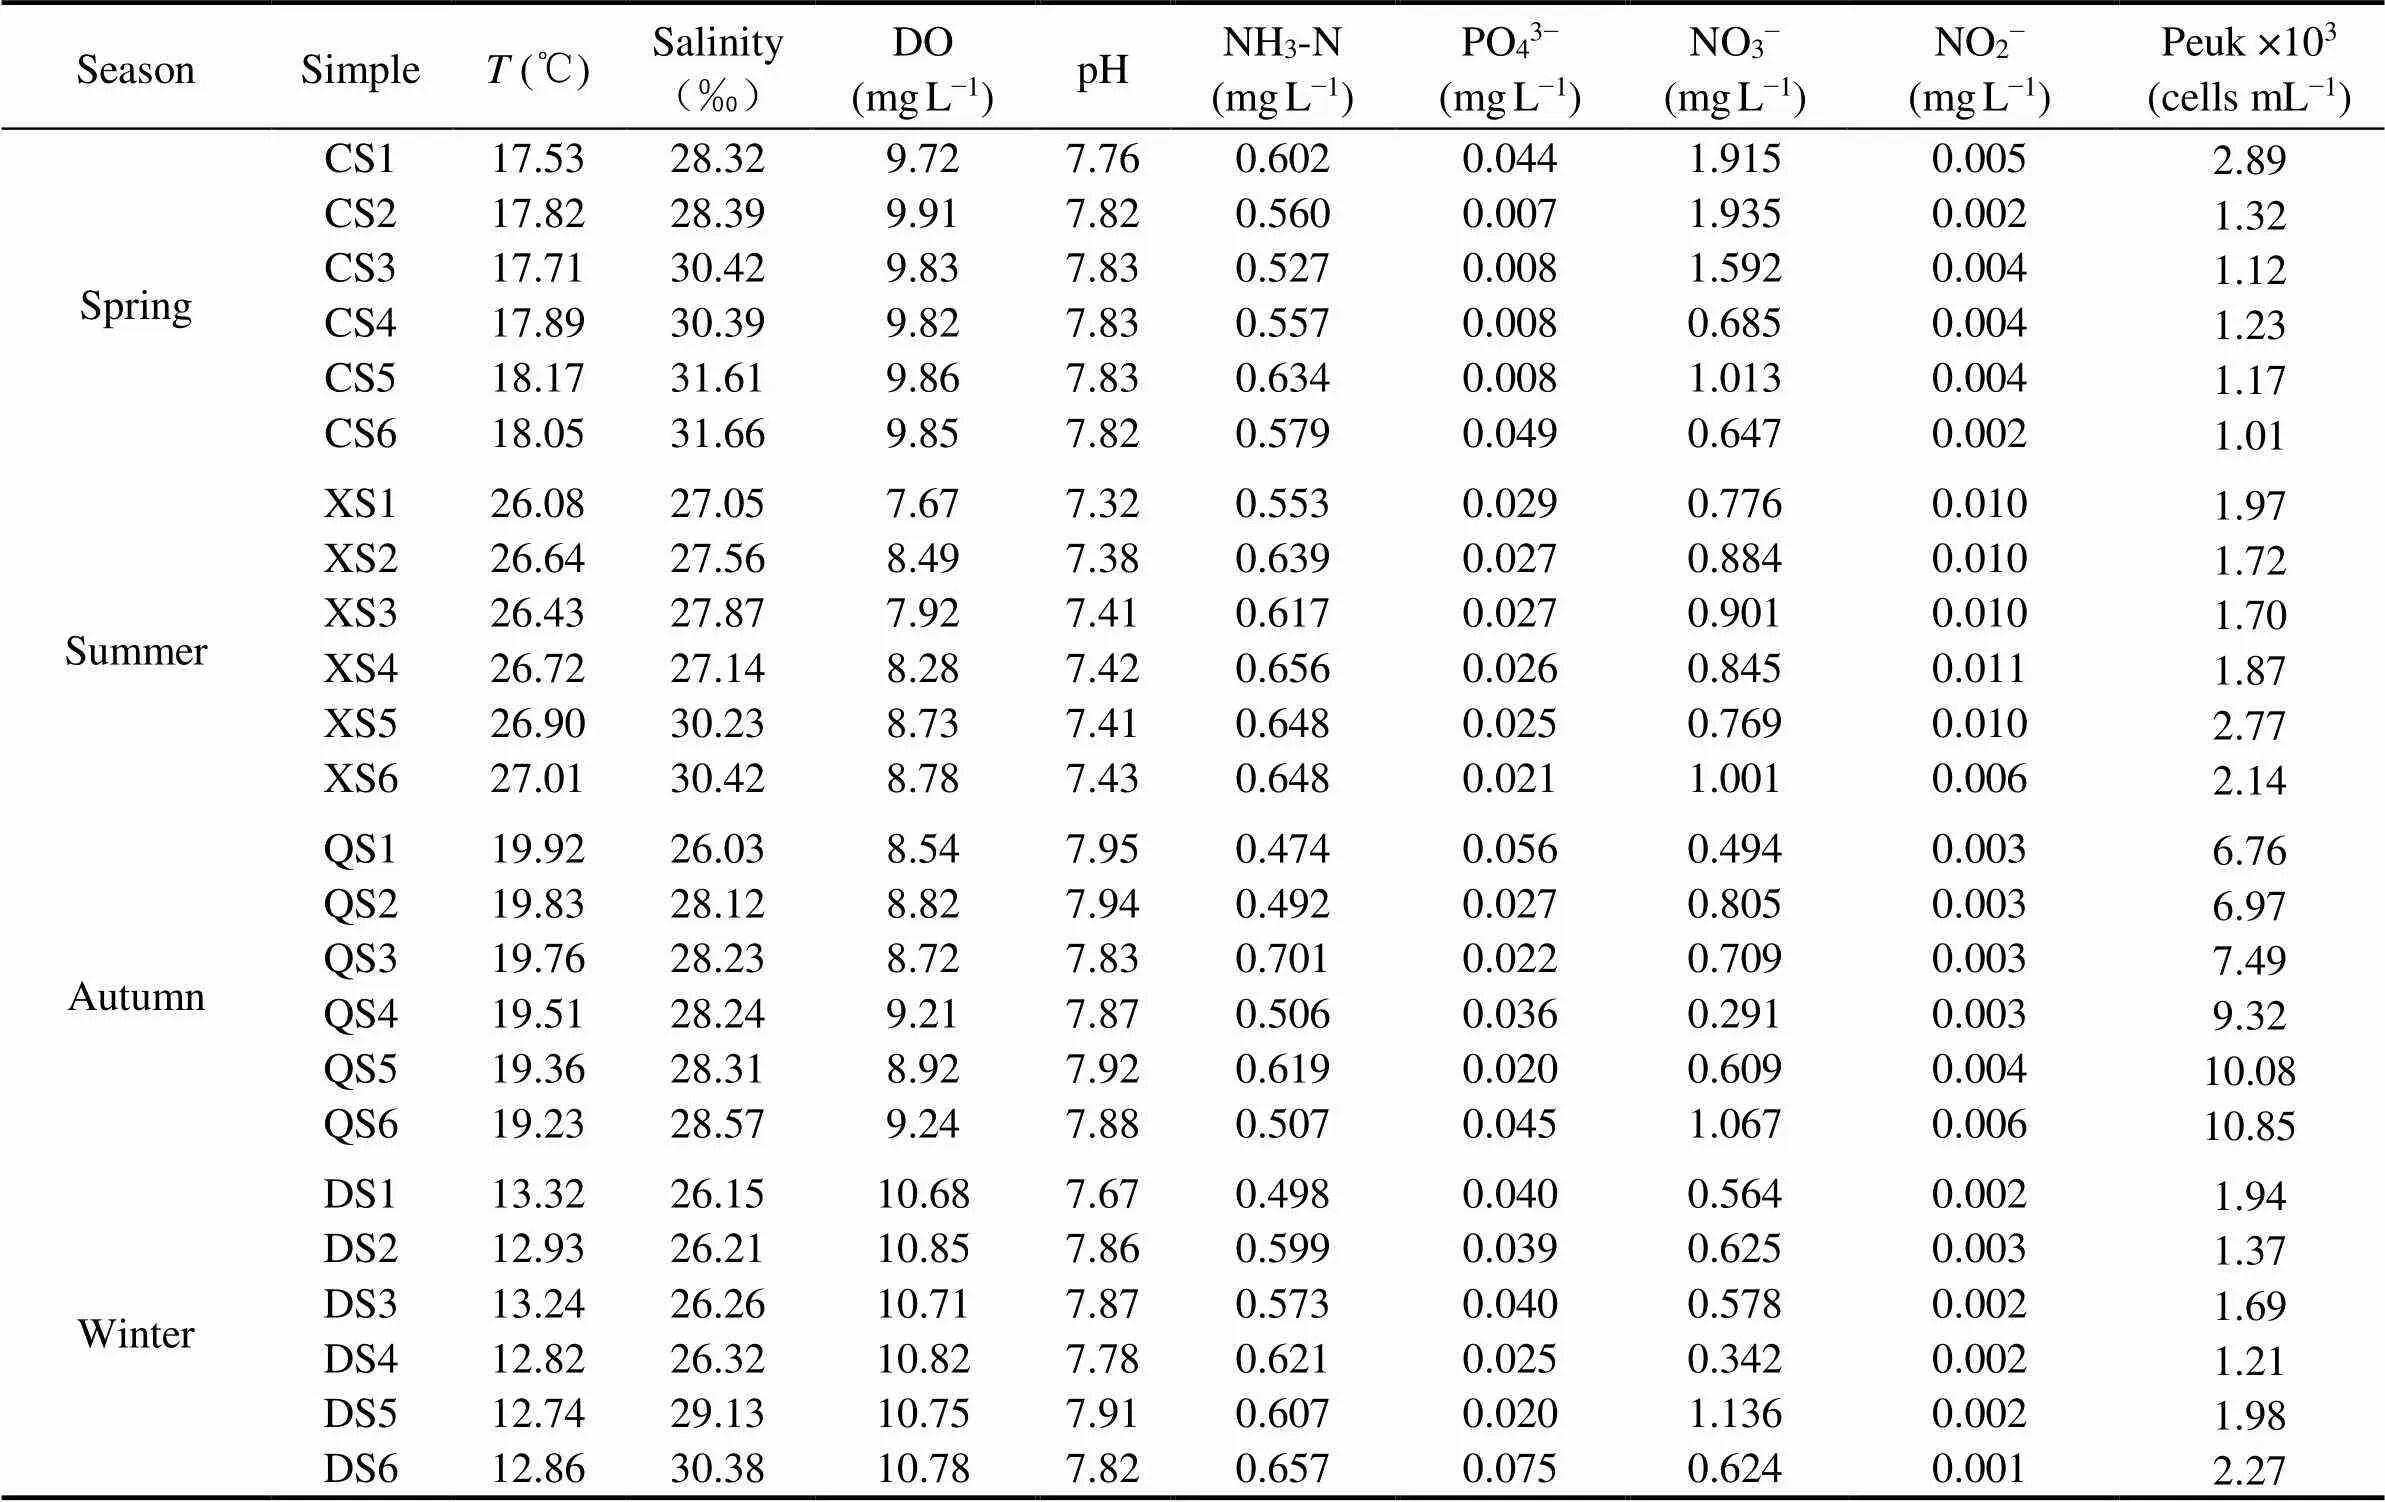
Table 1 The ecological factors of each sampling station
3.2 Picoeukaryote Abundance and Diversity
The analysis of similarities (ANOSIM) based on Bray-Curtis distance was used to test the significance of grouping,=0.695,<0.001 (999 permutations).values ranged from −1 to +1. The closer thevalue got to 1, the greater the difference between groups was, and the smaller thevalue was (close to 1), no obvious difference among groups was observed. The research result indicated that community structures of picoeukaryote between different seasons were of significant difference.
The flow cytometry results were shown in Table 1. The average abundance of picoeukaryotes was highest in autumn (8.58×10³cellsmL−1), while there were little differences among other three seasons ((1.46–2.03)×103cellsmL−1), with the increasing order from summer, winter to spring. The rarefaction curve can compare the difference of species abundance in samples with different amount of sequencing data, and can also be used to indicate whether the amount of sequencing data in the sample is reasonable. When the number of sequence reads reached 28000, all curves were basically flattened, indicating that the amount of sequencing data was very reasonable and another much more data was hard to output further new OTU (Fig.2). But the abundance differences varied greatly among stations in the same season. Generally, the abundance in more distant station was higher than that in near station to the island.

Fig.2 Rarefaction curves based on the 97% similarity level.
ACE index and Chao 1 index were calculated to evaluate the abundance of picoeukaryotes (Table 2). The average ACE index was highest (131.34) in autumn, lowest (87.91) in spring. The Chao 1 index was highest (134.16) in autumn, lowest (89.23) in spring.

Table 2 The species richness estimates of the 24 seawater samples
Shannon index and Simpson index were calculated to evaluate picoeukaryote species diversity (Table 2). The average Shannon index was highest (2.111) in summer, lowest (1.560) in spring. The Simpson index was highest (0.487) in spring, lowest (0.216) in summer.
3.3 Community Similarity Analysis
The UPGMA (Unweighted pair group method with arithmetic mean) dendrogram can be used to describe and compare the evolutionary distance between samples, and it is a hierarchical clustering analysis based on the Bray- Curtis distance matrix. Obviously, the OTU-level data produced the highest resolution enough to differentiate the picoeukaryote communities. 24 samples were divided into seven small groups in the dendrogram, and most of the samples in each season clustered together with relatively high similarity (Fig.3). Group 1 and Group 7 were evidently different from the other groups. Eurotiomycetes (>38.58%) in group 2 was one of the dominant class, Cryptomonadales_uncultured in group 4 was the most dominant class, Cryptomonadales_uncultured and Intramacronucleata in Group 6 was the dominant classes. Cryptomonadales_uncultured in three samples in Group 3 was the most dominant class while Anthozoa and Ctenophora were not detected in the same samples. Cryptomonadales_uncultured and Intramacronucleata in Group 5 were the dominant classes while Hydrozoa was not detected in the same samples.
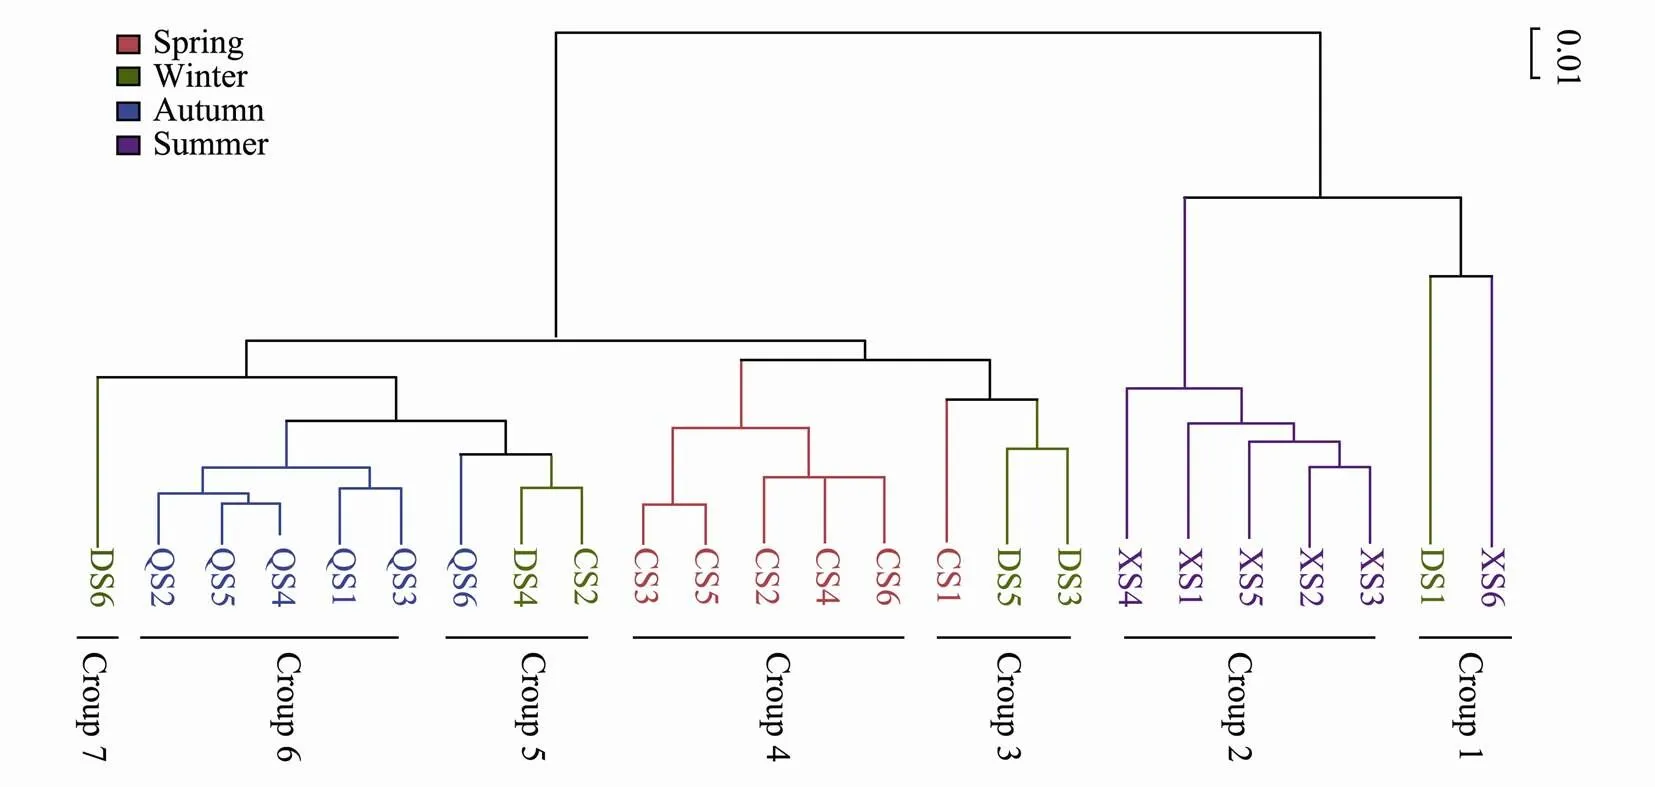
Fig.3 UPGMA dendrogram based on the Bray-Curtis distance matrix from an OTU table with 24 samples.
3.4 Composition and Structure of Picoeukaryote Community
Overall, 40 phyla, 68 classes, 99 orders, 126 families, and 140 genera were observed in the samples. The composition and structure of the picoeukaryote communities in the different samples were compared at the class level (Fig.4). The dominant taxa were Cryptomonadales_un- cultured (68.49%), Intramacronucleata (9.93%) and Dothideomycetes (5.74%) in spring; The dominant taxa were Eurotiomycetes (36.23), Sordariomycetes (20.62%), Dothideomycetes (14.95%) and Saccharomycetes (8.87%) in summer; The dominant taxa were Cryptomonadales_un- cultured (50.18%) and Intramacronucleata (37.06%) in autumn; The dominant taxa were Cryptomonadales_un- cultured (45.81%), Intramacronucleata (21.15%) and Sordariomycetes (8.69%) in winter (Fig.4A). Significant differences in the community composition were observed both between the seasons and between stations. Cryptomonadales_uncultured were the dominant taxa in most samples except in summer, with the exception that Anthozoa (29.89%) were the dominant taxa only in DS1 station in the winter group. While the composition and structure of picoeukaryote communities in summer were complicated, mostly Eurotiomycetes as the dominant taxa (Fig.4B).

Fig.4 Composition and structure of picoeukaryote communities in different seasons (A) and different samples (B).
3.5 Relationships Between Environmental Variables and Picoeukaryote Community Structure
Many discriminant taxa of the spring samples were positively correlated with dissolved oxygen, many discriminant taxa of the autumn samples were positively correlated with pH, many discriminant taxa of the summer samples were positively correlated with temperature, many discriminant taxa of the winter samples were positively correlated with NO3−(Fig.5).
The NMDS plot (stress < 0.05) illustrated the composition differences of the picoeukaryote communities among the 24 samples of the 4 groups (Fig.6). The samples were mainly assembled into two large clusters, including the summer group and the other groups. Compared with the other three groups, the picoeukaryote communities in summer showed extremely high heterogeneity, the differences between the groups were extremely large, and the composition of the communities within the groups also showed relatively high variability in each sample. An interesting phenomenon was observed in the autumn group and summer groups that the community composition in station 6 was significantly different from other stations in the same season. But it was station 1 in spring and winter that the community composition was significantly different from other stations.
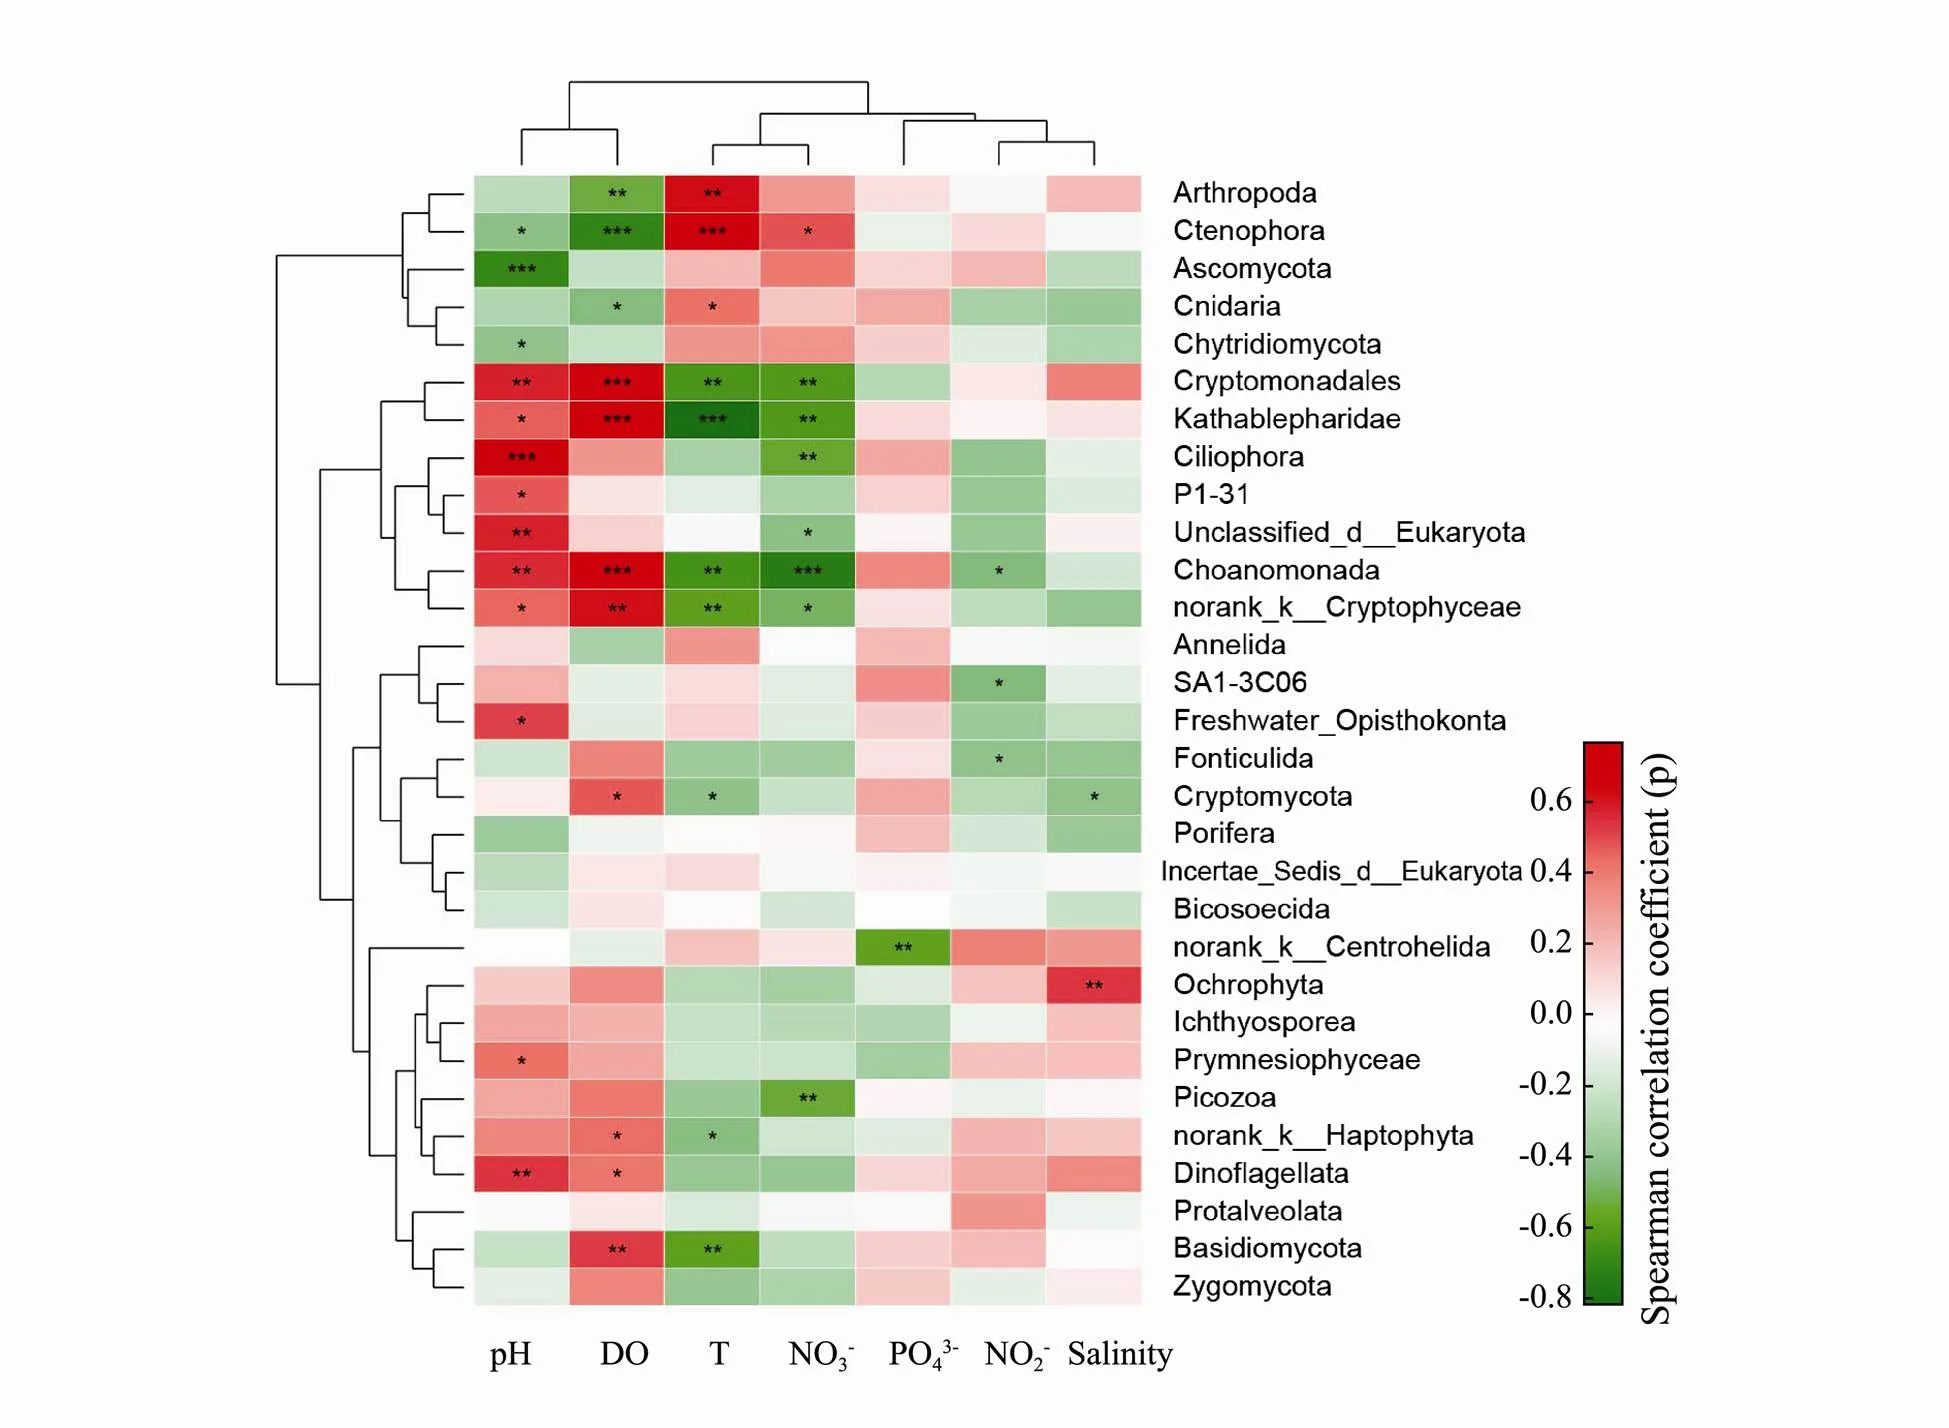
Fig.5 Correlations between highly abundant discriminant taxa (phylum level) of four groups and ecological factors. The asterisks in the grids indicate significant Spearman correlations as ***P<0.001, **P<0.01, *P<0.05.
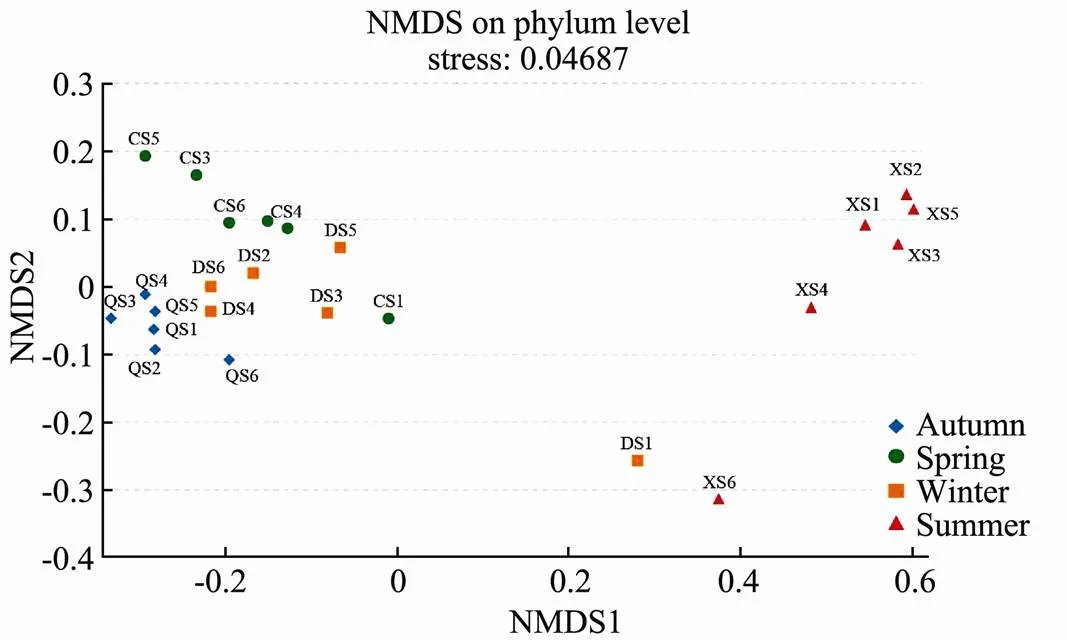
Fig.6 NMDS diagram based on Bray-Curtis similarity relating the picoeukaryote assemblages.
The RDA was used to show the relationships between environmental variables and picoeukaryote community structure (Fig.7). The eigenvalues of the first two axes were 0.529 and 0.091. The first two axes could explain 78.20% and 5.90% of the picoeukaryote variation. For the summer samples, temperature and NO3−had the highest influence. For the spring samples and DS5 sample in winter, NO2−and salinity played very important roles. Winter samples and autumn samples were mostly affected by PO43−and pH. The result also showed that there were large seasonal differences in the structure of the picoeukaryotes.
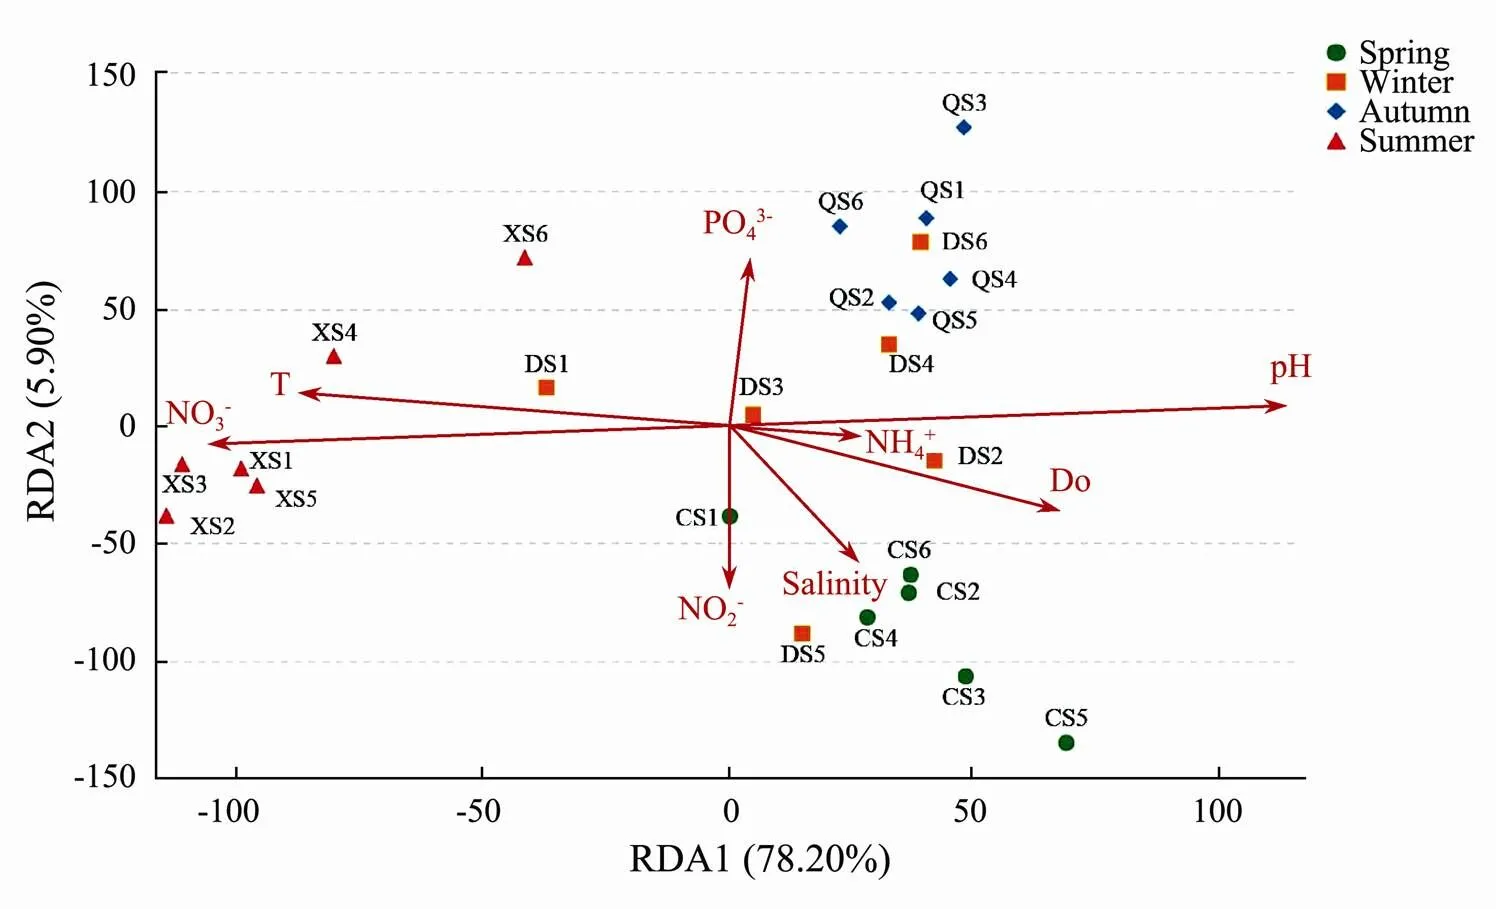
Fig.7 RDA ordination diagram of different seawater samples associated with environmental variables.
Co-occurrence of network analysis can be used to show the distribution of positive inter-phylum associations between samples and taxa. The coexistence of species in the same environmental constraints could be obtained, highlighting the similarity and difference between samples. For example, norank_k__Haptophyta and Ochrophyta and Dinoflagellata only appeared in the spring group; Ctenophora and Chytridiomycota only appeared in the summer group (Fig.8). There are no specific species in the winter and spring groups. Basidiomycota, Ciliophora, Ascomycota and Cryptomonadales were observed thro- ughout the year.
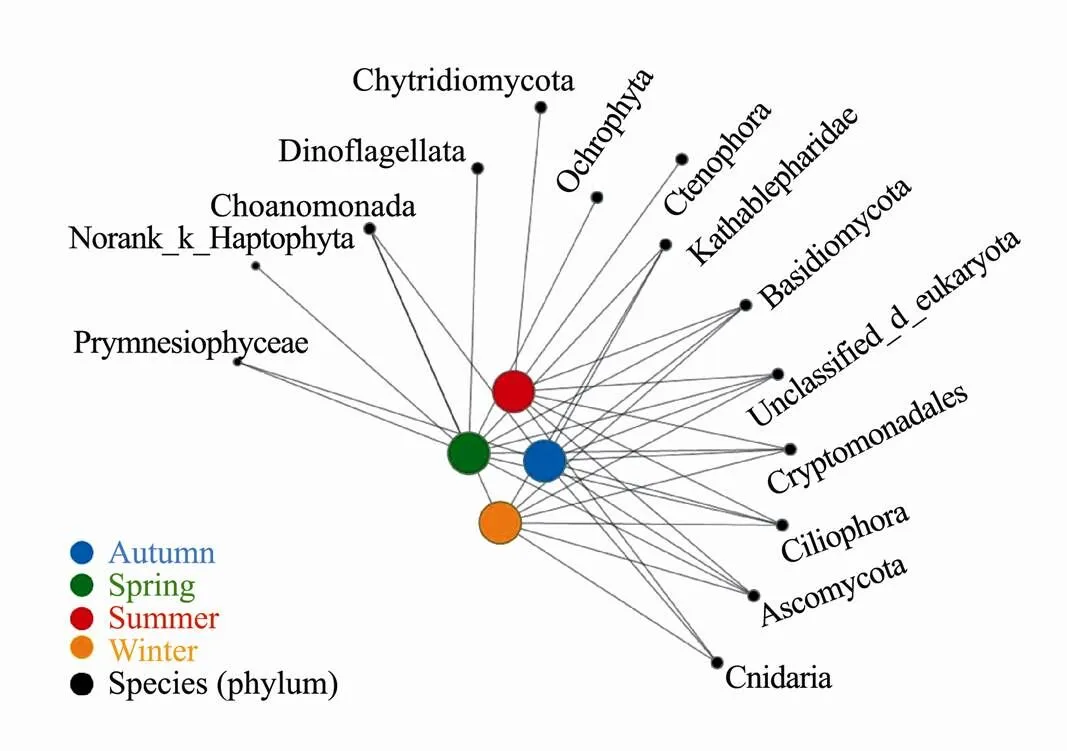
Fig.8 Weighted co-occurrence network analysis of picoeukaryotes. The nodes in the network represent the sample and the species, and the Edges in the network represent the species in the sample.
4 Discussion and Conclusions
4.1 Abundance of Picoeukaryotes in Zhoushan Fishing Ground
Zhoushan Fishing Ground is affected by five waters, including Changjiang runoff and China freshwater runoff in the west, and the warm oligotrophic Taiwan Strait waters in the south, the cool upwelling Kuroshiosubsurface waters and the warm oligotrophic Kuroshio waters in the east (Zhang., 2007). Zhoushan Fishing Ground is the largest fishing ground in China. In the research onvariations of picoplankton abundances during blooms in the ECS, picoeukaryote abundance were 0.63×10³cellscm−3and 0.55×10³cellscm−3at non-bloom and bloom stations respectively in spring, and in summer, picoeukaryote abundance were 1.02×10³cellscm−3and 2.95×10³cellscm−3at non-bloom and bloom stations respectively, that showed bloom had no significant effect on picoeukaryote abundance (Zhao., 2016). Pan. (2005) found that the average abundance of picoeukaryotes in the ECS during the autumn of different years was ×105cellsmL−1. In this research, the minimal average abundances was observed at CS6 station in spring (1.45×10³mL−1), the maximal average abundances of picoeukaryotes at QS6 station in autumn (8.58×10³mL−1), nearly 6 times higher than the former. It was reported that picoeukaryotes were more abundant in the winter than in the summer (Jiao., 2005; Chen., 2011),In this study, the minimal and maximal abundance of picoeukaryotes occurred in spring and autumn, respectively, which might be related to the hydrological elements of Zhoushan Fishing Ground. The research area is highly affected by the warm currents from Taiwan Strait and the cold water mass from Yellow Sea, resulting in unique marine hydrological characteristics.It was noteworthy that there was a small-scale offshore fish farming base fornear station 1,low nutrient levels due to suspension of farming in spring might also lead to lower picoeukaryote abundance(Tarran., 1999; Estrada., 2009). The picoeukaryote cell abundance to carbon biomass conversion factors is nearly 1319fgCcell−1(Buitenhuis., 2012),sothe average carbon biomass of four seasons in spring, summer, autumn and winter in Zhoushan Fishing Ground were1.93mgCm−3, 2.66mgCm−3, 11.32mgCm−3, 2.30 mgCm−3, respectively. The nutrient content in Zhoushan Fishing Ground area was relatively higher than offshore area, which was conducive to the growth of picoeukaryotes. Therefore, the waters in the Zhoushan Islands played an important role in ocean carbon sequestration.
4.2 Community Diversity of Picoeukaryote in Different Areas
The community composition of picoeukaryote varied greatly in different habitats. The community structure of picoeukaryotes in different seas had been investigated in the previous research, which provided a powerful data reference for the ECS research. In a research on the picoeukaryote diversity in a Chinese aquaculture area and an open sea area, the picoeukaryote community was dominated by three super groups including the Alveolates, Stramenopiles and Chlorophytes in the aquaculture area, but, the community composition exhibited significant differences in open sea area (Song., 2016). Coastal waters of the northeastern Red Sea were dominated by three main phyla, Alveolates, Stramenopiles and Chlorophytes (Acosta., 2013), Analogous results were reported in the coast of the Gulf of Mexico (Rocke., 2013). In our four cruises, the sea area of Zhoushan Fishing Ground were dominated by such phyla as follows, Cryptomonadales (68.95%) and Ascomycota (14.31%) in spring, Ascomycota (82.20%) in summer, Cryptomonadales (52.32%), Ciliophora (37.06%), Cryptomonadales (46.34%), Ascomycota (22.06%) and Ciliophora (21.15%) in winter. It could be deduced that the dominant phyla of picoeukaryotes in winter were more abundant than other seasons. Correspondingly, the diversity in winter also would be even higher. Hugerth. (2016) found that an intricate set of biotic interactions were contributing to temporal patterns among planktonic assemblages despite rapid changes in environmental conditions. The study of interactions among prokaryote and eukaryote plankton communities in Zhoushan Fishing Ground and even the ECS would have a high research value.
As one of predominant discriminant picoeukaryote taxa, Dinoflagellates showed a relatively high abundance in the spring. They are important components of marine community, and play multiple functional roles (Arndt., 2000). Although photosynthetic dinoflagellates are one of major producer in aquatic environments, some species may produce toxins, which can cause disease and even death in aquatic organisms and humans (Zingone., 2000). These harmful algal blooming (HAB) species in this taxa are particularly prevalent in warm, stratified, and nutrient-enriched coastal waters (Smayda and Reynolds, 2003). In eutrophication condition, the supply of N and P was increased greatly, but the availability of Si was decrease, that could favor the persistent formation of HAB (Howarth., 2011). Documented HAB events had increased substantially during recent decades, and which could lead to global climate change (Chambouvet., 2008). HAB species in the ECS have been reported every year in the last decade (Lou., 2014), the continuous monitoring work of HAB had great significance to the ecological environment protection and the stable development of fishery economy in Zhoushan Fishing Ground.
This was the first research using the HTS technology to investigate the picoeukaryote diversity in surface waters of the Zhoushan Fishing Ground. Water samples from four different seasons revealed different high-level taxonomic groups and phylotype OTUs for picoeukaryotes. This research provided a basic reference for the further research. Long-term time-series analyses to picoeukaryote community on a variety of spatial and temporal scales in the following work would further enhance our understanding of the global dynamics and variability of microbial community diversity. The advances in technologies would improve our ability to observe the microbial ocean over different scales of space and time (Bryant., 2016).
Acknowledgements
We thank the captain and all crews of the RV ‘for their assistance in sample collection. This work was supported by the Nonprofit Research Project of the State Oceanic Administration (Nos. 201505025 and 2015 05003).
Acosta, F., Ngugi, D. K., and Stingl, U., 2013. Diversity of picoeukaryotes at an oligotrophic site off the Northeastern Red Sea Coast., 9 (1): 16.
Amato, K. R., Yeoman, C. J., Kent, A., Righini, N., Carbonero, F., Estrada, A., and Gaskins, H. R., 2013. Habitat degradation impacts black howler monkey () gastrointestinal microbiomes., 7 (7): 1344-1353.
Arndt, H., Dietrich, D., Auer, B., Cleven, E. J., and Alexander, P. M., 2000. Functional diversity of heterotrophic flagellates in aquatic ecosystems., (1): 240-268.
Balzano, S., Marie, D., Gourvil, P., and Vaulot, D., 2012. Composition of the summer photosynthetic pico and nanoplankton communities in the Beaufort Sea assessed by T-RFLP and sequences of the 18S rRNA gene from flow cytometry sorted samples., 6 (8): 1480-1498.
Blanchet, F. G., Legendre, P., and Bergeron, J. A. C., 2016. Consensus RDA across dissimilarity coefficients for canonical ordination of community composition data., 84 (3): 491-511.
Bryant, J. A., Aylward, F. O., Eppley, J. M., Karl, D. M., Church, M. J., and DeLong, E. F.,2016. Wind and sunlight shape microbial diversity in surface waters of the North Pacific Subtropical Gyre., 10 (6): 1308-1322.
Buitenhuis, E. T., Li, W. K. W., Vaulot, D., Lomas, M. W., and Landry, M. R., 2012. Picophytoplankton biomass distribution in the global ocean., 5 (1): 301-315.
Caron, D. A., Countway, P. D., Jones, A. C., Kim, D. Y., and Schnetzer, A., 2012. Marine protistan diversity., 4: 467-493.
Chambouvet, A., Morin, P., Marie, D., and Guillou, L., 2008. Control of toxic marine dinoflagellate blooms by serial parasitic killers., 322 (5905): 1254-1257.
Chen, B., Wang, L., Song, S., Huang, B., Sun, J., and Liu, H. B., 2011. Comparisons of picophytoplankton abundance, size, and fluorescence between summer and winter in northern South China Sea., 31 (14): 1527- 1540.
Chisholm, S. W., Olson, R. J., and Zettler, E. R., 1988. A novel free-living prochlorophyte abundant in the oceanic euphotic zone., 334 (6180): 340-343.
Christaki, U., Courties, C., Joux, F., Jeffrey, W. H., and Naudin, J. J., 2009. Community structure and trophic role of ciliates and heterotrophic nanoflagellates in Rhone River diluted mesoscale structures (NW Mediterranean Sea)., 57 (3): 236-277.
Díez, B., Pedrós-Alió, C., and Marsh, T. L., 2001. Application of denaturing gradient gel electrophoresis (DGGE) to study the diversity of marine picoeukaryotic assemblages and comparison of DGGE with other molecular techniques., 67 (7): 2942.
Dong, Y., Zhao, Y., Zhang, W., Li, Y., Zhou, F., and Liu, C. G., 2014. Bacterial diversity and community structure in the East China Sea by 454 sequencing of the 16S rRNA gene., 32 (3): 527-541.
Estrada, M., Bayergiraldi, M., Felipe, J., Marrasé, C., and Vidal, M., 2009. Light and nutrient effects on microbial communities collected during spring and summer in the Beaufort Sea., 54: 217-231.
Falkowski, P. G., Fenchel, T., and Delong, E. F., 2008. The microbial engines that drive Earth’s biogeochemical cycles., 320 (5879): 1034-1039.
Howarth, R., Chan, F., Conley, D. J., Garnier, J., Doney, S. C., Marino, R., and Billen, G., 2011. Coupled biogeochemical cycles: Eutrophication and hypoxia in temperate estuaries and coastal marine ecosystems., 9 (1): 18-26.
Hugerth, L., Lindh, M., and Sjöqvist, C., 2016. Seasonal dynamics and interactions among Baltic Sea prokaryotic and eukaryotic plankton assemblages. http://kth.diva-portal.org/ smash/record.jsf?pid=diva2%3A925857&dswid=2226#.
Huse, S. M., Huber, J. A., Morrison, H. G., and Sogin, M. L., 2007. Accuracy and quality of massively parallel DNA pyrosequencing., 8 (7): 1-9.
Jardillier, L., Zubkov, M. V., Pearman, J., and Scanlan, D. J., 2010. Significant CO2fixation by small prymnesiophytes in the subtropical and tropical northeast Atlantic Ocean., 4 (9): 1180-1192.
Jiao, N. Z., and Yang, Y. H., 1999. Distribution of,, and picoeukaryotes in the East China Sea., 2: 1149-1150.
Jiao, N. Z., Yang, Y. H., Hong, N., and Ma, Y., 2005. Dynamics of autotrophic picoplankton and heterotrophic bacteria in the East China Sea., 25 (10): 1265- 1279.
Le, F. F., Cai, Y. M., and Sun, J., 2015. Seasonal variation of picoplankton abundance and biomass in the northern South China Sea in summer and winter 2009., 37 (12): 41-55 (in Chinese with English abstract).
Lepère, C., Vaulot, D., and Scanlan, D. J., 2009. Photosynthetic picoeukaryote community structure in the South East Pacific Ocean encompassing the most oligotrophic waters on earth., 11 (12): 3105-3117.
Li, W. K., 1994. Primary production of prochlorophytes, cyano- bacteria, and eukaryotic ultraphytoplankton: Measurements from flow cytometric sorting., 39 (1): 169-175.
Lou, X., and Hu, C., 2014. Diurnal changes of a harmful algal bloom in the East China Sea: Observations from GOCI., 140: 562-572.
Massana, R., 2011. Eukaryotic picoplankton in surface oceans., 65: 91-110.
Massana, R., Gobet, A., Audic, S., Bass, D., Bittner, L., Boutte, C., and Chambouvet, A., 2015. Marine protist diversity in European coastal waters and sediments as revealed by high- throughput sequencing., 17 (10): 4035-4049.
Not, F., Massana, R., Latasa, M., Marie, D., and Eikrem, W., 2005. Late summer community composition and abundance of photosynthetic picoeukaryotes in Norwegian and Barents Seas., 50 (5): 1677-1686.
Pan, L. A., Zhang, L. H., Zhang, J., and Chao, M., 2005. On- board flow cytometric observation of picoplankton community structure in the East China Sea during the fall of different years., 52 (2): 243-253.
Pedrós-Alió, C., 2012. The rare bacterial biosphere., 4: 449-466.
Rocke, E., Jing, H., and Liu, H., 2013. Phylogenetic composition and distribution of picoeukaryotes in the hypoxic northwestern coast of the Gulf of Mexico., 2 (1): 130-143.
Rousk, J., Baath, E., Brookes, P. C., Lauber, C. L., Lozupone, C., Caporaso, J. G., Knight, R., and Fierer, N., 2010. Soil bacterial and fungal communities across a pH gradient in an arable soil., 4: 1340-1351.
Schloss, P. D., Gevers, D., and Westcott, S. L., 2011. Reducing the effects of PCR amplification and sequencing artifacts on 16S rRNA-based studies., 6 (12): e27310.
Smayda, T. J., and Reynolds, C. S., 2003. Strategies of marine dinoflagellate survival and some rules of assembly., 49 (2): 95-106.
Somogyi, B., Felföldi, T., Katalin, V., and Boros, E., 2016. The role and composition of winter picoeukaryotic assemblages in shallow Central European great lakes., 42 (6): 1420-1431.
Song, X., Xu, Z., and Liu, Q., 2017. Comparative study of the composition and genetic diversity of the picoeukaryote community in a Chinese aquaculture area and an open sea area., 97 (1): 151-159.
Tarran, G. A., Burkill, P. H., and Edwards, E. S., 1999. Phytoplankton community structure in the Arabian Sea during and after the SW monsoon, 1994., 46 (s3-4): 655-676.
Wang, M., Bai, X. G., Liang, Y. T., Wang, F., Jiang, X. J., and Guo, Y. J., 2008. Summer distribution of picophytoplankton in the North Yellow Sea., 32 (5): 1184-1193 (in Chinese with English abstract).
Zhang, L., Liu, Z., Zhang, J., Hong, G. H., Park, Y., and Zhang, H. F., 2007. Reevaluation of mixing among multiple water masses in the shelf: An example from the East China Sea., 27 (15): 1969-1979.
Zhao, Y., Zhao, L., Zhang, W., Sun, J., Huang, L. F., Li, J., Zhai, H. C., Liu, S. M., and Xiao, T., 2016. Variations of pico- plankton abundances during blooms in the East China Sea., 124 (12): 100-108.
Zingone, A., and Enevoldsen, H. O., 2000. The diversity of harmful algal blooms: A challenge for science and management., 43 (8): 725-748.
#The two authors contributed equally to this work.
. Tel: 0086-580-2556480
E-mail: sjzhao@zjou.edu.cn
September 4, 2019;
June 15, 2020;
July 28, 2020
(Edited by Ji Dechun)
 Journal of Ocean University of China2020年6期
- Journal of Ocean University of China的其它文章
- Numerical Simulation and Risk Analysis of Coastal Inundation in Land Reclamation Areas: A Case Study of the Pearl River Estuary
- Variation of Yellow River Runoff and Its Influence on Salinity in Laizhou Bay
- Cold Water in the Lee of the Batanes Islands in the Luzon Strait
- Preliminary Design of a Submerged Support Structure for Floating Wind Turbines
- Inversion of Oceanic Parameters Represented by CTD Utilizing Seismic Multi-Attributes Based on Convolutional Neural Network
- Trace-Norm Regularized Multi-Task Learning for Sea State Bias Estimation
