Characterization of Bacterial Community, Ammonia-Oxidizing Bacteria, and Nitrospira During the Operation of a Commer-cial-Scale Recirculating Aquaculture System for Culturing Pufferfish Takifugu rubripes
MA Yuexin, YU Zichao, DU XinZHANG Tao, WANG Ning, and TAO Wei
Characterization of Bacterial Community, Ammonia-Oxidizing Bacteria, andDuring the Operation of a Commer-cial-Scale Recirculating Aquaculture System for Culturing Pufferfish
MA Yuexin1),*, YU Zichao2), DU Xin1), ZHANG Tao3), WANG Ning3), and TAO Wei4)
1),,116023,2),,116023,3),116011,4),,116026,
We investigated the changes in communities of bacteria, ammonia-oxidizing bacteria, andduring the operation of a pufferfishrecirculating aquaculture system by using high-throughput DNA sequencing.Differences in bacterial communities were observed at days 1–32, 47–62 and 78–93 of biofilm development by using16S rRNA gene pyrosequencing. The relative abundance of Proteobacteria(Gammaproteobacteria) increased, while that of Bacteroidetes (Flavobacteria) decreased. The proportions ofandranged from 0.02% to 0.30% and from 0.02% to 0.83%, respectively. Ammonia monooxygenase gene pyrosequencing revealed that the top three operational taxonomic unitswere related to(17.5%–61.1%), uncultured beta proteobacterium clone B67S-54 (1.9%–45.2%), and uncultured bacterium clone AZPa8 (3.6%–24.7%). Nitrite oxidoreductase gene pyrosequencing revealed thatthe relative abundance of the dominant strainsp. Ecomares 2.1 increased, but that of the abundant speciesdecreased. Our results demonstrated that the communities of bacteria, ammonia-oxidizing bacteria, andwere changing during the operation of the pufferfish recirculating aquaculture system.
biofilter; bacterial community; ammonia-oxidizing bacteria;;recirculating aquaculture system
1 Introduction
Recirculating aquaculture systems (RASs)are intensiveaquaculture facilities that depend on water treatment units to provide farmed organisms with optimal water quality, which can optimize feed utilization and achieve high production of healthy animals under controlled conditions (Rurangwa and Verdegem, 2015; Xiao., 2019). These systems are promoted in countries with strict environmental regulations for wastewater discharge and limited access to land and natural water sources (Martins., 2010; Dalsgaard., 2013).A diverse bacterial commu- nity associated with biofilters plays a core role in the re- duction or transformation of organic metabolic wastes and ammonia (Schreier, 2010; Brown., 2013; Ru- rangwa and Verdegem, 2015). The majority of bacteria in biofilters within biofilms are attached on the surface of a fixed matrix, which developsthe localization of indi- vidual community members within distinct layers on the basis of their nutritional and environmental requirements (Schreier., 2010). Both heterotrophic and autotrophic bacteria co-exist within the biofilm, which allows simultaneous carbon and ammonia oxidation (Elenter., 2007). Fast-growing heterotrophs are superior competitors for oxygen and tend to grow toward the surface of a biofilm, covering the layers of slower-growing autotrophic nitrifiers (Hagopian and Riley, 1998). A moderate outer layer of heterotrophs can protect nitrifiers from sloughing (Michaud., 2006) and grazing (Blancheton., 2013). Tradi- tionally, nitrifiers include ammonia-oxidizing bacteria (AOB) and nitrite-oxidizing bacteria (NOB), which participate in the oxidation of ammonia to nitrite and oxidation of ni- trite to nitrate, respectively. However, nitrite-oxidizingcapable of ammonia oxidation have recently been identified (Daims., 2015; van Kessel., 2015), and DNA sequences of these ‘comammox’ genes have been identified in freshwater RAS (Bartelme., 2017).
The bacterial community structure varies during bio- film development in biofilters of both freshwater and ma- rine RASs (Itoi., 2006; Gao., 2012; Keuter., 2017; Jiang., 2019). However, changes in AOB and NOB communities are rarely reported. The 16S rRNA gene is widely used as the standard for the identification of bacteria due to its universal presence in bacteria and slow evolution rate (Woese and Fox, 1977)., which en- codes the active-site polypeptide of ammonia monooxy- genase as a functional marker gene, provides higher phy- logenetic resolution than the 16S rRNA gene for the dif- ferentiation of closely related ammonia oxidizers (Purk- hold., 2000; Pester, 2012)., which en- codes the beta subunit of nitrite oxidoreductase,is a use- ful functional and phylogenetic marker for characterizing the most diverse and widespread group of NOB (Pester., 2014). Representatives of the genushave been reported as dominant NOB in biofilters of marine RASs (Tal., 2003; Foesel, 2008; Keuter., 2011; Ruan., 2015; Huang., 2016). The present study aimed to characterize the changes in communities of bacteria, AOB, andduring the operation of a commercial marine RAS for the culture of pufferfish,, by using high-throughput DNA se-quencing technology.
2 Materials and Methods
2.1 Description of the Biofilter and Design of the Experiment
The commercial marine RAS in this study was oper- ated at Dalian Tianzheng Industry Company Limited (Da- lian, China).Prior to the experiment, the system had been operated for three years. The pufferfish (one year old;2000 individuals per tank) were cultured at 18–20℃ and fed a natural diet (fresh fish, mainly) twice a day (7:00 and 17:00) at a rate of 2%–3% of body weight. The system contained nine fish-rearing tanksand one submerged biofilter (13m in length, 3.3m in width, and 2.0m in depth) filled with polyethylene elastic media. A bowed screen and a foam fractionator were employed to remove suspended and fine solids. Data on the ammo- nia- and nitrite-nitrogen concentrations of water from the outlet of the biofilter were obtained from the company’s records and are shown in Fig.1. During the operation of the system, biofilm samples were collected on day 1, day 17, day 32, day 47, day 62, day 78, and day 93, respec- tively. Fifteen sampling sites were set in the biofilter. The bio-media were collected from the same sites of the bio- filter on each sampling date to reveal the succession pro- cess. Pufferfish grew from a mean size of 211g to 323g throughout the study period. All experimental protocols were approved by the Experimental Animal Ethics Com- mittee of Dalian Ocean University, China, and all meth- ods were carried out in accordance with relevant guide- lines and regulations.
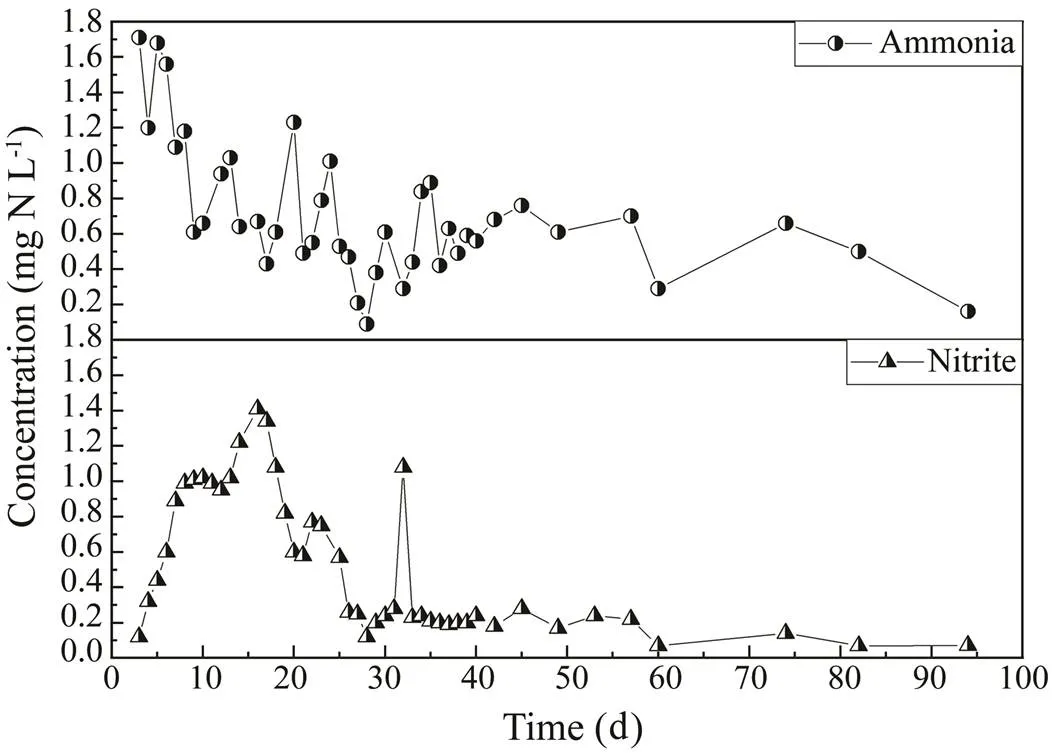
Fig.1 Biofilter outlet ammonia- and nitrite-nitrogen concen- trations.
2.2 Sample Collection, DNA Extraction, and PCR Amplification
The polyethylene elastic media samples were collected in 50mL Falcon tubes, then stored in a portable cooler, transferred to the laboratory, and processed immediately. To obtain the biofilm samples, the media were gently rinsed, suspended in sterile seawater, and shaken vigo- rously with a vortex mixer before the liquid phase was cen- trifuged. Total genomic DNA was extracted from seven biofilm samples by using a soil DNA isolation kit (Tian- gen Biochemical Technology Limited, Beijing, China) fol- lowing the manufacturer’s protocols. The 16S rRNA, am- monia-oxidizing bacterial, andgenes were amplified with primer pairs 357F/926R (Wu, 2010), amoA-1F/amoA-2R (Rotthauwe., 1997), and Nxrb169F/Nxrb638R (Maixner., 2006), respectively. Sample-specific 7bp barcodes were incorporated into the primers for multiplex sequencing. The PCR components contained 5μL of Q5 buffer (5×), 5μL of GC enhancer (5×), 2μL of 2.5mmolL−1dNTPs (each nucleotide), 1μL of 10μmolL−1primer (each direction), 0.25μL of Q5 High- Fidelity DNA Polymerase (New England BioLabs), 2μL of template DNA, and 8.75μL of ddH2O. The bacterial 16S rRNA gene (V3–V5 region) and functional genes (and) were amplified through PCR by denaturation at 98℃ for 5min, followed by 26 cycles of denaturation at 98℃ for 30s, annealing at 55℃ for 45s, extension at 72℃for 1min, and finally an additional extension cycle at 72℃ for 7min.
2.3 Pyrosequencing and Data Analysis
After amplification, the purified PCR products were se- quenced using a Roche 454 GS FLX+ pyrosequencing machine (Roche, 454 Life Sciences, Branford, CT, USA)at Personalbio (Shanghai, China). After pyrosequencing, all the raw reads were analyzed using the Quantitative In- sights Into Microbial Ecology (QIIME, v1.7.0) pipeline (Ca- poraso, 2010) to trim off the low-quality reads, adap- tors, barcodes, and primers. Sequences containing ambi- guous bases and mononucleotide repeats of >8bp and se- quences<150bp were also removed. Chimera sequences were detected de novo by using the ‘self’ option of mo- thur software (Schloss, 2009) implemented in QIIME and excluded from further analysis. Sequences were clustered into operational taxonomic units (OTUs) by using a 97% similarity cutoffwith UCLUST (Edgar., 2011). Representative sequences from each OTU were annotated with NCBI taxonomy through the BLASTN and Green- genes (16S rRNA gene) or GenBank (nr) (and) databases. An OTU table was generated to record the abun- dance of each OTU in each sample and the taxonomy of these OTUs. OTU-level alpha diversity indices, such as Chao (the Chao1 estimator;http://www.mothur.org/wiki/ Chao), Ace (the abundance-based coverage estimator; http:// www.mothur.org/wiki/Ace), and Shannon (the Shannonindex; http://www.mothur.org/wiki/Shannon), were calculated using the OTU table in QIIME. Beta diversity ana- lysis was performed to investigate the structural variation in bacterial communities across samples through the UniFrac distance metrics (Lozupone and Knight, 2005; Lo- zupone.,2007) and visualizedprincipal coordinate analysis (PCoA). Taxonomic analyses were performed main- ly at the phylum, class, or genus levels, and community bar plots were produced using QIIME (http://qiime.sour-ceforge.net/) software.Phylogenetic trees of dominant OTUs (AOBand;>1% abundance) were constructed througha neighbor-joining method implemented in MEGA 6.0 (Tamura., 2013) by using representative sequences ofand, together with reference sequences from GenBank.
2.4 Data Access
All raw sequences were deposited in the NCBI Sequence Read Archive under accession numbers PRJNA558578, PRJNA558576, and PRJNA558577.
3 Results
3.1 Changes in Bacterial Diversity
Differences in bacterial communities at the genus level between biofilm samples analyzed with beta diversity analysis are presented in a PCoA plot (Fig.2). Clear sepa- ration between samples at day 1–day 32, day 47–day 62, and day 78–day 93 was noted along PC1, which ex- plained 44.2% of the total variation. Along PC2, a clear separation was observed in day 1–day 32 samples and subsequent biofilm samples, which explained 39.5% of thetotal variation. Overall, the two PCoA axes explained 83.7% of the variation among the different communities. Thus, the microbial community varied through time.
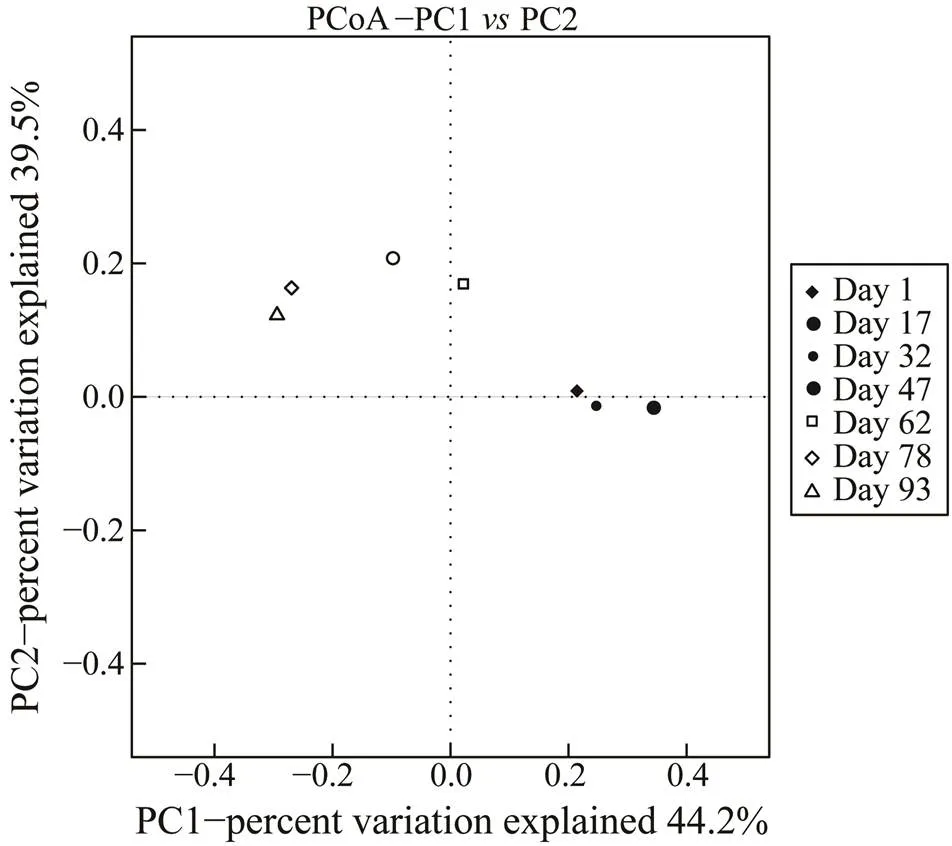
Fig.2 Principal coordinate analysis plot of genera based on the UniFrac distance metrics.
Rarefaction curves of all samples generated at the OTU level did not completely reach a saturation stage (Fig.3), suggesting that these samples had highly diverse bacterial communities. Good’s coverage estimations revealed that 83.9%–93.1% of the species were retrieved. Bacterial taxonomic richness and diversity were found to fluctuate during biofilm maturation. High-quality sequencesreco- vered from the seven biofilm samples ranged from 5638 to 9082, and OTU numbers varied from 837 to 1501 (Table 1). As indicated by Ace and Chao indices, day 62 sam- ples harbored the highest community richness, followed by samples at days 17, 47, and 78 or 1; the lowest com- munity richness was found in day 93 sample. The Shan- non index showed that the bacterial diversity decreased in the following order: day 17, day 32, day 1, day 62,day 47, day 93,and day 78 samples (Table 1).
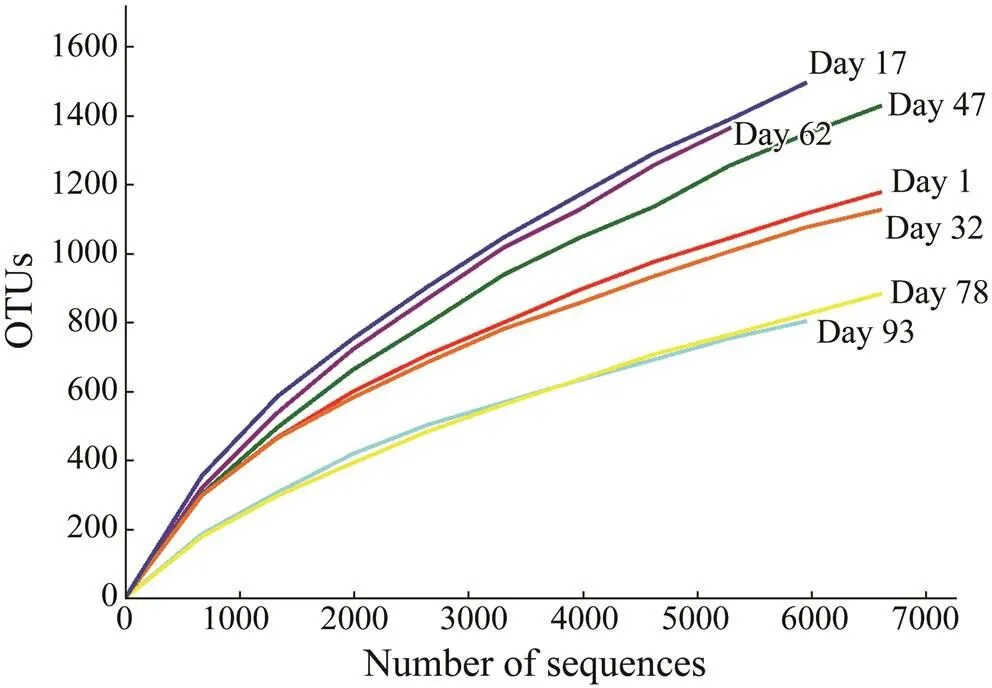
Fig.3 Rarefaction curves of operational taxonomic units (OTUs) clustered at 97% similarity among seven biofilm samples.
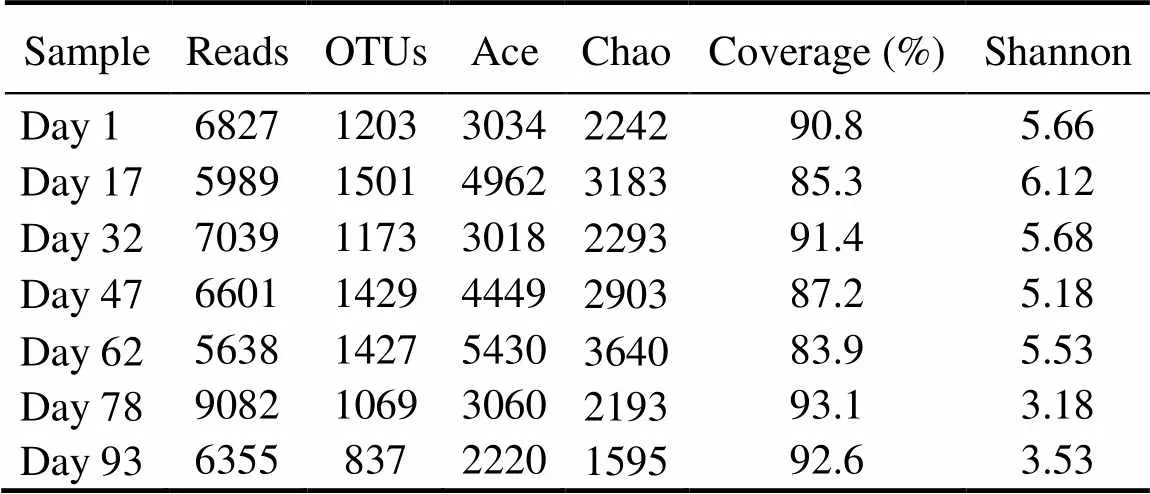
Table 1 Alpha diversity of bacterial communities based on inferred OTUs of each sample
Notes: OTUs, operational taxonomic units; Ace, abundance-based coverage estimator; Chao,Chao1 estimator; Coverage, Good’s co- verage; Shannon, Shannon index.
3.2 Changes in the Bacterial Communities
Differences in bacterial communities of the seven bio- film samples at the phylum level are shown in Fig.4. The optimized reads (5638–9082) from all samples were as- signed to 17–27 phyla, with two phyla (., Proteobacte- ria and Bacteroidetes) comprising >79% of the reads. Pro- teobacteria accounted for 52.4%–58.9% from day 1 to day 32 and then increased to 81.7%–83.2% (day 47 to day 62) and 91.8%–93.1% (day 78 to day 93). Meanwhile, Bac- teroidetes declined rapidly from 26.7%–31.4% (day 1 to day 32) to 7.9%–10.1% (day 47 to day 62), and thendropped to 2.8%–3.7% (day 78 to day 93). Relative abun- dances for the16S rRNA gene sequences assigned toPlanctomycetes fluctuated from 1.7% (day 78) to 8.5% (day 17) and for Nitrospirae from 0.8% (day 1) to 2.5% (day 47). Sequences belonging to Acidobacteria (0.05%–3.0%), Chloroflexi (0.05%–2.2%), Firmicutes (0.16%–1.2%) and Verrucomicrobia (0.099%–1.10%) were rela- tively abundant on day 17, whereas reads within Fusobac- teria (0.02%–2.9%) were relatively abundant on day 1.
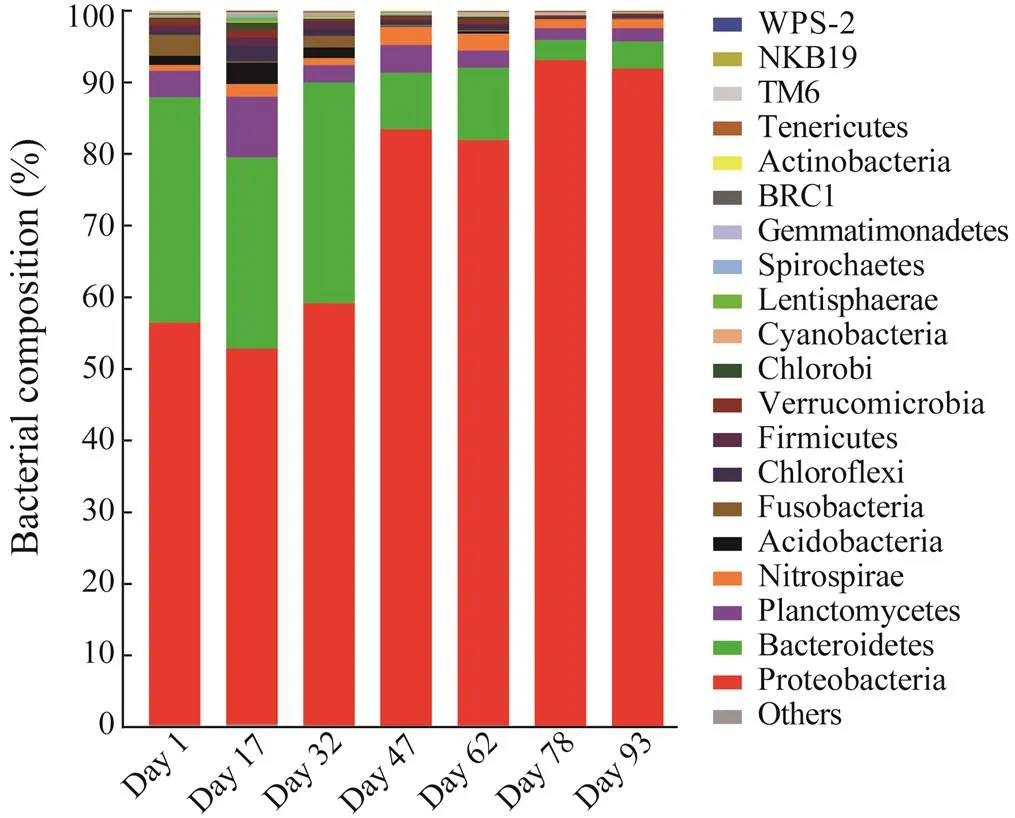
Fig.4 Bacterial community in biofilms at the phylum level. Phyla with sequence abundance less than 1% at each sam- pling date were combined into ‘others’.
The bacterial communities varied among the seven sam- ples at the class level (Fig.5), and 32–60 classes were identified. Members of Gammaproteobacteria were the most abundant, and they comprised 32.2%–85.9% of the bacterial reads. The proportion of this taxon increased ra- pidly from 32.2%–36.6% (day 1 to day 32) to 64.6%–71.6% (day 47 to day 62) and then to 85.4%–85.9% (day 78 to day 93). Flavobacteria declined from 13.4%–24.3% (day 1 to day 32) to 5.7%–7.0% (day 47 to day 62) and then to 0.9%–1.1% (day 78 to day 93). Sequences within Alphaproteobacteria fluctuated from 17.8% (day 1) to 5.0% (day 93), and they were the most abundant on day 1. The relative abundances of Deltaproteobacteria (1.0%–5.5%), Cytophagia (0.47%–5.1%), Saprospirae (0.03%–5.2%), Sva0725 (Acidobacteria; 0%–2.7%), Anaerolineae (0.02%– 2.0%), and Clostridia (0.05%–1.1%) were the highest on day 17, whereas those of Bacteroidia (0.62%–2.4%) and Betaproteobacteria (0.13%–1.2%) were the highest on day 32.
The abundance distribution of genera among the seven samples is shown in Fig.6. The most abundant 16S rRNA gene sequences on day 1 belonged to(9.5%), followed by those of(2.8%) and(2.7%). Readsfromwere relatively abundant from day 17 (4.1%) to day 32 (3.8%), fol- lowed by those belonging to(3.0%) and(1.2%) on day 17, and(3.7%) anda (3.0%) on day 32. Sequences assigned toandwere the most abundant from day 47 (28.4% and 4.6%) to day 62 (21.3% and 4.9%), followed by those belonging to(2.2%) on day 47 and(1.7%) on day 62. More- over, the proportion ofincreased to 65.6% (day 78) and 55.1% (day 93). The second and third most abundant genera on day 78 were(2.2%) and(1.8%), respectively, and those on day 93 were(8.3%) and(1.2%), respectively.
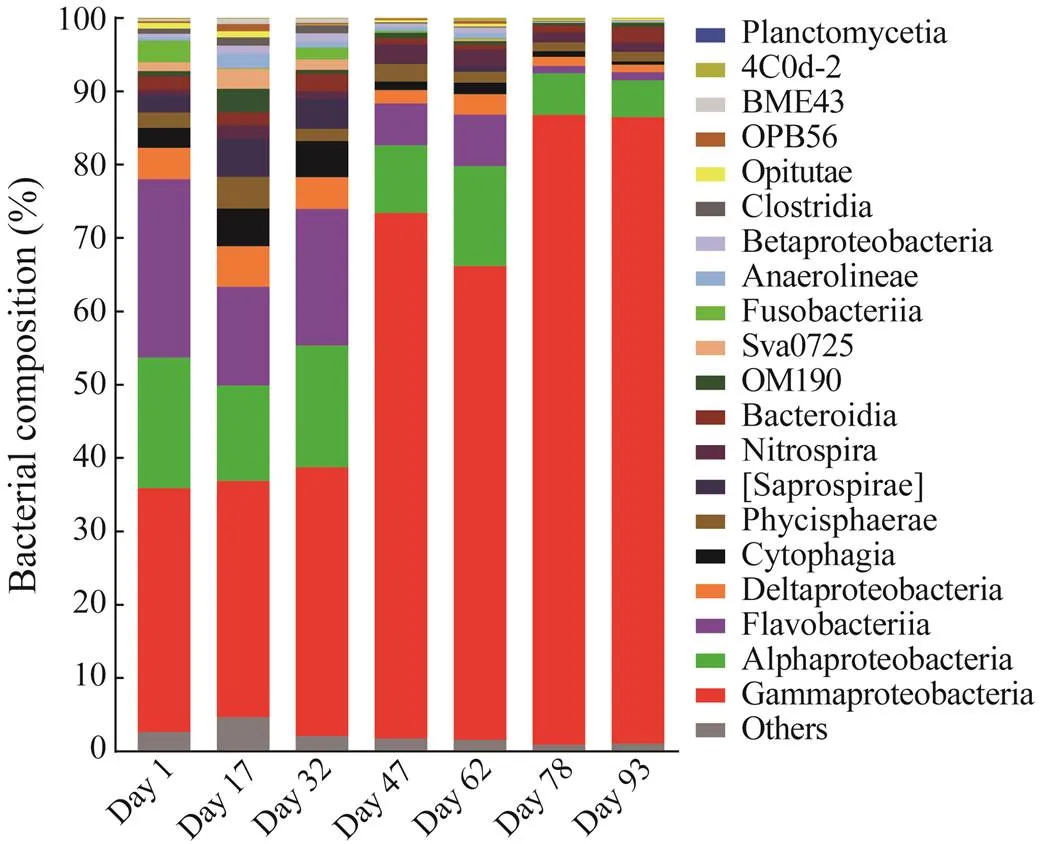
Fig.5 Bacterial community in biofilms at the class level. Classes with sequence abundance less than 1% at each sampling date were combined into ‘others’.

Fig.6 Bacterial community in biofilms at the genus level. Genera with sequence abundance less than 1% at each sampling date were combined into ‘others’.
In addition, the relative abundances of the 16S rRNA gene sequences related to Nitrosomonadaceae ranged from 0.09% (day 78) to 1.1% (day 32). The proportions ofandfluctuated from 0.02% (day 93) to 0.30% (day 62) and from 0.02% (day 93) to 0.83% (day 62), respectively. Four OTUs (numbers 248, 956, 2200, and 4959)were related to distinct strains of.
3.3 Changes in the Diversity and Community Structure of Nitrifying Bacteria
A total of 68907 high-quality AOB sequences and 72382 high-qualitysequences were obtained from the seven biofilm samples. The number of AOB sequences ranged from 4624 to 11962 per sample, and the number ofsequences ranged from 6186 to 14659 per sample (Table 2). The AOB andsequences be- longed to 66–227 and 102–309 OTUs, respectively (Ta- ble 2). Rarefaction curves of all samples generated at the OTU level reached a saturation stage, indicating that the sequencing depth was sufficient to reflect the diversity. The taxonomic richness and diversity of nitrifying bacte- riafluctuated during biofilm maturation. As indicated by the Ace, Chao, and Shannon indices, sample on day 1/day 93 harbored the highest AOB community richness/diver- sity, while the lowest AOB community richness and di- versity were found for samples on days 32 (Chao)/47 (Ace)and 32, respectively. Samples on day 62/day 1 harbored thehighest/lowestcommunity richness, and the high- est/lowestdiversity were observed in samples on day 17/day93 (Table 2).
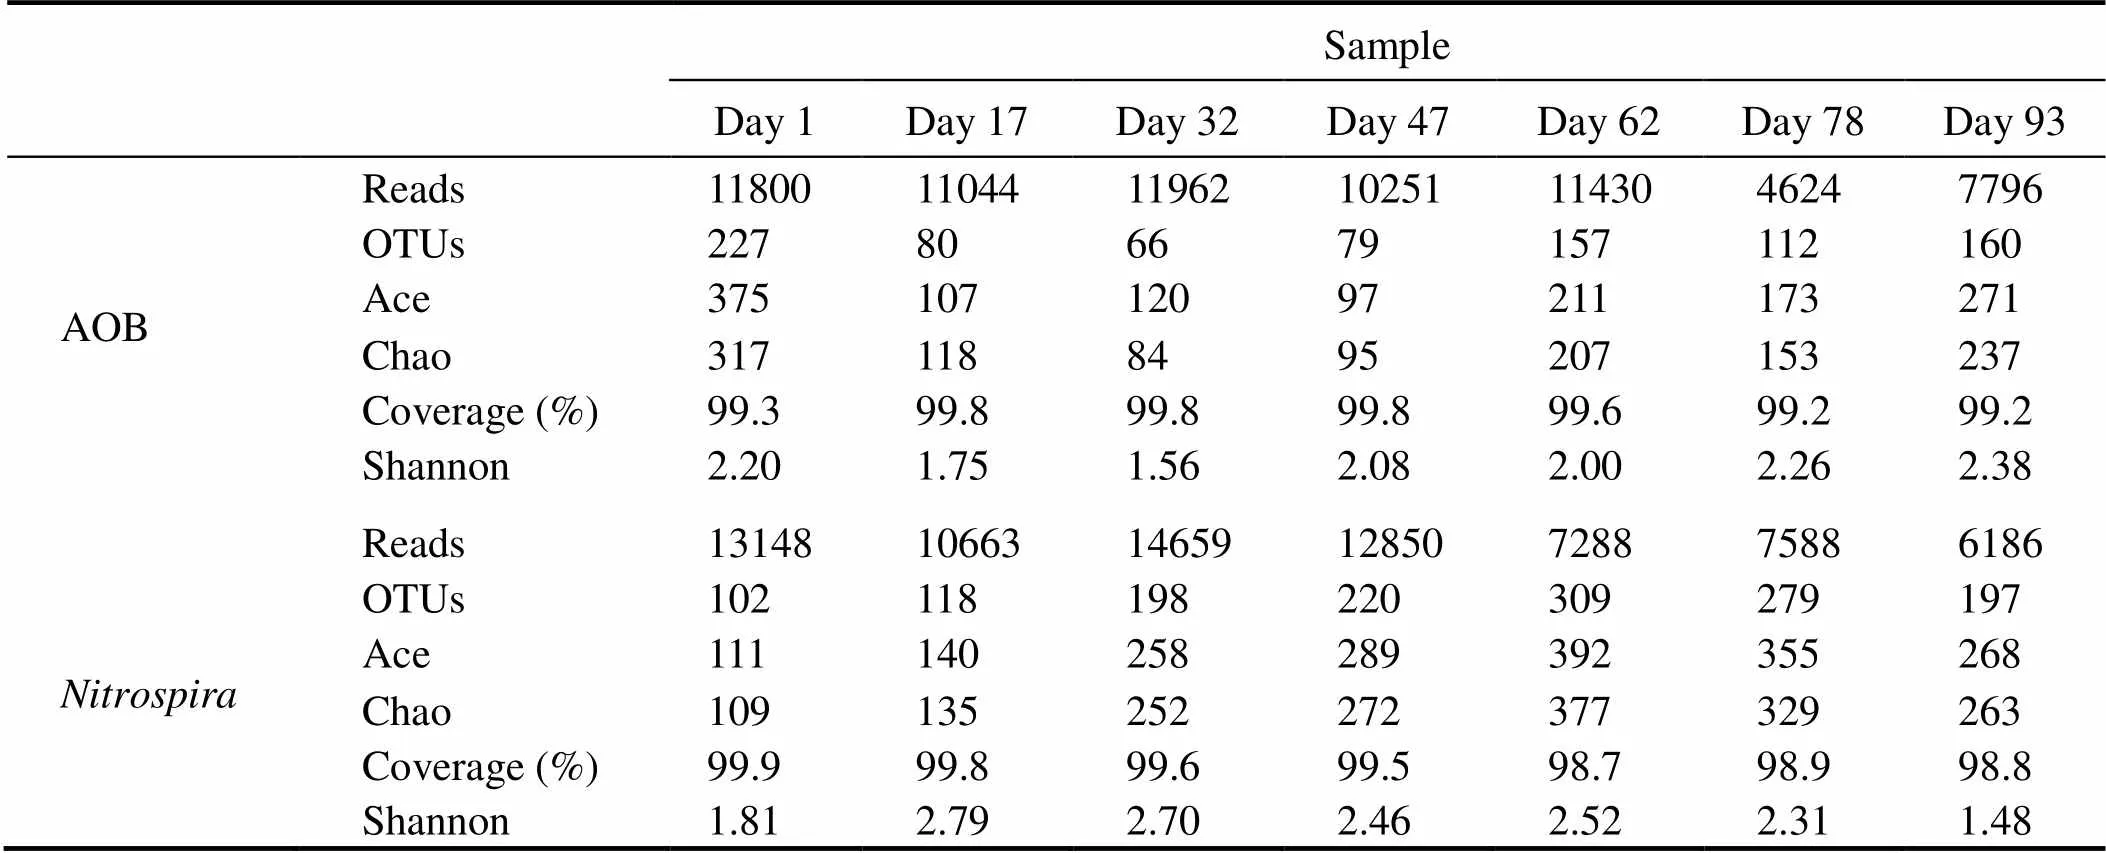
Table 2 Alpha diversity of AOB and Nitrospira communities based on inferred OTUs of each sample
Notes: OTUs, operational taxonomic units; Ace, abundance-based coverage estimator; Chao, Chao1 estimator; Coverage, Good’s coverage; Shannon, Shannon index.
For AOB communities, 337 OTUs were obtained from the seven biofilm samples. Results of the phylogenetic ana- lysis of the 23 dominant OTUs, representative sequences, and their relative abundances (>1%) are shown in Fig.7. The first dominant OTU (number 298) showed99% si- milarityto, which accounted for 17.5%–61.1% of the AOB reads. The proportion of this OTU increased from day 1 (38.0%) to day 32 (61.1%), de- creased to day 78 (17.5%), and finally increased on day 93 (38.3%). However, OTU 34, the second most abundant OTU, declined from day 1 (31.3%) to day 32 (1.9%), in- creased to day 62 (45.2%), and finally declined to day 93 (21.1%). The relative abundance of the third most abun- dant OTU (OTU44) was the highest on day 17 (24.7%) and the lowest on day 78 (3.6%). In addition, OTUs 185 and 233 had the highest abundances on days 78 (6.7%) and 47 (5.9%), respectively.
For thecommunity, 656 OTUs were reco- vered, and results of phylogenetic analyses of 19 domi- nant OTU representative sequences and their relative abun- dances (>1%) are shown in Fig.8. The relative abundance of the most abundant OTU (OTU 33) related tosp. Ecomares 2.1 increased from day 1 (0) to day 93 (76.7%), while that of the second most abundant OTU (OTU 554) decreased from day 1 (60.6%) to day 93 (0.19%). The pro- portion of the third most abundant OTU (OTU 83) wasthe lowest on day 1 (0.30%) and the highest on day 17 (19.4%).When data of 17 OTUs were combined, the relative abun- dances of eight OTUs related tode- clined and those of nine OTUs assigned tosp. Ecomares 2.1 increased with the development of the bio- film. In addition, the sequence of OTU 200, detected from day 17 to day 47 (0.13%–0.46%), was related to.
4 Discussion
Changes in the bacterial diversity and community struc- ture were studied in the biofilms during the duration of the study. In agreement with the results of a previous study (Itoi., 2006), the relative abundance of Proteobacte- ria (mainly Gammaproteobacteria) was found to increase, while the proportion ofBacteroidetes (mainly Flavobac- teria) decreased with the development of the biofilm.Both phyla are frequently regarded as dominant in biofilters of marine RASs (Michaud., 2009; Ruan., 2015; Huang., 2016; Rud., 2017). Members of Bac- teroidetes have been implicated in the degradation of com- plex organic compounds in marine environments (Kirch- man, 2002).The highest relative abundance of Nitrospirae was observed on day 47 of the experiment, and the range of relative abundances of this phylum was similar to that in other marine RAS biofilters (Huang., 2016).
At the genus level, the relative abundances of the do- minant genera presented temporal variation. When data from the seven samples were considered together,,,,,,,,,,,,,,,,,and(>1%) were the top 17 genera. Several genera have previously been reported as members of bacterial communities in biofilms of laboratory-scale or full-scale marine RASs.,,,, andwere pre- viously found in biofilters of RASs for pufferfish (Itoi., 2006; Chen., 2013). Meanwhile,,,,,,,,,, andwere observed in bio- films from RASs for sea bass (Leonard., 2000; Mi- chaud., 2009), half-smooth tongue sole (Günther) (Zhang,2011; Gao, 2012;Huang., 2016), or Atlantic salmon () (Huang., 2016).
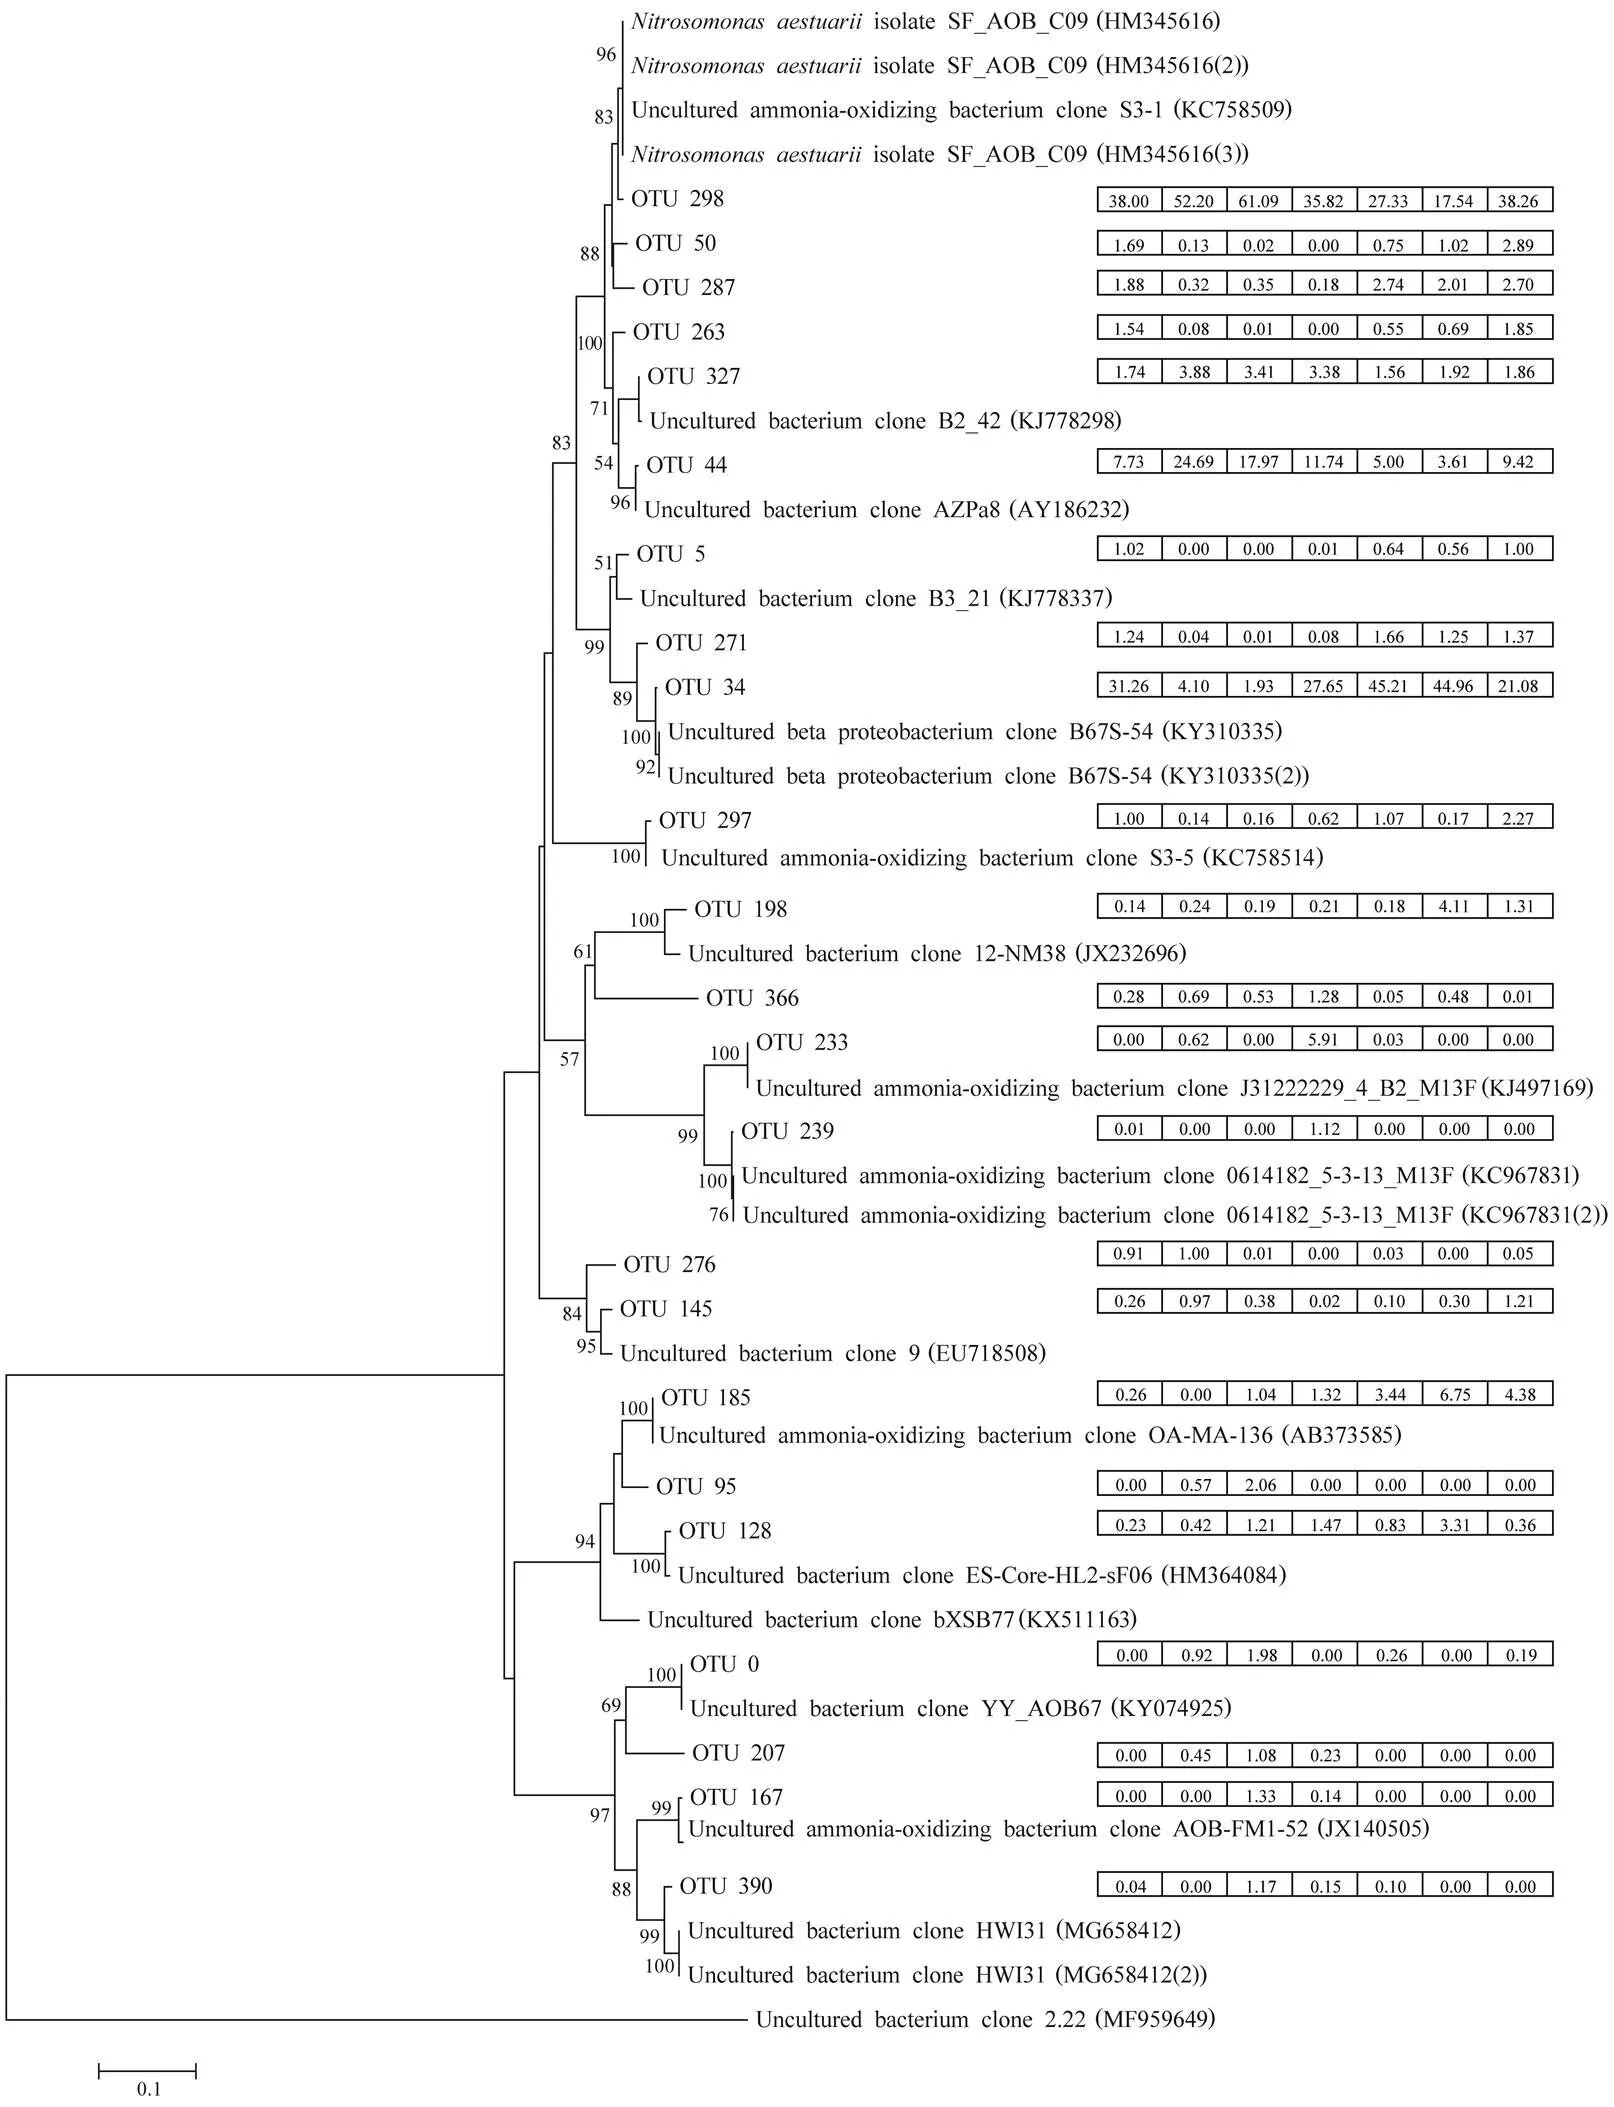
Fig.7 Phylogenetic analysis of amoA sequencesretrieved from seven biofilm samples. The most abundant 23 OTUs (>1%) and reference sequences available in GenBank were used to construct the phylogenetic tree. Bootstrap values of >50% based on 1000 replicates are shown next to the branches. Bar indicates 0.1 substitutions per position. Relative abundances of specific OTUs for each sample are shown following the OTU names and are presented in boxes in the order (from left to right): day 1, day 17, day 32, day 47, day 62, day 78, and day 93.

Fig.8 Phylogenetic analysis of nxrB sequencesretrieved from seven biofilm samples. The most abundant 19 OTUs (>1%) and reference sequences available in GenBank were used to construct the phylogenetic tree. Bootstrap values of >50% based on 1000 replicates are shown next to the branches. Bar indicates 0.1 substitutions per position. Relative abundances of specific OTUs for each sample are shown following the OTU names and are presented in boxes in the order (from left to right): day1, day 17, day 32, day 47, day 62, day 78, and day 93.
Biofilters are partly used to reduce the ammonia concentration in fish tanks. Nitrification, the oxidation of am- monia to nitrate via nitrite, is performed by ammonia- and nitrite-oxidizing bacteria. In this study, the ammonia-nitrogen concentration of water in the outlet showed a fluctuating downward trend from day 1 to day 32, which roughly related to the increases in abundance of the fa- mily Nitrosomonadaceae and OTU 298 (related to), suggesting that they might be responsible for the ammonia conversion. By contrast, the nitrite-nitrogen con- centration showed a fluctuating upward and then down- ward trend, and the relative abundances ofand Nitrospiraceae (equal to that of Nitrospirae) showed a si- milar trend. The relative abundance of Nitrosomonadaceae from day 47 to day 62 was lower than that from day 17 to day 32; however, the relative abundances ofand Nitrospiraceae were opposite, which might be the result of low concentration of nitrite-nitrogen. The re- lative abundances of Nitrosomonadaceae, Nitrospiraceae, andfrom day 78 to day 93 (0.088%–0.094%, 1.3%–1.2%, and 0.11%–0.02%, respectively) were rough- ly related to the low concentrations of ammonia- and ni- trite-nitrogen and may have caused the high ammonia- and nitrite-oxidizing rates during this period.
In the present study,was identified byanalyzing the 16S rRNA andgene sequences. Com- paring 16S rRNA gene sequencing results, the relative abundance ofin the biofilter of this puffer- fish RAS was similar to those in a moving bed bioreactor culturing Pacific white shrimp () and in submerged biofilters of an RAS culturing half-smooth tongue sole (Huang., 2016). On the basis of the 16S rRNA gene sequences, four OTUs were affiliated with, which is a cold-tolerant obligate halophilic bacterium firstly isolated from Alaskan marine waters (Jones., 1998).has been identifiedin biofilters of RASs forculturing gilthead seabream () (Tal, 2003)and hybrid grouper (×) (Huang., 2018). Usingsequencing, three dominant OTUs were af- filiated with., which has been detected in bio- filters of RASs producingpufferfish (Itoi., 2006), white shrimp (Brown., 2013), sea bass (Keuter., 2017),and hybrid grouper (Huang., 2018).-like AOB were previously detected in biofilters of RASs for culturing pufferfish, Pacific saury (), and black-spot tuskfish () (Sa- kami., 2012).andmay appear in biofiltration tanks with different ammonia con- centrations. In the tank of this study in which the ammo- nia concentration ranged from 6μmolL−1to 122μmolL−1,was detected. Similarly,spp. were found to be dominant in tanks where ammonia concentrations ranged from 5μmolL−1to 100μmolL−1(Itoi., 2006) and from 20μmolL−1to 100μmolL−1(Foesel, 2008). By contrast,-like AOB were the most abundant in tanks where ammonia concentrations were less than 1μmolL−1(Sakami., 2012).
The NOB comprise at least six different genera:,,,,,and(Starkenburg.,2011; Sorokin., 2012; Spieck., 2014). In this study, 16S rRNA gene se- quencing revealed high relative abundance of(0.83%) in the biofilter of the pufferfish RAS on day 62. This genus (<0.05%-0.7%) was also detected in the bio- filters of RASs for Atlantic salmon, Pacific white shrimp, and half-smooth tongue sole (Ruan., 2015; Huang., 2016).-specific PCR assays were posi- tive for biofilm samples from RASs for culturing turbot () and sea bass (Keuter., 2017). Com- paratively, usingsequencing,andsp. Ecomares 2.1 were identified to be dominant spe- cies/strain, and the relative abundance of.de- creased, while the proportion of the strainsp. Ecomares 2.1 increased during the operation of the RAS. Previous studies found.was dominant both in marine and brackish RAS biofilters (Tal., 2003; Foe- sel., 2008; Brown., 2013; Kruse., 2013). The strain Ecomares 2.1 appears to adapt well to the at- tached lifestyle in biofilters and the nitrogenous load pre- vailing in the effluent waters of a marine RAS (Keuter., 2011).Restriction fragment length polymorphisms confirmed a dominant role of the strain Ecomares 2.1 overotherin later biofilm samples of a biofilter from an RAS for culturing sea bass (Keuter., 2017). This isolate was also observed in biofilters of RASs for cul- turinghalf-smooth tongue sole (Ruan., 2015) and turbot (Keuter., 2017).
Combined 16S rRNA and functional gene(and) sequencing showed thatNitrosomonadaceae (including) was involved in ammonia oxidation; Nitrospiraceae(including), and Nitrospi- naceae (including) were responsible for nitrite oxidationinthe RAS for culturing pufferfish in this study.
OTUs for(102–309) were relatively high. This is because the non-DNA sequences werealso amplified as the primer specificity was not high enough.Moreover, high proportions of uncultured/unclassified bac- teria were included. In addition, no Blast hits were found for some OTUs ().
5 Conclusions
Our results showed that the dominant taxa of the bacte- rial community and the abundant OTUs of AOB andin the submerged biofilter of a pufferfish RAS changed with the development of the biofilm during the first three months. Both Proteobacteriaand Bacteroidetes played important rolesin the degradation of organic com- pounds. Members of Nitrosomonadaceae, including, Nitrospinaceae (including),and Ni- trospiraceae (includingsp. and), were found to be important forammonia and nitrite oxidation. Given this research is one of the few studies on microbial community dynamics, additional trials are necessary to de- termine whether the microbial dynamics observed in this study are consistent in this system and also occur in other systems.
Acknowledgements
This research was supported by the National Key R&D Program of China (No. 2017YFD0701700) and the Na- tional Natural Science Foundation of China (Nos. 31472 312 and 31672673).
Bartelme, R. P., McLellan, S. L., and Newton, R. J., 2017. Freshwater recirculating aquaculture system operations drive biofilter bacterial community shifts around a stable nitrifying consortium of ammonia-oxidizing archaea and comammox., 8: 1-18.
Blancheton, J. P., Attramadal, K. J. K., Michaud, L., Roque d’Orbcastel, E.,and Vadstein, O., 2013. Insight into bacterial population in aquaculture systems and its implication.,53: 30-39.
Brown, M. N., Briones, A., Diana, J., and Raskin, L., 2013. Am- monia-oxidizing archaea and nitrite-oxidizingin the biofilter of a shrimp recirculating aquaculture system., 83: 17-25.
Caporaso, J. G., Kuczynski, J., Stombaugh, J., Bittinger, K., Bu- shman, F. D., Costello, E. K., Fierer, N., Pena, A. G., Good- rich, J. K., Gordon, J. I., Huttley, G. A., Kelley, S. T., Knights, D., Koenig, J. E., Ley, R. E., Lozupone, C. A., McDonald, D., Muegge, B. D., Pirrung, M., Reeder, J., Sevinsky, J. R., Turn- baugh, P. J., Walters, W. A., Widmann, J., Yatsunenko, T., Zaneveld, J., and Knight, R., 2010. QIIME allows analysis of high throughput community sequencing data., 7: 335-336.
Chen, Z., Liu, Y., Liu, L. Z., Wang, X. J., and Liu, Z. P., 2013. Heterotrophic bacterial community structure of multistage bio- filters in a commercial pufferfishRAS., 726-731: 1621-1627.
Daims, H., Lebedeva, E. V., Pjevac, P., Han, P., Herbold, C.,Albertsen, M., Jehmlich, N., Palatinszky, M., Vierheilig, J., Bulaev, A., Kirkegaard, R. H., von Bergen, M., Rattei, T., Bendinger, B., Nielsen, P. H., and Wagner, M., 2015. Com- plete nitrification bybacteria., 528: 504- 509.
Dalsgaard, J., Lund, I., Thorarinsdottir, R., Drengstig, A., Ar- vonen, K., and Pedersen, P. B., 2013. Farming different spe- cies in RAS in Nordic countries: Current status and future perspectives.,53: 2-13.
Edgar, R. C., Haas, B. J., Clemente, J. C., Quince, C., andKnight, R., 2011. UCHIME improves sensitivity and speed of chime- ra detection.,27: 2194-2200.
Elenter, D., Milferstedt, K., Zhang, W., Hausner, M., and Mor- genroth, E., 2007. Influence of detachment on substrate re- moval and microbial ecology in a heterotrophic/autotrophic biofilm., 41: 4657-4671.
Foesel, B. U., Gieseke, A., Schwermer, C., Stief, P., Koch, L., Cytryn, E., de la Torre, J. R., van Rijn, J., Minz, D., and Drake, H. L., 2008.Nm143-like ammonia oxidizers and-like nitrite oxidizers dominate the nitrifier community in a marine aquaculture biofilm.,63: 192-204.
Gao, X. Y., Xu, Y., Liu, Y., Liu, Y., and Liu, Z. P., 2012. Bac- terial diversity, community structure and function associated with biofilm development in a biological aerated filter in a recirculating marine aquaculture system., 42: 1-11.
Hagopian, D. S., and Riley, J. G., 1998. A closer look at the bac- teriology of nitrification.,18: 223- 244.
Huang, Z., Jiang, Y., Song, X., Hallerman, E., Peng, L., Dong, D., Ma, T., Zhai, J., and Li, W., 2018. Ammonia-oxidizing bacte- ria and archaea within biofilters of a commercial recirculating marine aquaculture system., 8: 17.
Huang, Z., Wan, R., Song, X., Liu, Y., Hallerman, E., Dong, D., Zhai, J., Zhang, H., and Sun, L., 2016. Metagenomic analysis shows diverse, distinct bacterial communities in biofilters among different marine recirculating aquaculture systems., 24: 1393-1408.
Itoi, S., Niki, A., and Sugita, H., 2006. Changes in microbial com- munities associated with the conditioning of filter material in recirculating aquaculture systems of the pufferfish., 256: 287-295.
Jiang, W., Tian, X., Li, L., Dong, S., Zhao, K., Li, H., and Cai, Y., 2019. Temporal bacterial community succession during the start-up process of biofilters in a cold-freshwater recirculating aquaculture system., 287: 121441.
Jones, R. D., Morita, R. Y., Koops, H. P., and Watson, S. W., 1988. A new marine ammonium oxidizing bacterium,sp. nov., 34: 1122-1128.
Keuter, S., Beth, S., Quantz, G., Schulz, C., and Spieck, E., 2017. Long-term monitoring of nitrification and nitrifying commu- nities during biofilter activation of two marine recirculation aquaculture systems (RAS)., 3: 51-61.
Keuter, S., Kruse, M., Lipski, A., and Spieck, E., 2011. Rele- vance offor nitrite oxidation in a marine recircula- tion aquaculture system and physiological features of a-like isolate.,13: 2536-2547.
Kirchman, D. L., 2002. The ecology of Cytophaga-Flavobacte- ria in aquatic environments.,39: 91-100.
Kruse, M., Keuter, S., Bakker, E., Spieck, E., Eggers, T., and Lipski, A., 2013. Relevance and diversity ofpo- pulations in biofilters of brackish RAS., 8: e64737.
Leonard, N., Blancheton, J. P., and Guiraud, J. P., 2000. Popu- lations of heterotrophic bacteria in an experimental recircu- lating aquaculture system.,22: 109-120.
Lozupone, C. A., Hamady, M., Kelley, S. T., and Knight, R., 2007. Quantitative and qualitative beta diversity measures lead to different insights into factors that structure microbial commu- nities., 73: 1576- 1585.
Lozupone, C., and Knight, R., 2005. UniFrac: A new phyloge- netic method for comparing microbial communities., 71: 8228-8235.
Maixner, F., Noguera, D. R., Anneser, B., Stoeker, K., Wegl, G., Wagner, M., and Daims, H., 2006. Nitrite concentration in- fluences the population structure of-like bacteria., 8: 1487-1495.
Martins, C. I. M., Eding, E. H., Verdegem, M. C. J., Heinsbroek, L. T. N., Schneider, O., Blancheton, J. P., Roque d’Orbcastel, E., and Verreth, J. A. J., 2010. New developments in recircu- lating aquaculture systems in Europe: A perspective on envi- ronmental sustainability.,43: 83-93.
Michaud, L., Blancheton, J. P., Bruni, V., and Piedrahita, R., 2006. Effect of particulate organic carbon on heterotrophic bacterial populations and nitrification efficiency in biological filters., 34: 224-233.
Michaud, L., Lo Giudice, A., Troussellier, M., Smedile, F., Bruni, V., and Blancheton, J. P., 2009. Phylogenetic characterization of the heterotrophic bacterial communities inhabiting a ma- rine recirculating aquaculture system.,107: 1935-1946.
Pester, M., Maixner, F., Berry, D., Rattei, T., Koch, H., Lücker, S., Nowka, B., Richter, A., Spieck, E., Lebedeva, E., Loy, A., Wagner, M., and Daims, H., 2014.encoding the beta sub- unit of nitrite oxidoreductase as functional and phylogenetic marker for nitrite-oxidizing,16: 3055-3071.
Pester, M., Rattei, T., Flechl, S., Gröngröft, A., Richter, A., Over- mann, J., Reinhold-Hurek,B.,Loy, A., and Wagner, M., 2012.-based consensus phylogeny of ammonia-oxidizing ar- chaea and deep sequencing ofgenes from soils of four different geographic regions.,14:525-539.
Purkhold, U., Pommerening-Roser, A., Juretschko, S., Schmid, M. C., Koops, H. P., and Wagner, M., 2000. Phylogeny of all recognized species of ammonia oxidizers based on compa- rative 16S rRNA andsequence analysis: Implications for molecular diversity surveys., 66: 5368-5382.
Rotthauwe, J. H., Witzel, K. P., and Liesack, W., 1997. The am- monia monooxygenase structural geneas a functional marker: Molecular fine-scale analysis of natural ammonia- oxidizing populations.,63: 4704-4712.
Ruan, Y. J., Guo, X. S., Ye, Z. Y., Liu, Y., and Zhu, S. M., 2015. Bacterial community analysis of different sections of a bio- filter in a full-scale marine recirculating aquaculture system., 77: 318-326.
Rud, I., Kolarevic, J., Holan, A. B., Berget, I., Calabrese, S., and Terjesen, B. F., 2017. Deep sequencing of the bacterial mi- crobiota in commercial-scale recirculating and semi-closed aqua-culture systems for Atlantic salmon post-smolt production., 78: 50-62.
Rurangwa, E., and Verdegem, M. C. J., 2015. Microorganisms in recirculating aquaculture systems and their management., 7: 117-130.
Sakami, T., Andoh, T., Morita, T., and Yamamoto, Y., 2012. Phy- logenetic diversity of ammonia-oxidizing archaea and bacte- ria in biofilters of recirculating aquaculture systems., 7: 27-31.
Schloss, P. D., Westcott, S. L., Ryabin, T., Hall, J. R., Hartmann, M., Hollister, E. B., Lesniewski, R. A., Oakley, B. B., Parks, D. H., Robinson, C. J., Sahl, J. W., Stres, B., Thallinger, G. G., van Horn, D. J., and Weber, C. F., 2009. Introducing mother: Open-source, platform-independent, community-supported soft- ware for describing and comparing microbial communities.,75: 7537-7541.
Schreier, H. J., Mirzoyan, N., and Saito, K., 2010. Microbial di- versity of biological filters in recirculating aquaculture sys- tems., 21: 318-325.
Sorokin, D. Y., Lücker, S., Vejmelkova, D., Kostrikina, N. A., Kleerebezem, R., Rijpstra, W. I. C., Damsté, J. S. S., Le Pas- lier, D., Muyzer, G., Wagner, M., van Loosdrecht, M. C. M., and Daims, H., 2012. Nitrification expanded: Discovery, phy- siology and genomics of a nitrite-oxidizing bacterium from the phylum Chloroflexi., 6: 2245-2256.
Spieck, E., Keuter, S., Wenzel, T., Bock, E., and Ludwig, W., 2014. Characterization of a new marine nitrite oxidizing bac- terium,sp. nov, a member of the newly proposed phylum ‘Nitrospinae’., 37: 170-176.
Starkenburg, S. R., Spieck, E., and Bottomley, P. J., 2011. Me- tabolism and genomics of nitrite oxidizing bacteria: Emphasis on pure culture studies andspecies. In:Ward, B. B.,., eds., ASM Press, Washington, D. C., 267-293.
Tal, Y., Watts, J. E. W., Schreier, S. B., Sowers, K. R., and Schreier, H. J., 2003. Characterization of the microbial com- munity and nitrogen transformation processes associated with moving bed bioreactors in a closed recirculated mariculture system., 215: 187-202.
Tamura, K., Stecher, G., Peterson, D., Filipski, A., and Kumar, S., 2013. MEGA6: Molecular Evolutionary Genetics Analysis version 6.0.30: 2725-2729.
van Kessel, M. A., Speth, D. R., Albertsen, M., Nielsen, P. H., Op den Camp, H. J., Kartal, B., Jetten, M. S., and Lücker, S., 2015. Complete nitrification by a single microorganism., 528: 555-559.
Woese, C. R., and Fox, G. E., 1977. Phylogenetic structure of theprokaryotic domain: The primary kingdoms.,74: 5088-5090.
Wu, G. D., Lewis, J. D., Hoffmann, C., Chen, Y. Y., Knight, R., Bittinger, K., Hwang, J., Chen, J., Berkowsky, R., Nessel, L., Li, H., and Bushman, F. D., 2010. Sampling and pyrosequen- cing methods for characterizing bacterial communities in the human gut using 16S sequence tags., 10: 206.
Xiao, R., Wei, Y., An, D., Li, D., Ta, X., Wu, Y., and Ren, Q., 2019. A review on the research status and development trend of equipment in water treatment processes of recirculating aquaculture systems., 11: 863-895.
Zhang, H., Ma, S.,Li, Q., Fu, X., Zhang, Y., and Qu, K., 2011. Analysis of the changes of microbial community structure on bio-carrier of recirculating aquaculture system (RAS)., 32: 231-239 (in Chinese with English ab- stract).
. Tel: 0086-411-84763096
E-mail: mayuexin@dlou.edu.cn
February 1, 2020;
April 21, 2020;
September 16, 2020
(Edited by Qiu Yantao)
 Journal of Ocean University of China2020年6期
- Journal of Ocean University of China的其它文章
- Numerical Simulation and Risk Analysis of Coastal Inundation in Land Reclamation Areas: A Case Study of the Pearl River Estuary
- Variation of Yellow River Runoff and Its Influence on Salinity in Laizhou Bay
- Cold Water in the Lee of the Batanes Islands in the Luzon Strait
- Preliminary Design of a Submerged Support Structure for Floating Wind Turbines
- Inversion of Oceanic Parameters Represented by CTD Utilizing Seismic Multi-Attributes Based on Convolutional Neural Network
- Trace-Norm Regularized Multi-Task Learning for Sea State Bias Estimation
