Use of family structure information in interaction with environments for leveraging genomic prediction models
Reyn Pers, Hiroyoshi Iwt, Diego Jrquin,*
aDepartment of Agronomy and Horticulture, University of Nebraska–Lincoln, Lincoln, NE 68583, USA
bGraduate School of Agricultural and Life Sciences, The University of Tokyo, Bunkyo, Tokyo 113-8657, Japan
ABSTRACT
1.Introduction
Important economic traits such as grain yield,protein,and oil contents are relevant for feeding the growing population and ensuring the food supply demands around the world[1].Estimations from the Consulting Group for International Agricultural Research(CGIAR)indicate that by 2050 the growing world population with shifting consumption patterns will require agriculture to deliver 60% more food[2].In addition,per each degree Celsius above the historical levels,it is expected a decrease of approximately 5%in crop productivity[2,3].Thus,it is crucial to not only increase the productivity of the current elite varieties but also develop new materials able to cope with the challenges of the ever-changing environmental conditions.
In the last years,several statistical methods for forecasting crop performance in plant breeding applications have been proposed.Some of these consider to coping with the well-known problem of inconsistent response patterns of genotypes under different environmental stimuli[4].These inconsistencies usually complicate the breeder’s labor of selecting stable materials outperforming others in a wide range of environmental conditions[5].The occurrence of this phenomenon is also known as the presence of genotype-by-environment interaction(GE).
Usually,the environments(E)are defined as the locationby-year combination for annual crops while the G term is used to refer to individuals.The environmental factors have an essential repercussion on complex traits(traits affected for a large number of small gene effects)since the extent and direction of the gene effects are modulated by the environmental stimuli that plants face in fields.In order to find/develop superior cultivars across a wide set of environmental conditions,genotypes are routinely observed in different years and locations[6].The assessment of GE in agriculture is critical to enhance the selection of genotypes with desirable characteristics across a diverse set of environmental conditions.
Several studies[7–9]have demonstrated that accounting for by the GE component in prediction models can result in significant improvements in predictive ability.Potentially,this can help breeders to make better decisions about the materials to consider in their programs.Burgeno et al.[7]introduced the GE interaction term in prediction models via the estimation of parsimonious between-environments covariance structures.Later,Jarquin et al.[10]proposed a reaction norm model for accommodating the interaction between molecular markers and environmental factors.The previous models also allow modeling the GE interaction when pedigree data is available[8].
In several research experiments,the populations are composed of structured families[11,12](e.g.,nested association mapping[NAM],https://www.soybase.org/SoyNAM/)and usually these are evaluated in a wide range of environmental conditions.Therefore,the information contained in the response of families to different environmental stimuli can be used for enhancing the selection process in target environments.The family information has been introduced in prediction models via the pedigree information[9,13];however,the identification of individuals in bi-parental populations is not feasible using this information only.
In this article,we propose a model that extends the reaction norm model by adding the interaction between families(F)and environmental(E)factors(FE).We evaluated the model using a sample of the soybean NAM population[12,14]comprising 38 bi-parental families(1358 genotypes)evaluated in 18 environments(16,187 grain yield records)during 2011,2012,and 2013 in the US-North Central Region.Two prediction scenarios(CV2:incomplete field trials,and CV1:predicting new materials)that breeders face in field experiments were considered for assessing the predictive ability of the models under a twofold validation.For CV2,50%of the phenotypes were assigned to training and testing sets.Under CV1,50% of the genotypes were assigned to training and testing sets.For CV2,the genotypes have at least one-field observation but in an environment different to the target one;while for CV1,we are interested in predicting the performance of genotypes not evaluated yet in any field trial.
The obtained results showed a significant improvement in predictive ability by including the FE term in comparison with the model that only includes the main effects of the molecular markers and with the conventional reaction norm model.For the CV2 scheme,the predictive ability of the proposed model(0.569)outperformed by 41% the main effects model(0.404)and around 16%to the reaction norm model(0.491).Under the CV1 scheme,the proposed model(0.545)improved around 48%the predictive ability of the main effects model(0.369)and in about 18%to the conventional reaction norm model(0.460).These results highlight the importance of considering the interaction between the family structure and environments in prediction models for enhancing the predictive ability of tested and untested genotypes aiding the selection of superior cultivars.
2.Materials and methods
2.1. Phenotypic data
A subset of grain yield (GY) measures from the soybean Nested Association Mapping (SoyNAM) population (https://www.soybase.org/SoyNAM/) was analyzed (Table S1). Briefly,the SoyNAM data set comprises 40 bi-parental families sharing a common hub parent (IA3023). These families were tested in 10 locations in the US North Central Region for three years (2011–2013, not all locations were observed in all years,and not all of the families were observed in all environments)for a total of 18 environments (year-by-location combination).Measures on eight traits were collected (grain yield, moisture,protein, oil, fiber, seed size, maturity, and lodging); however,grain yield was the only trait measured across all of the environments while the other traits were sparsely recorded in few environments. A comprehensive description of the SoyNAM data set can be found in [12,14]. Due to computational issues (not enough RAM for handling operations with very large matrices) in this study, we considered a representative sample of the original SoyNAM dataset. The selected sample contains information on 38 families and the size of these varied between 18 and 61 genotypes per family (Table S2; mean of 36 and standard deviation of 9.8). Table S3 contains the phenotypic information of those genotypes considered in this study.A total of 16,187 grain yield records remained for analysis.Fig.1(left panel)depicts the genotype environment combinations with(vertical gray lines)and without(white vertical)phenotypic information available for analysis.
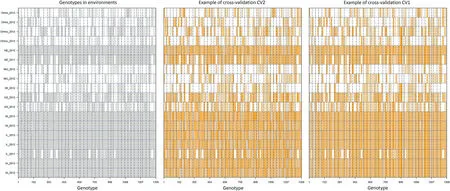
Fig. 1– Observed genotypes in environments and cross-validation scenarios. Left panel: Graphical representation of the distribution of 1332 soybean genotypes (belonging to 38 families) observed in 18 environments (not all the genotypes observed in all environments; 66.2% of the total potential cells were observed); the vertical gray color lines correspond to the observed genotype-environm ent combinations while the white lines correspond to the non-observed combinations; the horizontal blue dashed lines separate the different environments (18) while the vertical black dashed lines separate the different fam ilies (38). Center panel: Graphical representation of the crossvalidation CV2 (incomplete field trials; predicting tested genotypes) for a twofold validation where 50% of the phenotypes is used as training set (vertical gray lines) for predicting the performance of the rem aining 50% (vertical orange lines). Right panel: Graphical representation of the cross-validation scheme CV1 (newly developed lines;predicting untested genotypes) for a twofold validation where 50% of the genotypes is used as training set (vertical gray lines) for predicting the performance of the remaining 50% (vertical orange lines) across environments.
2.2.Genomic data
A 6K array was used for sequencing the genotypes of the SoyNAM data set[12,14].After applying conventional quality control(discard those molecular markers with more than 50%of missing values and those with a minor allele frequency smaller than 0.03[MAF<0.03]),4250 molecular markers were available for analysis.
2.3.Models
2.3.1.M1:environment plus genotype effects
The response of the ith genotype in the jth environment can be explained as the sum of a constant effect(μ)common to all genotypes across all environments,an environmental effect(Ej)corresponding to the jth environment(which is common to all genotypes tested in that environment),and a line effect of the ith genotype(Li)(which is common across environments).The non-explained phenotypic differences of genotypes within and across environments are addressed to the model error termϵij.The described linear predictor can be written as follows:


2.3.2.M2:environment plus genotype and genomic effects


2.3.3.M3:reaction norm model


2.3.4.M4:extended reaction norm model for including family structure


The above described models were fitted using the BGLR Rpackage[18].All the statistical analyses were performed with the R-software R Core Team[19].
2.4.Cross-validation schemes
For testing the proficiency of the models for delivering accurate predictions,two different cross-validation schemes were considered in this study(CV2 and CV1).CV2 mimics the scenario of predicting incomplete field trials where some genotypes are observed in some environments but not in others.The goal is to predict the performance of those genotypes in the environments where these were nonobserved.For this,a twofold validation was designed with about 50%of the phenotypic values comprising the training set and the remaining 50%the testing set.Here one fold was used as training set for predicting the other one(testing set)and vice-versa.Fig.1(center panel)provides a graphical representation of the assignation of phenotypes to folds for CV2.There the phenotypes are randomly assigned to the training set(vertical gray lines)and these are used for predicting those phenotypes in the testing set(vertical orange lines).
CV1 considers the scenario of predicting crop performance of genotypes not previously tested in any of the environments.In this case,we lack of phenotypic information for these genotypes.Thus,the phenotypic information from other genotypes is used for model calibration.Similar to the previous cross-validation scheme,a twofold validation was implemented.However,under this cross-validation scheme,genotypes are assigned to folds instead of phenotypes such that 50%of the genotypes comprise the training set while the remaining 50% conform to the testing set.In this way,we ensure that all the phenotypic records from the same genotype,but observed in different environments,are assigned to the same fold.Thus,no phenotypic records from the same genotype observed in different environments are encountered at the same time in both folds.Fig.1(right panel)provides a representation of the assignation of genotypes to folds for CV1.There,the genotypes are randomly assigned to the training set(vertical gray lines)and these are used for predicting those genotype-environment combinations that belongs to the testing set(vertical orange lines).
The random assignation(training and testing sets)for each of the two cross-validation schemes was repeated 100 times.We conducted the validation in both folds.The crossvalidation consisted of using one fold for predicting the other and vice-versa.This means,that the initial training set later became the testing set and the initial testing set served as its corresponding training set.
2.5.Assessment of prediction accuracy
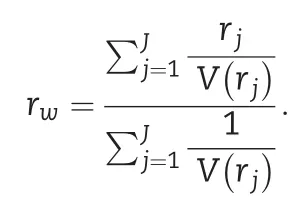
The model’s ability to perform predictions was assessed on a trial basis.Thus,the Pearson correlation between predicted and observed values was calculated considering only the genotypes observed within the same environment.Here,the vector of predicted values was integrated into a single vector such that this vector contains the across environments predictions from the two folds.Then,the Pearson correlation between predicted and observed values was computed for each environment.

3.Results
3.1. Phenotypic analysis
Table S1 contains the environmental means, their corresponding standard deviations (SDs), and the number of genotypes tested on each of the 18 environments. Fig. 2 depicts the boxplot of the grain yield measures for the 18 environments of the analyzed sample from the soybean NAM population (1358 genotypes and a total of 16,187 grain yield records). Table S2 presents the means, corresponding SDs,and the number of genotypes randomly selected for this study for each one of the 38 bi-parental families across environments. The environments were ordered based on the correlation of the best model (M4) for predicting untested genotypes (CV1). Those environments that showed the lowest correlations appear first on the left side.
Around 66% (16,187) of the total potential number of combinations between genotypes and environments(1358 × 18 = 24,444) were considered for analysis.
3.2. Variance components
The amount of variability captured for the different components of the models was computed by implementing a full data set analysis (i.e., no missing values were considered for model fitting). Table 1 shows (i) the percentage of the total phenotypic variance explained by the different model components; and (ii) the percentage of within-environments variance (i.e., after ignoring the environment term E). As it was expected, the E component captured the largest percentage of variability. It ranged between 55.9% and 61.2% for the different models with M3 reducing the amount of the variability explained by the E term the most.
Under M1, the genotype term (L) explained 7.8% of the total variance. When the molecular marker information (G) was introduced with M2, the variability of the L term was reduced to 1.8% and with G explaining 7.6%. The amount of variability explained by these two components(L and G)in M3 remained practically unchanged,while the GE interaction explained 12.6%.With this model,the residual variance was reduced the most from 31.0% to 22.7%.This provides evidence of the importance of modeling the interaction terms in prediction models.When the family by environment(FE)interaction was included with M4,the amount of variability explained by the main effect of the molecular markers(G)was reduced from 6.8% to 0.8%.There the main effect of the family component explained 6.5% of the total variance,while the FE interaction captured 8.0%.
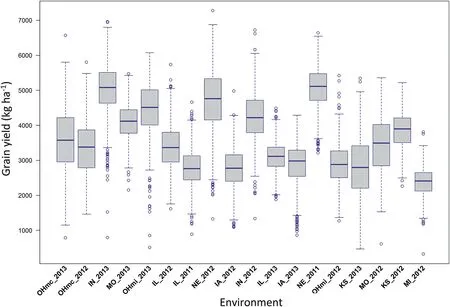
Fig.2–Boxplot for grain yield measures(kg ha-1,y-axis)of a sample of a soybean Nested Association Mapping population comprising of 1358 genotypes derived from 38 bi-parental families tested in 18 environments(x-axis)in 2011,2012,and 2013.
Regarding the within-environments variability,the main effect of the molecular markers became the main source for explaining yield differences in M2 with this component explaining 18.7% of the remaining variability.However,under M3 the GE component became the most important source of variability capturing 28.4% of the within environments variance.The inclusion of F(14.7%)and the FE interaction(18.2%)considerably reduced the amount of variability explained by G and by the GE interaction from 15.5%to 1.9%and from 28.4%to 5.6%,respectively.
3.3.Predictive ability
Table 2 shows the weighted average Pearson correlation across the 18 environments for the cross-validation scenarios CV2 and CV1.For CV2,the model that does not consider molecular marker information(i.e.,M1)returned a weighted average correlation of 0.344,while the inclusion of the main effect of the molecular markers G(M2)shifted this value to 0.404.The addition of the GE component improved the performance of the previous model around 22%by increasing the predictive ability from 0.404 to 0.491.Using the most comprehensive model(M4),the inclusion of the interactionbetween the family structure and the environments increased the predictive ability to 0.569.This represents an improvement of 41%and 17%with respect to the M2 and M3 models.

Table 1–Estimated variance components and percentage of within environment variance explained by the model components for four prediction models.

Table 2–Weighted average Pearson correlation across 18 environments for four models(M1–M4)used to predict grain yield of a sample of a soybean Nested Association Mapping population comprising 1358 genotypes and 16,187 phenotypes for two different cross-validation schemes(CV2 and CV1)under a two-fold design.
Figs.3 and 4 depict the average predictive ability and its corresponding SD across 100 replicates(colored vertical lines)for each environment under CV2 and CV1 schemes,respectively.In both cases,the environments were ordered based on the average predictive ability obtained with M4 from the CV1 scheme.Under CV2(Fig.3),the average predictive ability of the phenotypic model(M1)ranged between 0.113(MI_2012)and 0.488(NE_2011).With the addition of the molecular marker data(M2),the predictive ability ranged between 0.098 and 0.549 coinciding these extremes with the same environments.Since there is available information of the genotypes to be predicted but observed in other environments,no significant improvements are expected with the inclusion of the molecular markers G under the CV2 scheme.When the GE interaction term was added with M3,the smallest(0.215)and the highest(0.592)average correlations were respectively observed in OHmc_2013 and NE_2011.The most comprehensive model(M4)shifted these values to 0.243 and 0.700 for the same environments.In most of the cases,the differences in predictive ability were beyond the range of plus-minus one standard deviation for M4 with respect to the other models(colored vertical lines at each one of the environments).Thus,we can conclude that M4 significantly outperformed M1–M3 models.
Predictions were implemented under the incomplete field trials scheme(CV2)using four prediction models under a twofold cross-validation.M1:E+L,M2:E+L+G;M3:E+L+G+GE and M4:E+L+F+G+GE+FE,where E,L,F and G correspond to the main effect of the environments,genotypes,families,and molecular markers;and GE and FE resemble the interaction between each molecular marker with environments and the interaction between families and environments,respectively.
Predictions were implemented under the scheme of predicting newly genotypes(CV1)using four prediction models under a two-fold cross-validation.M1:E+L,M2:E+L+G;M3:E+L+G+GE and M4:E+L+F+G+GE+FE where E,L,F,and G correspond to the main effect of the environments,genotypes,families,and molecular markers;and GE and FE resemble the interaction between each molecular marker with environments and the interaction between families and environments,respectively.
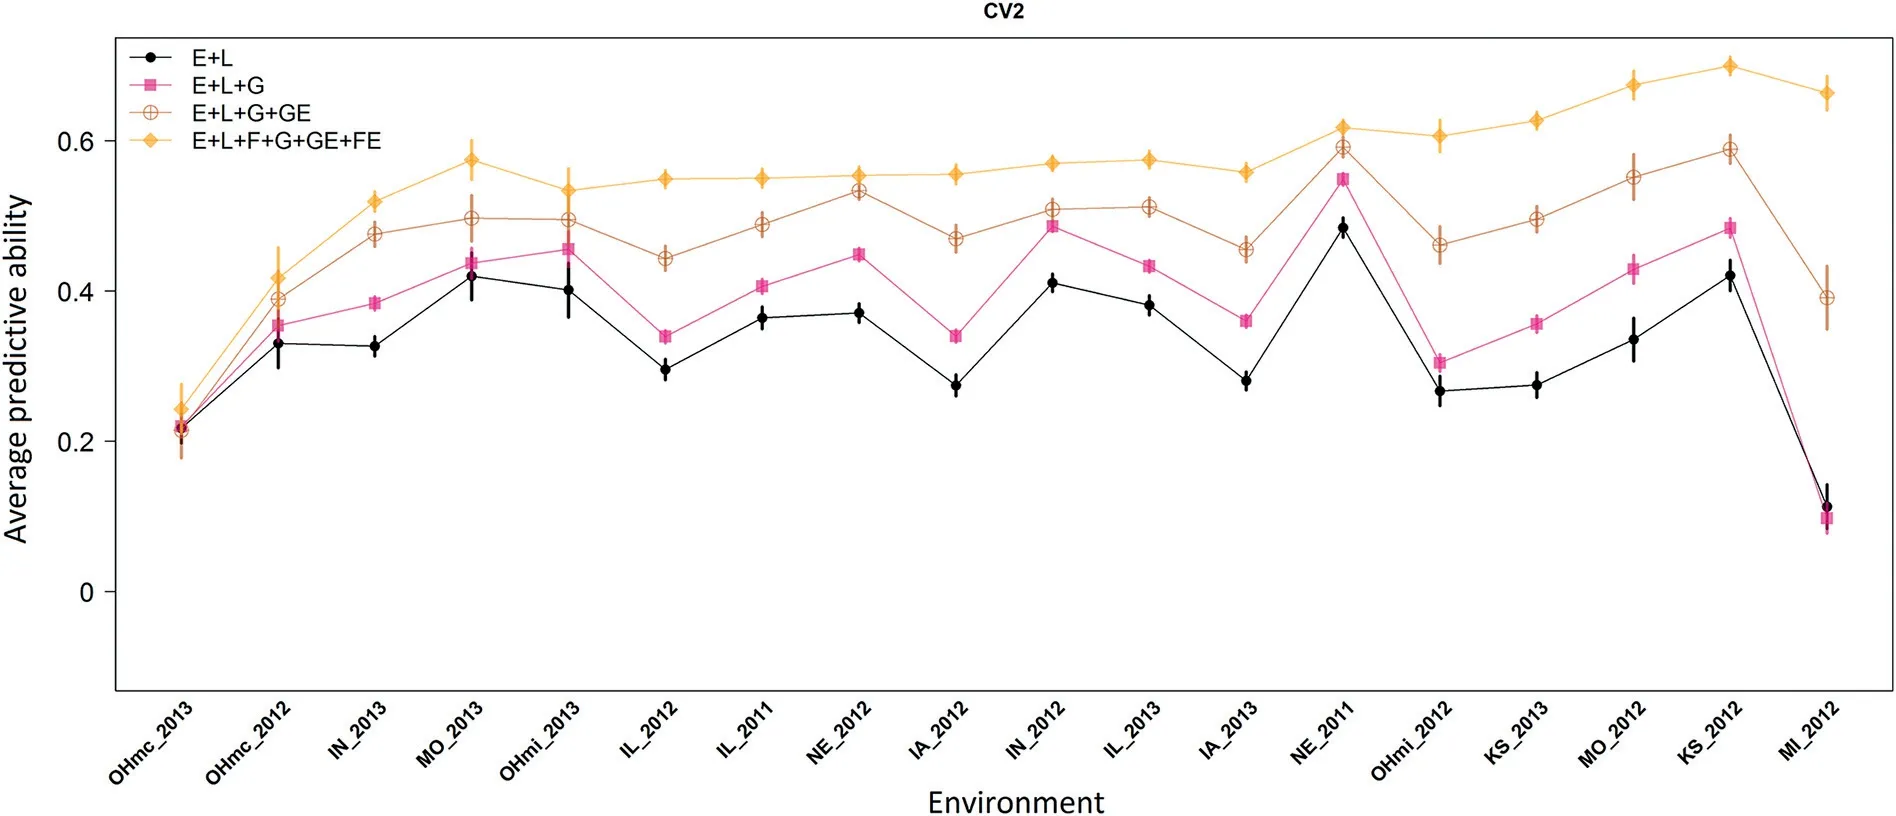
Fig.3–Average predictive ability(100 replicates;y-axis)and standard errors(vertical colored lines)of a sample of a soybean Nested Association Mapping population(38 bi-parental families)tested in 18 environments(x-axis)in 2011,2012,and 2013 under the CV2 scheme.
A more detailed assessment of the model’s proficiency can be done by analyzing the classification success/error rate in predetermined yield quantiles of the observed values with respect to the predicted values.Fig.5(CV2)and Fig.6(CV1)contain the scatter plot of the predicted genetic component(i.e.,the estimated environmental effect was omitted;x-axis)and the adjusted(environmental mean)observed(y-axis)values after accounting by their corresponding environmental means.For the CV2 scheme,using the M2 model(left side panel in Fig.5),when the top 20% of the predicted values are selected around 69%(0.35+0.34)of these showed a performance in fields above the mean.Here,35% of the top 20% of the selected genotypes performed in fields as was expected(i.e.,these also showed a performance in fields above the 80%threshold line).The corresponding adjusted line returned an R-squared of 0.15.
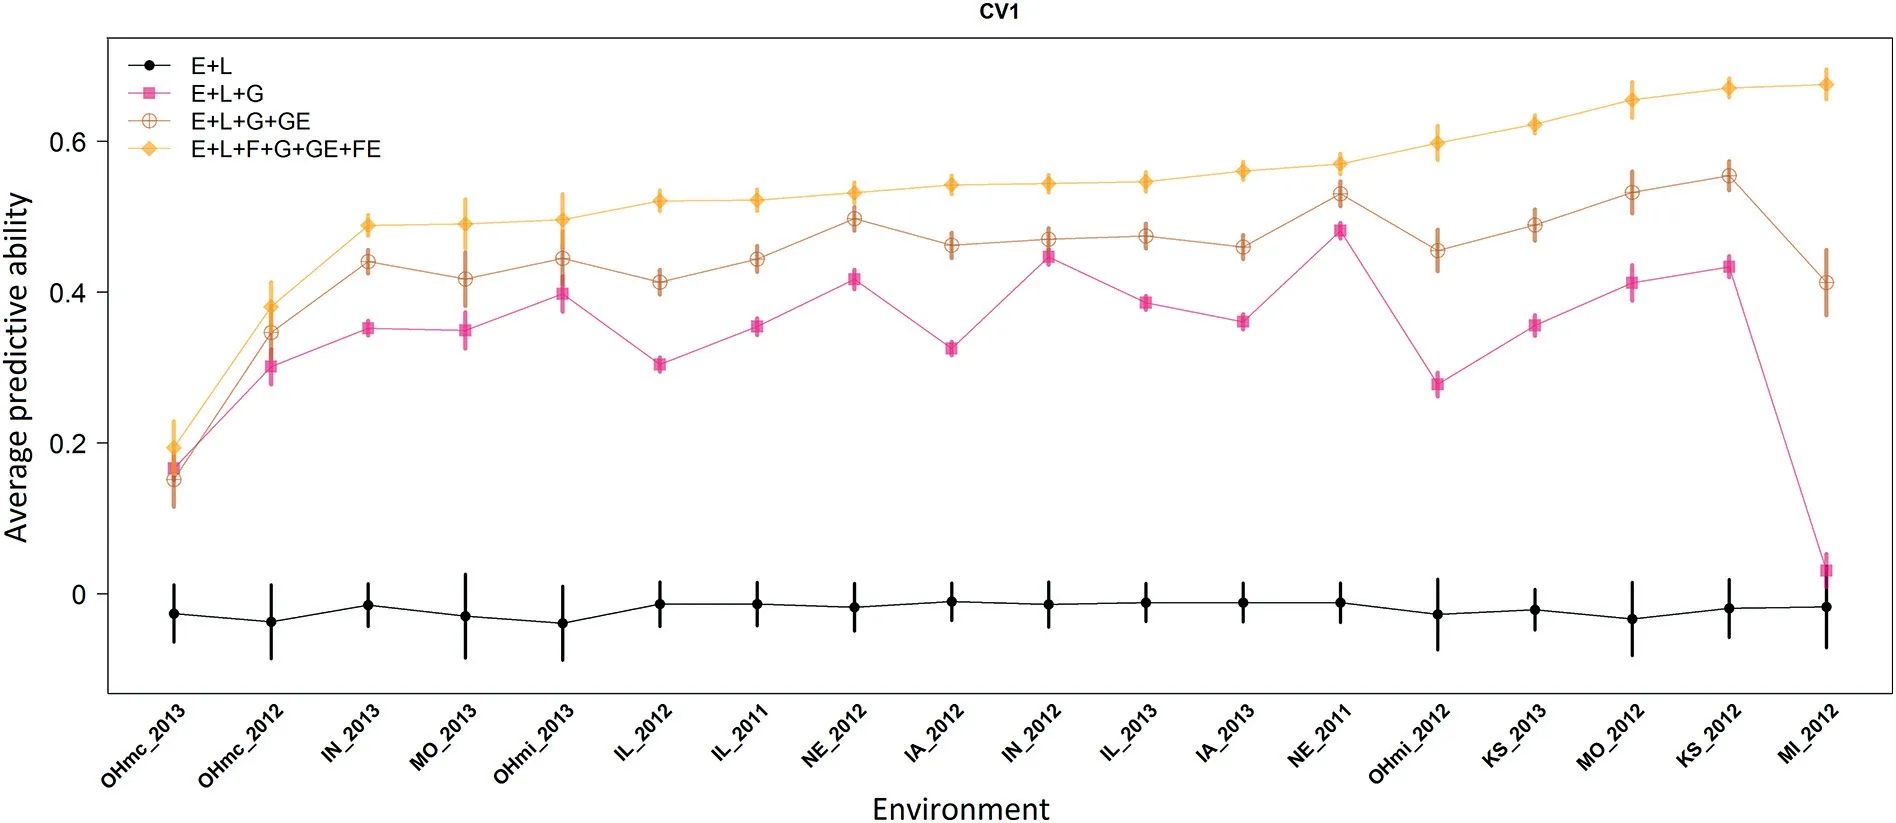
Fig.4–Average predictive ability(100 replicates;y-axis)and standard errors(vertical colored lines)of a sample of a soybean Nested Association Mapping population(38 bi-parental families)tested in 18 environments(x-axis)in 2011,2012 and 2013 under the CV1 scheme.
The panel in the center in Fig.5 depicts the corresponding scatter plot obtained with the M3.In this case,out of the top 20% of the predicted values,77% showed a performance in fields above the mean;42%of these observed values showed a performance above the 80%threshold line.Under this model,an R-squared of 0.23 was obtained.The scatter plot corresponding to M4 appears in the right panel of Fig.5.Here,81%out of the top 20% of the predicted values showed a performance in fields above the mean and 47% of these observed values performed above the 80%threshold line.The corresponding fitted line returned an R-squared of 0.3.This represents an improvement of the goodness-of-fit of about 30%with respect to the conventional reaction norm model.
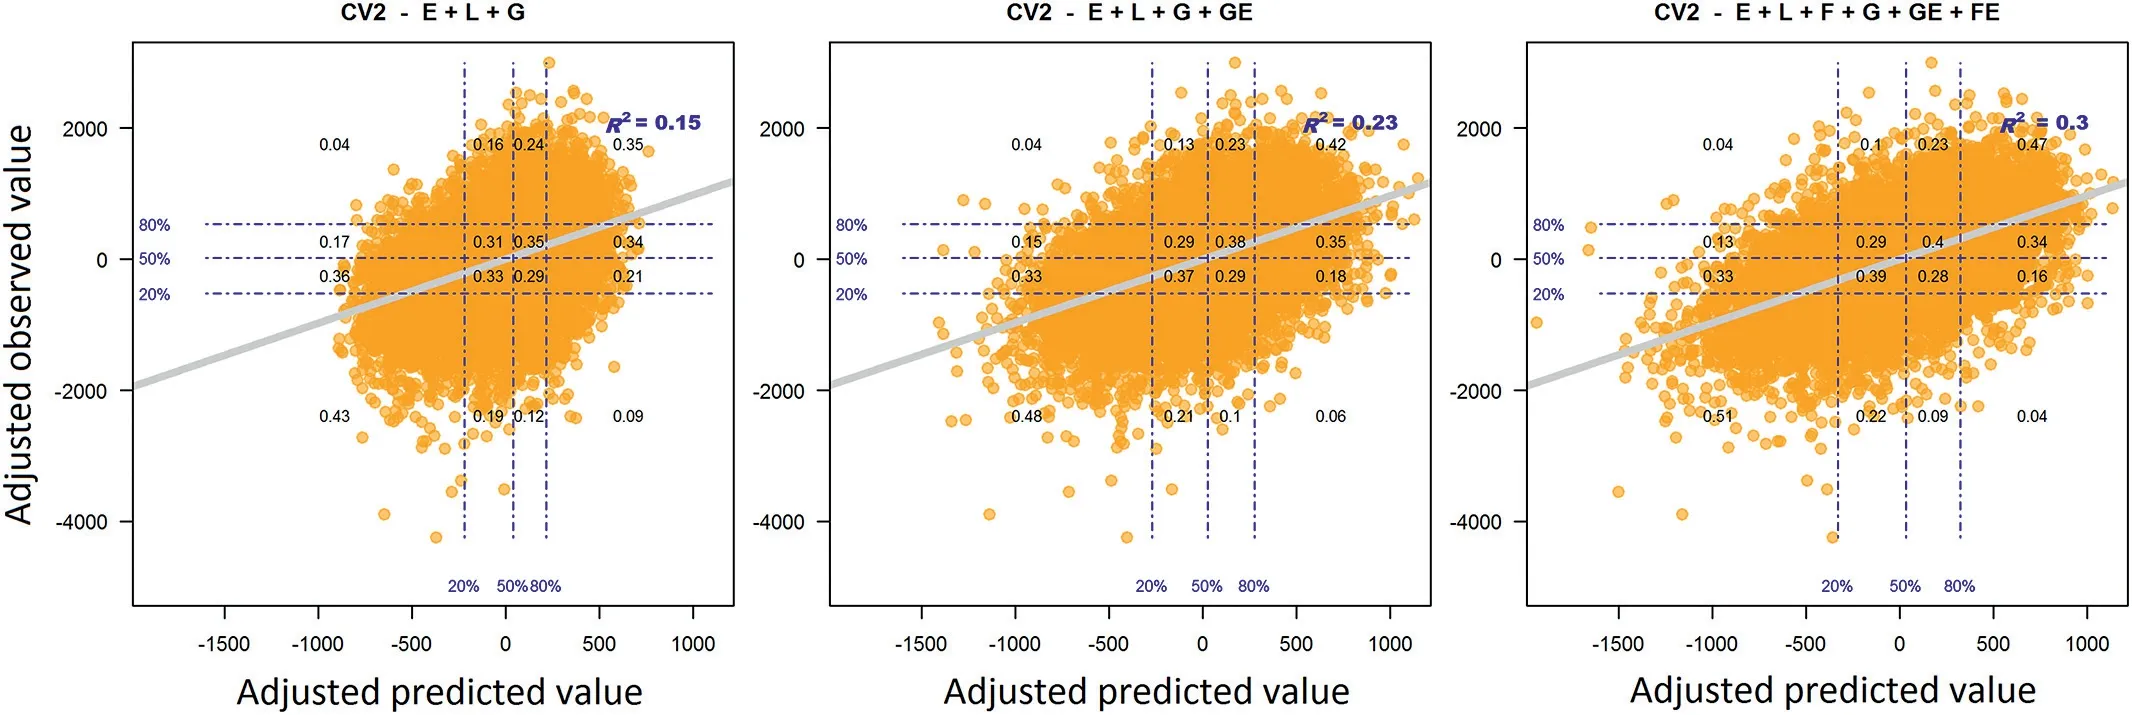
Fig. 5 – Conditional probabilities of the performance in fields of the adjusted (by the environmental means) phenotypes (yaxis) on the adjusted predicted values (x-axis) across 18 environments under the CV2 cross-validation scheme for models M2–M4. Horizontal and vertical dashed lines provide the empirical percentiles 20%, 50%, and 80% of the adjusted values. The values in the anti-diagonal correspond to the correct classification rate while the values in the off anti-diagonal represent the classification error rate. The colored gray line corresponds to the fitted line and it provides the information about the model fitting (R2).

Fig.6–Conditional probabilities of the performance in fields of the adjusted(by the environmental means)phenotypes(x-axis)on the adjusted predicted values(x-axis)across 18 environments under the CV1 cross-validation scheme for models M2–M4.Horizontal and vertical dashed lines provide the empirical percentiles 20%,50%,and 80%of the adjusted values.The values in the anti-diagonal correspond to the correct classification rate while the values in the off anti-diagonal represent the classification error rate.The colored gray line corresponds to the fitted line and it provides the information about the model fitting(R2).
Under the CV1 scenario,the model that does not include molecular marker information(M1)returned a weighted average correlation close to zero(-0.017).Since this model does not include phenotypic information of the untested genotypes neither genomic information for connecting calibration and testing sets,a poor performance is expected with its implementation.When the G component was included(M2),the average correlation increased to 0.369.The inclusion of the GE interaction(M3)shifted the weighted predictive ability to 0.460 representing this an improvement of about 26% with respect to M2.The consideration of the interaction between the family structure and the environments produced a weighted average correlation of 0.545.This corresponds to a relative improvement of 49% with respect to M2 and of 18%with respect to M3.
At the trial level(Fig.4),M1 showed a poor performance.Here the average correlation ranged between-0.039(OHmc_2013)and-0.010(IA_2012).The inclusion of molecular marker data(M2)shifted these values to 0.031(MI_2012)and 0.482(NE_2011).The GE interaction(M3)helped to increase these values to 0.152(OHmc_2013)and 0.554(KS_2012).Using the most comprehensive model(M4),these values were improved to 0.194(OHmc_2013)and 0.675(MI_2012).Similar to the CV2 scheme,the results from M4 significantly outperformed the other models with differences in predictive ability beyond the range of plus-minus one standard deviation(colored vertical lines at each one of the environments).
The plot with the conditional probabilities shows that for M2(left side panel in Fig.6),67%(0.33+0.34)out of the top 20%of the predicted values have a performance in fields above the mean with 33% of these classified among the top 20% of the observed values.The corresponding fitted line returned an Rsquared of 0.13.For M3(center panel in Fig.6),75%(0.42+0.35)out of the top 20% of the predicted values showed a performance in fields above the mean with 42% correctly classified in the high yielding quantile(i.e.,above the 80%threshold line).This model returned an R-squared of 0.21.
With the most comprehensive model(M4,right side panel in Fig.6)about 80%out of the top 20%of the predicted values showed a performance in fields above the mean with 46% of these being classified in the correct category(i.e.,above the 80% threshold line of the corrected phenotypes).The fitted line returned an R-squared of 0.29,representing an improvement of about 38% with respect to the conventional reaction norm model(M3).The above-described results show the advantages of including the family component in interaction with environments in prediction models.
4.Discussion
Genotype by environment interaction plays a key role for shaping crop performance of genotypes under different environmental stimuli and its understanding is crucial for breeding applications.Several authors have proposed the inclusion of the GE interaction in prediction models[7,10,21].Some of these authors modeled the GE component as the interaction between molecular markers and environments[10,21],between molecular markers and environmental covariates[10],and between pedigree and environmental factors[8].Basnet et al.[22]combined the interaction between pedigree and environmental covariates and the interaction between molecular markers and environmental covariates for improving wheat hybrid prediction for targeted genotypes.In all these cases,the inclusion of the GE interaction significantly improved the ability of the models for delivering accurate ranking predictions.
Several multi-parent experiments with highly stratified structures(NAM)have been conducted in multi-environment trials for studying the genetic basis of complex traits[23]in several crops[11,12].One main objective of these experiments is the genetic dissection of the yield potential and other important agronomic traits for varietal development with the aim of accelerating genetic improvement.For this objective,association-mapping studies are conducted to find chromosomal regions of genes driving statistical differences of crop performance in bi-parental populations.
Genomic selection is a methodology that targets the improvement of varieties by using predicted values of untested genotypes as surrogates of phenotypes during the selection procedure.In order to accomplish this,the information of dense molecular markers is needed.In this case,the phenotypic responses are regressed considering the joint effect of all the available molecular markers.When the molecular marker information is not available,the pedigree information can be used instead.Several studies[7,13,22,24]have shown similar results in predictive ability by using molecular marker data,pedigree information,and combining both sources for establishing genetic relationships among pairs of individuals.However,when pedigree data is not available or dealing with bi-parental populations where all the individuals within the family share the same parents,it is not possible to select individuals based on predictions.For example,in bi-parental populations,the pedigree information within families is the same for all individuals in the family complicating the identification of superior genotypes.In this case,the use of pedigree data is not adequate because there is not possible to account for the segregation that occurs in biparental populations.
In this study,we propose an extension of the reaction norm model that leverages the family structure of highly stratified populations in the prediction context.This model includes in addition to the interaction between molecular markers and environments,the interaction between the family factor and environments.For assessing the proposed model,a sample of the soybean Nested Association Mapping population comprising 38 bi-parental families with a common hub parent(IA3023)tested across 18 environments for three years(2011,2012,and 2013)was used.A total of 16,187 grain yield data points were used in a twofold cross-validation(50%for training and 50%for testing)under two cross-validation scenarios(CV2:predicting tested genotypes in observed environments,and CV1:predicting untested genotypes in observed environments).
The results in Table 1 showed the importance of taking into account the family factor in the prediction models.Here,under M4 the variability accounted for by the main effect of the families and the family-by-environment interaction significantly reduced the amount of variability addressed by the main effect of the molecular markers and of the interaction between molecular markers and environments compared with M3.Also,the percentage of variability accounted for by the G term was reduced from 6.8% to only 0.8% while for the GE term it was reduced from 12.6% to only 2.5%.This suggests that the introduction of the family structure in interaction with environments can potentially enhance the predictive ability of the models for predicting tested and untested genotypes.
The levels of predictive ability across environments under the CV2 scheme,showed that the proposed model(M4)significantly outperformed the results derived from models M2 and M3 by 41% and 16%,respectively.Analyzing the trialby-trial correlations,surprisingly we found that when some environments(e.g.,MI_2012)showed a poor correlation(~0.1)under M1 and M2 the proposed model significantly increased the predictive ability up to 0.663.In Fig.3,we observed that the reaction norm model(M3)was always superior to the main effects model(M2);however,the proposed model(M4)outperformed all the other models(M1–M3)in all environments.In most of the cases,the differences in predictive ability were beyond one and up to two standard deviations.Several authors[7,9,22]have shown similar improvements in predictive ability when modeling the GE using molecular markers,pedigree or jointly molecular markers and pedigree.Here,despite the fact that no pedigree information was available,we still were able to leverage the family information in the prediction models.
A more detailed analysis of the superiority of the proposed model for predicting incomplete field trials was shown in Fig.5.There we observed that after correcting the predicted and observed values by their corresponding environmental means,M4 exhibited the largest R-squared(0.3)with respect to the main effects model(M2,0.15)and the conventional reaction norm model(M3,0.23).In addition,the classification rate of the expected phenotypes in the high yielding group/quantile(performance in fields in the top 20%)was improved from 0.35(M2)and 0.42(M3)to 0.47(M4).In a similar way,the classification error(i.e.,the values in the off anti-diagonal of the grids in the plots)of the predicted values into the different yielding groups was systematically reduced.
Although the family factor does not add information at the genotype level for individuals within the same bi-parental population,it captures a large amount of phenotypic variability across families and across environments allowing a better fit of the model.Perhaps,the family structure in interaction with environments is also capturing the epistatic effects that cannot be explained by the additive model due to lack of fully informative genome data.This was also evident when analyzing the results of the CV1 scenario.Since these genotypes have not been observed in any environment yet,the prediction accuracy strongly depends on the genomic relationships between the genotypes in training and testing sets.The results from M4 under this scenario are promising because these significantly improved the conventional models by 18%(M3)and 49%(M2).Here,the reaction norm model(M3)outperformed the main effects model(M2)in about 26%.Similar levels of improvement using the reaction norm model over the main effects model have been shown in other studies[8–10,24]when analyzing wheat,cotton,and maize datasets.
The inclusion of the family structure in interaction with environments not only resulted in a significant improvement of the results from the already successful reaction norm model but also this model helped to restore the predictive ability in those environments where the conventional prediction models showed a poor performance(Fig.4).For example,in MI_2012 the main effects model(M2)returned an average correlation of 0.031(SD:0.022).There,the M3 and M4 models returned an average correlation of 0.42(SD:0.043)and 0.675(SD:0.020),respectively.Hence,the new model(M4)not only increased the average predictive ability compared with M3 but also significantly reduced the standard deviation by half from 0.046 to 0.023.Similar to the CV2 scheme,under the CV1 scheme the use of the family factor helped to improve the model fitting from 0.13(M2)and 0.21(M3)to 0.29(M4).Also,the classification rate of the genotypes in the high yielding group(top 20%)was improved from 0.33(M2)and 0.42(M3)to 0.46(M4).
The above-discussed results provide evidence of the importance of including the family factor for leveraging crop yield prediction of incomplete field trials and of untested genotypes across environments.The borrowing of information between families in the same environments and across environments equipped the proposed model with the ability to enhance the proficiency of the model for improving predictive ability under the CV2 scheme.In addition,the borrowing of information of individuals within the same family but observed in other environments helped during the prediction of newly developed genotypes(CV1).Although these results are very encouraging,there are still some issues to address like the need of always having to observe at least a portion(e.g.,one individual)of each bi-parental family in the same environment or in other environments to allow this method to work properly.Since the proposed method needs partial information of the phenotypic records of the families to be predicted,no significant improvements are expected when predicting a complete family yet to be observed.The inclusion of family structure in prediction models opens a new venue of research for studying the family’s model sensitivity to environmental factors when there is available information on weather data and biotic stressors.
5.Conclusions
In this study,we proposed a model that takes advantage of the family structure in interaction with environments for leveraging predictive ability of tested(CV2:incomplete field trials)and untested(CV1:newly developed genotypes)genotypes across environments.We tested and contrasted the performance of the proposed model with three conventional prediction models and found that the inclusion of the family structure explained a sizable amount of the phenotypic variability.In addition,the inclusion of this information significantly helped to improve the model’s proficiency when predicting tested and untested genotypes by leveraging the predisposition of the performance of the families to specific environmental stimuli.A special mention deserves the fact that this model was able to significant increase the levels of predictive ability in those environments where the conventional models returned poor accuracies.In addition,the proposed model improved the classification rate of the genotypes with high yield performance.The obtained results suggest that the proposed model can be used in breeding programs with moderate or strong family structures to help breeders to make more informed decisions about the materials to keep and/or advance in their programs.
Supplementary data for this article can be found online at https://doi.org/10.1016/j.cj.2020.06.004.
Declaration of competing interest
Authors declare that there are no conflicts of interest.
Acknowledgments
This project was supported by the Agriculture and Food Research Initiative Grant(NEB-21-176)from the USDA National Institute of Food and Agriculture,Plant Health and Production and Plant Products:Plant Breeding for Agricultural Production,A1211,Accession No.1015252.We are also thankful to two anonymous reviewers and the assigned editor for their valuable comments,suggestions,and positive criticisms to a previous version of the manuscript.
Author contributions
Reyna Persa integrated the different data sets,performed the data analysis,analyzed the results,and wrote the first draft of the manuscript.Hiroyoshi Iwata contributed to the discussion section,commented on the applications of genomic selection method in bi-parental populations,and wrote the first draft of the document.Diego Jarquin conceptualized the study,supervised the data and results analysis,and contributed to the first draft.
- The Crop Journal的其它文章
- Quantitative genetic studies with applications in plant breeding in the omics era
- Brief Guide for Authors
- META-R:A software to analyze data from multi-environment plant breeding trials
- Modeling and simulation of recurrent phenotypic and genomic selections in plant breeding under the presence of epistasis
- A sulfotransferase gene BnSOT-like1 has a minor genetic effect on seed glucosinolate content in Brassica napus
- Genome-wide prediction in a hybrid maize population adapted to Northwest China

