雅鲁藏布江中下游含氮化合物的分布特征及来源解析
孙文青,陆光华,薛晨旺
雅鲁藏布江中下游含氮化合物的分布特征及来源解析
孙文青,陆光华※,薛晨旺
(西藏林芝高山森林生态系统国家野外科学观测研究站,西藏农牧学院水利土木工程学院,林芝 860000)
作为世界上海拔最高的大河之一,雅鲁藏布江集中了西藏地区一半以上的水资源。随着梯级水电站的开发,人类活动的影响大大增加,可能改变雅鲁藏布江及周边的生态环境,进而对河流氮循环产生影响。为深入理解水体含氮化合物的赋存演变规律,定量分析其来源,在雅鲁藏布江中下游及其主要支流设置11个采样点,研究了雅鲁藏布江中下游水体中含氮化合物赋存形式和时空分布特征,结果表明:溶解性有机氮(Dissolved Organic Nitrogen,DON)和硝态氮(NO3--N)是溶解性总氮(Total Dissolved Nitrogen,TDN)的主要形式,枯水期TDN的浓度高于丰水期,沿程呈现下降趋势。结合氮氧同位素技术和稳定同位素模型对水体中的NO3-进行了源解析。15N-NO3-和18O-NO3-的变化范围分别为-9.17‰~22.7‰和-13.3‰~8.24‰。NO3-主要来自降雨及肥料、土壤有机氮以及污水和粪便。在日喀则段和拉萨段,水体NO3-主要来自土壤有机氮和降雨及肥料中NH4+,二者贡献率超过70%;在山南段和林芝段,降雨及肥料中NH4+对水体NO3-的贡献率最大,达到43%~70%。水体硝化和反硝化作用是影响氮素赋存形态和氮氧同位素组成的主要因素。
肥料;同位素;氮;雅鲁藏布江;分布;来源
0 引 言
水体氮污染是目前全球重点关注的环境问题,特别是作为饮用水源的河流的氮素污染已成为中国突出的环境问题之一[1-2]。很多河流的氮素浓度已经远远超过了河流本身的自净能力,对水质造成了极大的破坏[3]。中国现有关于水环境含氮化合物的研究多集中长江流域、黄河流域及富营养湖泊,对于高原河流含氮化合物的分布特征及来源解析尚未见报道。
作为世界上海拔最高的大河之一,雅鲁藏布江(简称雅江)在中国境内长度2 057 km,流域面积24.6万km2,集中了整个西藏地区56.6%的水力资源[4]。与长江、黄河等流域相比,雅江流域人口密度、工业化和城镇化水平较低,氮素污染水平不高[5]。但是高原河流具有独特的水文水质、地质地貌和生态特点,青藏高原地区不仅是气候变化敏感区,更是典型的生态脆弱区。尤其是雅江流域各大水电站相继投产使用,可能会改变河流的水文地貌形态和天然的径流模式,从而引发一系列生态环境问题[6]。雅江是西藏人民主要的水源地,如果水体中有过量的含氮化合物输入,会严重威胁到饮用水安全[7]。因此,有必要对雅江含氮化合物的组成、分布和时空变化进行深入研究,对主要含氮化合物的来源进行解析。
近年来,由于同位素测试技术的快速发展和检测成本的降低,氮氧同位素(15N-NO3-和18O-NO3-)被广泛应用于解析水体氮素来源及生物地球化学过程[8-11]。同时,结合稳定同位素模型(Stable Isotope Analysis in R, SIAR),可实现对NO3--N来源的定量分析[12-14]。
为阐明雅江中下游水体含氮化合物的赋存演变规律及主要来源,通过对雅江氮素的主要赋存形式和氮氧同位素分析,确定含氮化合物的沿程分布特征,明析水体NO3-的主要来源,定量解析不同来源的硝酸盐贡献率,以期为高原河流氮素污染控制和西藏地区饮用水安全保障提供科学依据。
1 材料和方法
1.1 研究区域及样品采集
综合考虑沿岸城市分布、河流交汇及梯级水电开发等因素,在雅江中下游干流及主要支流年楚河、拉萨河、尼洋河设置11处采样点(见图1),采样点S7和S8分别位于梯级水电站的上下游,其他点均位于雅江重要支流与干流交汇的上下游。采样点位信息见表1。
根据历史水文资料,雅江中下游1-4月为枯水期,6-9月为丰水期。在2018年3月(枯水期)和8月(丰水期),采用有机玻璃采水器在水面下50 cm处采集水样,置于500 mL聚乙烯瓶中,现场加入氯化汞固定。每个采样点平行采集3个样品。现场采用HACH-HQ40d便携式多参数水质分析仪(美国哈希公司)测定溶解氧(Dissolved Oxygen,DO)含量(mg/L)。
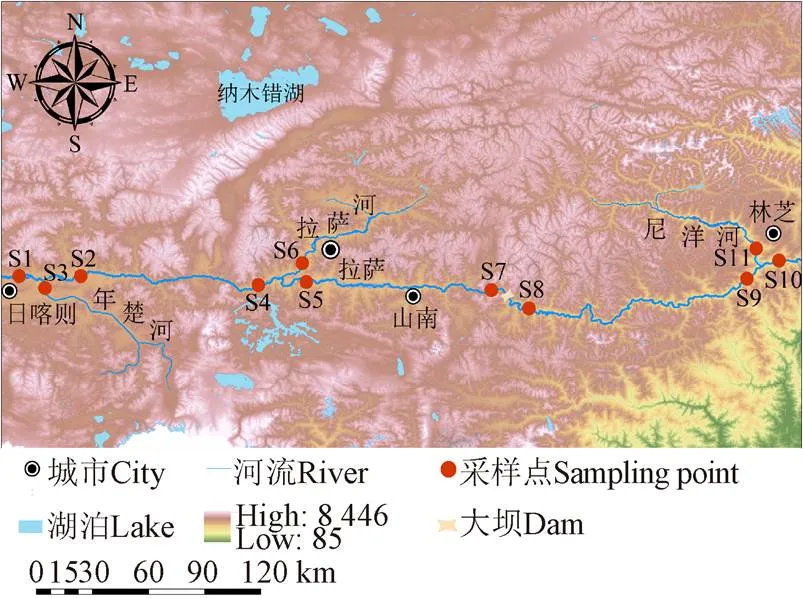
图1 雅江中下游采样点位置

表1 雅江中下游采样点信息
1.2 含氮化合物及同位素测定
取500 mL水样经过0.45m醋酸纤维滤膜过滤后用于含氮化合物含量测定。采用碱性过硫酸钾消解紫外分光光度法(UV-5500PC,上海元析)测定溶解性总氮(Total Dissolved Nitrogen,TDN),采用紫外分光光度法测定NO3-、NO2-和NH4+含量。溶解性有机氮(Dissolved Organic Nitrogen,DON)为TDN与无机氮(NO3-+NO2-+NH4+)的差值。
取50 mL水样采用细菌反硝化法测定NO3-氮氧同位素[15-16],利用特定的反硝化细菌,使得NO3-转化为N2O,纯化后使用Thermo-Mat253同位素质谱仪(美国赛默飞世尔科技公司)测定15N-NO3-和18O-NO3-值,15N-NO3-和18O-NO3-值的测定误差为± 0.5‰。稳定同位素组成()定义为待测样品稳定同位素的比值(sample)相对于标准样品同位素比值(standard)的千分之偏差,如式(1)所示[11]。

式(1)中稳定同位素的比值可以是某一元素的重同位素原子丰度与轻同位素原子丰度之比(15N/14N和18O/16O)。15N值参照大气中氮气(N2),18O参照维也纳标准平均海水。同时测定了雅江水样中的18O-H2O。
1.3 SIAR模型
SIAR模型是基于R统计软件的稳定同位素混合模型,它利用贝叶斯方法计算氮污染源的贡献率[17]。SIAR模型如式(2)所示:


式中X表示第个混合样品中同位素的值(=1, 2, 3, …,;=1, 2, 3, …,);P表示第个污染源的贡献率,由模型计算得出(=1, 2, 3, …,);S表示第个污染源中同位素的值,μ为其平均值,2为其正态分布的方差;C表示同位素在第个污染源中的分馏系数,λ为平均值,2为其正态分布的方差;ε表示第个混合样品中同位素值的残差,0为其平均值,2为其正态分布的方差。
在雅江水体中,将肥料、土壤有机氮、污水及粪便、降雨作为SIAR模型中定量计算的4种NO3-的污染来源。11个观测点肥料中15N范围为-1.10‰~1.08‰,18O的范围为-3.56‰~-2.38‰;土壤中15N为2.76‰~6.22‰,δ18O为-5.34‰~-0.12‰;污水及粪便中的15N值较高,为7.83‰~15.29‰,18O为3.31‰~6.49‰;降雨中15N为-8.68‰~3.18‰,18O为12.2‰~19.1‰。利用SIAR模型计算不同来源NO3-的贡献率时,由于雅江水体中DO含量较高,微生物反硝化作用较弱,假设式(2)中的分馏系数为0。
2 结果与分析
2.1 含氮化合物的赋存及时空变化
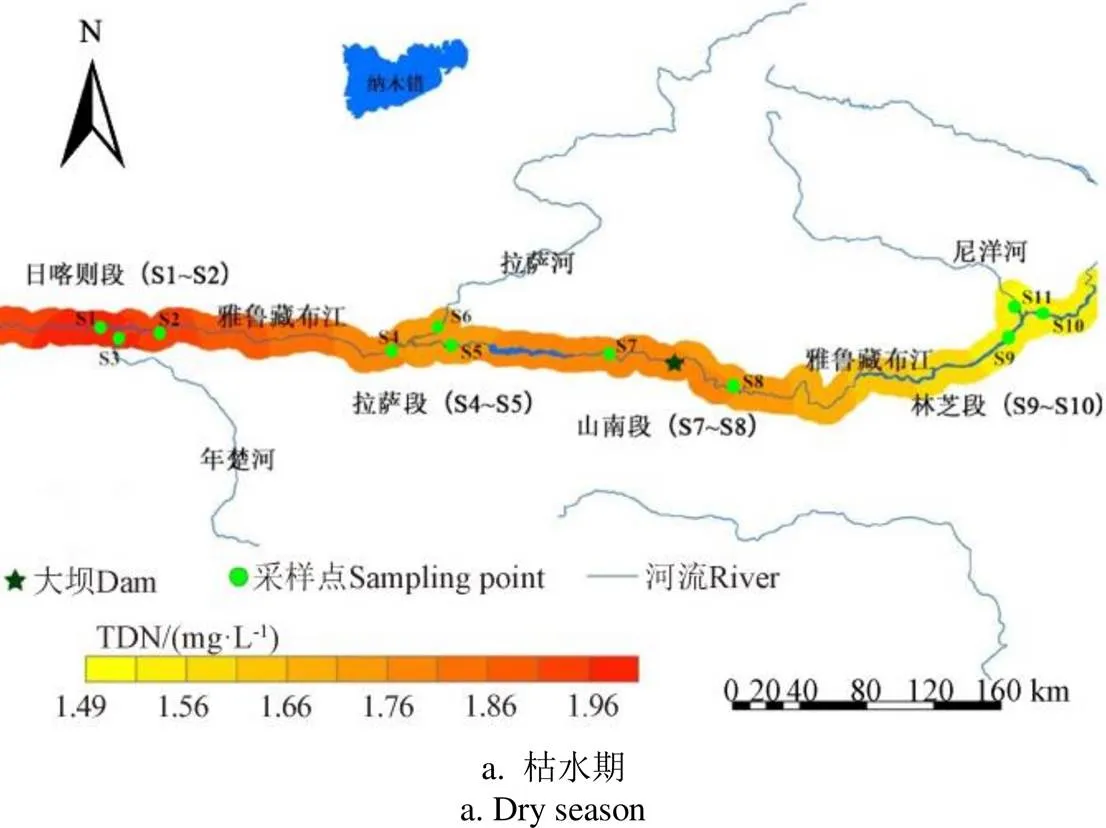
雅江表层水中TDN浓度的时空变化如图2所示,其中日喀则段包括S1~S3,拉萨段包括S4~S6,山南段包括S7和S8,林芝段包括S9~S11。由于受到季节、地理环境、支流汇入和污染源输入等因素影响,TDN分布具有明显的季节和空间差异性。枯水期TDN的范围为1.3~2.5 mg/L,不同河段TDN的浓度有明显差异,具体表现为日喀则段>拉萨段>林芝段。丰水期TDN的浓度低于枯水期,变化范围为1.1~2.0 mg/L,也呈现出一定的沿程下降趋势。需要指出的是,年楚河S3点位于日喀则城区,枯水期点TDN的浓度达到2.5 mg/L,已经超过国家地表水Ⅴ类标准(2 mg/L)[18]。
雅江水体中不同形态氮的组成及时空变化见图3。DON是水体中氮素的主要赋存形式,其浓度呈现明显的时空变化。枯水期水体DON平均浓度高于丰水期,而丰水期DON的空间变化较枯水期更为明显,在日喀则段(S1~S3)水中DON浓度最高,林芝段(S10)最低。
NO3--N是水中无机氮的主要赋存形式(图3),在TDN中11个站点丰水期和枯水期平均占比达到25.6%。在时间变化上与DON类似,枯水期浓度较高。在空间分布上,枯水期NO3-最大值出现在流经日喀则市年楚河(S3),而在丰水期除了S3外,在林芝市下游的S10点浓度也很高。雅江水体中NH4+-N的浓度总体上低于NO3--N,在TDN中平均占比为17.5%。NO2--N在多数点位未检出。
2.2 NO3-的来源解析
丰水期雅江水体不同点位NO3-的氮、氧同位素值见图4。15N-NO3-值的变化范围为-9.17‰~22.68‰,平均值为4.16‰,空间变化较大,日喀则段S1和S3、拉萨河(S6)以及水电站下游(S8)的15N-NO3-值明显高于其他点,而在下游林芝段(S9~S11)显著降低。18O-NO3-值的变化范围在-13.25‰~8.24‰之间,平均值为-3.61‰。总体来看,在支流汇入后18O-NO3-值降低,最大值出现在S1点,最小值在S9点,沿程呈现波动向下的趋势。
根据文献[19-20]中不同来源15N-NO3-和18O-NO3-的值域,动物粪便产生的15N值在8‰~22‰之间,污水的15N值高于10‰;土壤有机氮的15N值在0~10‰之间;降水及肥料中的15N较低,一般为-9‰~5‰;由含氮化合物(含氮肥料、土壤有机氮、污水和粪便)硝化生成NO3-的18O值在-10‰~15‰之间[19-20]。结合本研究得到的氮氧同位素实测结果,解析了雅江水体NO3-的主要来源,结果表明雅江中下游水体中的硝酸盐主要来自降雨及肥料、土壤有机氮以及污水和粪便。而来自大气沉降的18O-NO3-的值域(28‰~75‰)远高于本研究结果,表明雅江中下游水体中的硝酸盐并非来自大气沉降。
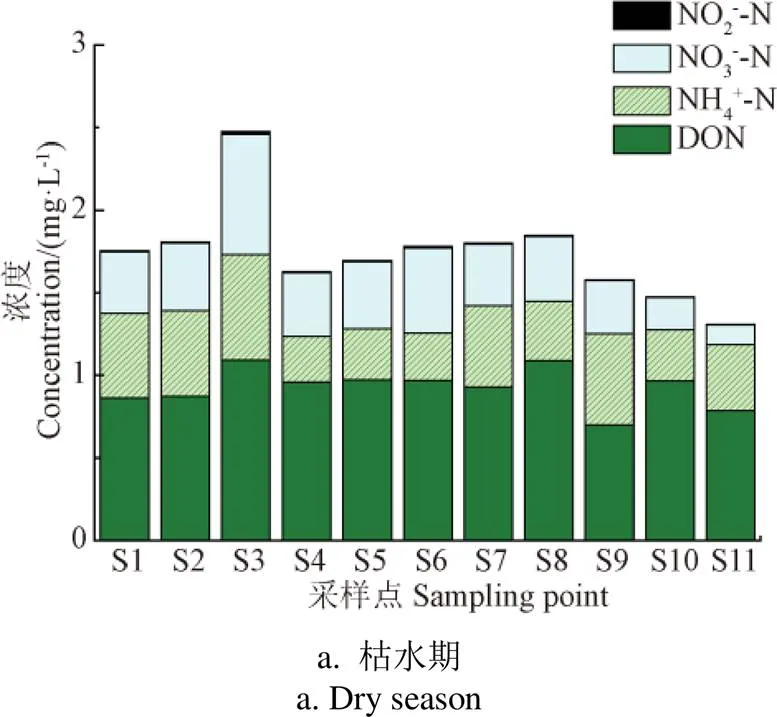

图4 丰水期雅江水体NO3-的氮、氧同位素关系及来源
土地利用方式对水体NO3-来源影响显著[20]。在雅江中下游地区,耕地是最主要的土地利用方式,其次为林地、园地和农村居住区。雅江流域土地以砂石为主,水土流失严重,同时,在河岸地区开垦了部分耕地。地表径流携带大量土壤氮和在耕地中使用的化肥流入雅江,使得大量氮素随降雨形成的地表径流进入雅江,是雅江水体NO3--N的重要来源。在雅江流域污水处理率和达标排放率不高,畜牧业是传统产业,加上旅游业快速发展,生活污水、养殖废水及牲畜粪便构成了流域NO3--N的另外一个重要来源。
2.3 不同NO3-来源的贡献率
利用SIAR模型计算得到丰水期雅江水体中NO3-不同来源的贡献率,结果如图5所示。在日喀则段和拉萨段,水体NO3-主要来自土壤有机氮和降雨及肥料中NH4+,二者贡献率超过70%;其中S1点土壤有机氮的贡献率最大,占44%~47%;而在S4和S5点,降雨和肥料中NH4+的贡献率为49%~55%。在梯级电站上下游(S7和S8)水体中NO3-主要来源是降雨及肥料中NH4+,以及污水和粪便,二者所占比例相当,总计贡献了NO3-来源的80%以上。林芝段(S9、S10和S11)水体中NO3-以降雨及肥料中NH4+的贡献为主,占比达到60%~70%,土壤有机氮的贡献率次之,贡献率为22%~28%。

图5 丰水期雅江水体硝酸盐不同来源的相对贡献率
以上结果表明,在雅江中下游水体中,降雨及肥料中NH4+是水体NO3-最主要的来源。雅江沿岸及其支流周围分布大量农田,农田中施用的氮肥通过降雨随地表径流进入河流中,是雅江水体中氮素的重要来源。土壤有机氮是雅江水体NO3-的另一个重要来源,尤其是在宽谷河段,这主要是由于河流沿岸缓坡地的开垦和耕地土壤的侵蚀作用。S7和S8处于峡谷河段,土地开发利用程度低,土壤有机氮贡献率低,而污水和粪便对NO3-的贡献率占比高,这可能与该区域梯级水电站的建设以及畜禽养殖有关。Xia等[21]通过SIAR模型计算了南京秦淮河中NO3-的主要来源,结果表明,肥料在传统农业地区贡献了大量的NO3-,而粪便污水是非农业地区(尤其是在雨季期间)的主要NO3-来源。
2.4 水体中NO3--N的转化
不同形态氮的转化和不同来源氮的混合作用是影响水体含氮化合物浓度和同位素组成变化的主要因素,其中硝化作用是水体氮转化的一个重要途径。硝化作用产生的NO3-的18O-NO3-值范围通常在±10‰之间[13],本研究区域除了S9以外,水样的18O-NO3-值都在此范围内,说明雅江水体存在强烈的硝化作用。在NO3-形成期间,NO3-中的1个氧原子来自DO(18O-O2=23.5‰),2个氧原子来自水,其18O的理论值可由18O-NO3-=2/3(18O-H2O)+1/3(18O-O2)计算[13]。在雅江水体中,18O-H2O的实测值在-29.5‰~-14.9‰之间变化,平均值为-22.5‰,根据上述等式计算理论18O-NO3-值。DO含量、理论及实测的18O-NO3-的变化见图6。对比发现,大部分观测点实测的18O-NO3-值要高于理论值,这可能受到了来自降水的高18O-NO3-值的NO3-的影响。在表层水中,浮游植物生物量较高,其同化作用能够引起较大的同位素分馏,使得剩余NO3-中的15N和18O增加,这也是表层水体实测8O-NO3-值较高的原因[16]。
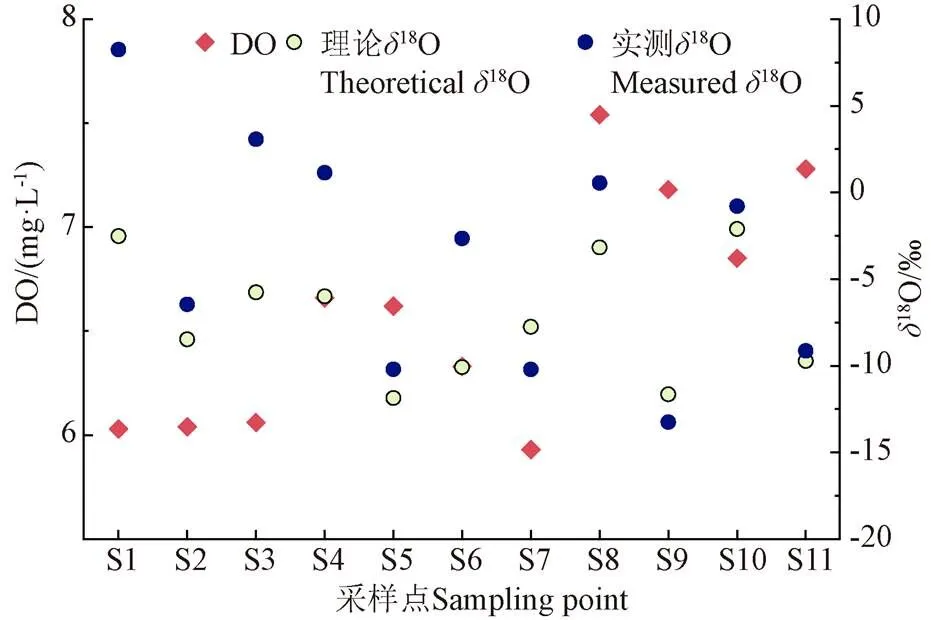
图6 溶解氧(DO)含量及实测和理论δ18O-NO3-值的变化
反硝化作用是自然水体去除氮的主要过程,在反硝化过程中,NO3-在反硝化细菌的作用下最终还原为N2O和N2而从水中逸出,NO3-被消耗,使得剩余NO3-中的15N-NO3-和18O-NO3-比例增加[22-25]。从图4可见,S1、S3、S6和S8水样中15N-NO3-值在20‰左右,显著高于其他点,这可能是由于反硝化作用的原因。当然流域水体中还可能存在其他氮转化过程共同影响其氮氧同位素比值的情况[26]。
3 结 论
1)雅鲁藏布江中下游水体中的溶解性总氮(Total Dissolved Nitrogen,TDN)主要以溶解性有机氮(Dissolved Organic Nitrogen,DON)和NO3-的形式存在,枯水期TDN的浓度高于丰水期,沿程呈现下降趋势。
2)雅鲁藏布江中下游水体中15N-NO3-值为-9.17‰~22.68‰,18O-NO3-的值在-13.25‰~8.24‰之间,表明硝化作用是最主要的氮转化过程。
3)定量识别了雅鲁藏布江中下游水体中NO3-的主要来源,在日喀则和拉萨段,水体NO3-主要来自土壤有机氮和降雨及肥料中NH4+,山南段主要来自降雨及肥料中NH4+及污水和粪便,而林芝段主要来自降雨及肥料中NH4+。
在结合同位素技术分析河流中含氮化合物来源时,只考虑了氮氧同位素的示踪作用,在含氮化合物迁移转化过程中,这些同位素值也会发生改变,因此在后续研究中还应与其他元素同位素(碳、氢、硼、锶等同位素)联合使用,进一步研究不同潜在污染源的同位素特征值,弥补双同位素法的不足,提高河流氮素污染源识别的准确性。
[1] Yao X L, Zhang Y L, Zhang L, et al. A bibliometric review of nitrogen research in eutrophic lakes and reservoirs[J]. Journal of Environmental Sciences, 2017, 66(4): 274-285.
[2] Vitousek P M, Aber J D, Howarth R W, et al. Human alteration of the global nitrogen cycle: Causes and consequences[J]. Ecological Applications, 1997, 7(3): 737-750.
[3] Rashid I, Romshoo S A. Impact of anthropogenic activities on water quality of Lidder River in Kashmir Himalayas[J]. Environmental Monitoring & Assessment, 2013, 185(6): 4705-4719.
[4] 劳承玉. 西藏水电开发的区域经济影响研究[J]. 财经智库,2016,1(4):86-97. Lao Chengyu. A study on regional economic impact of hydropower development in Tibet[J]. Financial Minds, 2016, 1(4): 86-97. (in Chinese with English abstract)
[5] Liu J, Lu G, Yang H, et al. Ecological impact assessment of 110 micropollutants in the Yarlung Tsangpo River on the Tibetan Plateau[J]. Journal of Environmental Management, 2020, 262: 110291.
[6] 王超. 西南水电高坝大库梯级开发的生态保护与恢复研究构想[J]. 四川大学学报:工程科学版,2017,49(1):19-26. Wang Chao. Research conception of ecological protection and restoration of high dams and large reservoirs construction and hydropower cascade development in southwestern China[J]. Journal of Sichuan University: Engineering Science Edition, 2017, 49(1): 19-26. (in Chinese with English abstract)
[7] 薛晨旺,陆光华,余文杰. 雅鲁藏布江沉积物对氨氮的输移行为研究[J]. 环境科学与技术,2019,42(9):203-210. Xue Chenwang, Lu Guanghua, Yu Wenjie. The transport of ammonia nitrogen by sediments in middle and lower reaches of the Yarlung Zangbo River[J]. Environmental Science & Technology, 2019, 42(9): 203-210. (in Chinese with English abstract)
[8] Galloway J N, Townsend A R, Erisman J W, et al. Transformation of the nitrogen cycle: Recent trends, questions, and potential solutions[J]. Science, 2008, 320(5878): 889-892.
[9] Gu B, Ju X, Chang J, et al. Integrated reactive nitrogen budgets and future trends in China[J]. Proceedings of the National Academy of Sciences of the United States of America, 2015, 112(28): 8792-8797.
[10] 杨丽萍. 浙江省两个典型流域水体污染特征及污染源解析研究[D]. 杭州:浙江大学,2015. Yang Liping. Water Pollution Characteristics and Source Apportionment in Two Representative Watersheds in Zhejiang Province[D]. Hangzhou: Zhejiang University, 2015. (in Chinese with English abstract)
[11] Xu S, Kang P, Sun Y. A stable isotope approach and its application for identifying nitrate source and transformation process in water[J]. Environmental Science and Pollution Research, 2015, 23(2): 1133-1148.
[12] Li D, Jiang X, Zheng B. Using δ15N and δ18O Signatures to evaluate nitrate sources and transformations in four inflowing rivers, North of TaihuLake[J]. Water, 2017, 9(5): 345-360.
[13] Yue F J, Li S L, Liu C Q, et al. Tracing nitrate sources with dual isotopes and long term monitoring of nitrogen species in the Yellow River, China[J]. Scientific Reports, 2017, 7(1): 506-515.
[14] Meghhadi A, Javar N. Quantification of spatial and seasonal variations in the proportional contribution of nitrate sources using a multi-isotope approach and Bayesian isotope mixing model[J]. Environmental Pollution, 2018, 235: 207-222.
[15] Zhang Y, Shi P, Li F, et al. Quantification of nitrate sources and fate in rivers in an irrigated agricultural area using environmental isotopes and a Bayesian isotope mixing model[J]. Chemosphere, 2018, 208: 493-501.
[16] Jin Z, Zheng Q, Zhu C, et al. Contribution of nitrate sources in surface water in multiple land use areas by combining isotopes and a Bayesian isotope mixing model[J]. Applied Geochemistry, 2018, 93: 10-19.
[17] Parnell A C, Inger R, Bearhop S, et al. Source partitioning using stable isotopes: Coping with too much variation[J]. Plos One, 2010, 5(3): 9672-9680.
[18] 国家环保总局. 地表水环境质量标准,GB3838—2002[S]. 北京:中国环境出版集团,2002.
[19] Xue D, Botte J, Baets B D, et al. Present limitations and future prospects of stable isotope methods for nitrate source identification in surface and groundwater[J]. Water Research, 2009, 43(5): 1159-1170.
[20] Michener R, Lajtha K. Stable Isotopes in Ecology and Environmental Science[M]. Oxford, UK: Blackwell, 2008: 375-449.
[21] Xia Y, Li Y, Zhang X, et al. Nitrate source apportionment using a combined dual isotope, chemical and bacterial property, and Bayesian model approach in river systems[J]. Journal of Geophysical Research: Biogeoences, 2017, 122: 2-14.
[22] Swart P K, Evans S, Capo T, et al. The fractionation of nitrogen and oxygen isotopes in macroalgae during the assimilation of nitrate[J]. Biogeosciences, 2014, 11(21): 6147-6157.
[23] Buchwald C, Casciotti K L. Oxygen isotopic fractionation and exchange during bacterial nitrite oxidation[J]. Limnology and Oceanography, 2010, 55(3): 1064-1074.
[24] Wenk C B, Zopfi J, Blees J, et al. Community and anammox in a stratified lacustrine water column[J]. Geochimica et Cosmochimica Acta, 2014, 125: 551-563.
[25] 金赞芳,岑佳蓉,胡宇铭,等. 千岛湖水体氮的垂向分布特征及来源解析[J]. 中国环境科学,2019,39(8): 3441-3449. Jin Zanfang, Qin Jiarong, Hu Yuming, et al. The vertical distribution of nitrogen and nitrogen sources in QiandaoLake[J]. China Environmental Science, 2019, 39(8): 3441-3449. (in Chinese with English abstract)
[26] 金赞芳,张文辽,郑齐,等. 氮氧同位素联合稳定同位素模型解析水源地氮源[J]. 环境科学,2018,39(5):2039-2047. Jin Zanfang, Zhang Wenliao, Zheng Qi, et al. Contribution of nitrogen sources in water sources by combining nitrogen and oxygen isotopes and SIAR[J]. Environmental Science, 2018, 39(5): 2039-2047. (in Chinese with English abstract)
Distribution characteristics and source analysis of nitrogenous compounds in the Middle and Lower Reaches of the Yarlung Zangbo River of China
Sun Wenqing, Lu Guanghua※, Xue Chenwang
(,,,,,860000,)
As one of the rivers with the highest elevation in the world, the Yarlung Zangbo River concentrates more than half of the water resources in Tibet. With the development of cascade hydropower stations in the Yarlung Zangbo River, human activities have changed the ecological environment and affected the nitrogen cycle in the river. In order to clarify the distribution characteristics of nitrogenous compounds and quantitatively analyze their sources, eleven sampling points were set up in the middle and lower reaches of the Yarlung Zangbo River and its main tributaries (Nianchu River, Lhasa River and Niyang River), and water samples were collected in March (the dry season) and August (the wet season) of 2018. The concentrations of dissolved oxygen (DO), total dissolved nitrogen (TDN), NO3-, NO2-and NH4+were measured. Dissolved organic nitrogen (DON) was calculated as the difference between TDN and inorganic N. The occurrences and spatial-temporal distribution of nitrogenous compounds in the water samples of the rivers were analyzed, and the main sources of NO3-in the wet season were determined by the dual isotope analyses. The results showed that the DON was the main form of TDN. The concentrations of TDN ranged from 1.3 to 2.5 mg/L in the dry season and from 1.1 to 2.0 mg/L in the wet season, and showed a downward trend along the river. The NO3--N was the main form of inorganic nitrogen in the water, with an average proportion of 25.6% in TDN, and NH4+-N accounted for 17.5% in TDN, while NO2--N was not detected at the most sampling sites. The results of nitrogen and oxygen isotope analyses showed that the values of15N-NO3-ranged from -9.17‰ to 22.68‰, and18O-NO3-from -13.25‰ to 8.24‰ in the wet season. The NO3-mainly came from rainfall and fertilizer, organic nitrogen in soil, and sewage and feces. Based on the Stable Isotope Analysis in R (SIAR) model, the contribution rates of nitrate from different sources were quantitatively calculated. In the Shigatse and Lhasa sections, NO3-in the water body mainly came from the organic nitrogen in soil and the NH4+in rainfall and fertilizer, with more than 70% of contribution rate. The main sources of NO3-in the water in the upstream and downstream of the cascade power stations were NH4+in rainfall and fertilizer, as well as sewage and feces, which accounted for a similar proportion, totally contributing more than 80% of the sources of NO3-. In the Nyingchi section, the NH4+in rainfall and fertilizer contributed the most to NO3-, accounting for 60%-70%, followed by the organic nitrogen in soil with 22%-28% of contribution rate. A large amount of farmland was distributed along the Yarlung Zangbo River and its tributaries. The nitrogen fertilizer applied in the farmland flowed into the river along with the surface runoff through rainfall, which was an important source of nitrogen in the water body of the Yarlung Zangbo River. Due to the reclamation of gentle slopes along the river and the erosion of cultivated soil, the organic nitrogen in soil was another important source of NO3-in the water of the Yarlung Zangbo River, especially in the wide valley section. Higher contribution rate of sewage and feces to NO3-in the canyon reach may be related to the development and construction of the cascade hydropower stations in the region. According to the change of DO contents and theoretical and measured values of18O-NO3-, nitrification and denitrification in the Yarlung Zangbo River are the main factors affecting the forms of nitrogen and the composition of nitrogen and oxygen isotopes. The results in the present study can provide data for the pollution control of nitrogenous compounds in the rivers in plateaus and drinking water security in Tibet.
fertilizers; isotopes; nitrogen; Yarlung Zangbo River; distribution; sources
孙文青,陆光华,薛晨旺. 雅鲁藏布江中下游含氮化合物的分布特征及来源解析[J]. 农业工程学报,2020,36(14):63-68. doi:10.11975/j.issn.1002-6819.2020.14.008 http://www.tcsae.org
Sun Wenqing, Lu Guanghua, Xue Chenwang. Distribution characteristics and source analysis of nitrogenous compounds in the Middle and Lower Reaches of the Yarlung Zangbo River of China[J]. Transactions of the Chinese Society of Agricultural Engineering (Transactions of the CSAE), 2020, 36(14): 63-68. (in Chinese with English abstract) doi:10.11975/j.issn.1002-6819.2020.14.008 http://www.tcsae.org
2019-10-07
2020-05-10
国家自然科学基金(51769034、51879228);西藏自治区高等学校科研创新团队。
孙文青,助教,主要从事河流氮素迁移转化研究。Email:othmk@sina.cn
陆光华,博士,教授,主要从事水环境保护与水生态安全领域研究。Email:ghlu@hhu.edu.cn
10.11975/j.issn.1002-6819.2020.14.008
X52;TQ217
A
1002-6819(2020)-14-0063-06

