基于农田管理分区的制种玉米产量估算与限制因子评价
陈世超,杜太生,王素芬,韩万海,董平国,佟 玲,胡铁民
基于农田管理分区的制种玉米产量估算与限制因子评价
陈世超1,2,杜太生1,2※,王素芬1,2,韩万海2,董平国2,佟 玲1,2,胡铁民2
(1. 中国农业大学中国农业水问题研究中心,北京 100083;2. 农业农村部作物高效用水武威科学观测实验站,武威 733000)
为了提升规模化农田不同管理分区的玉米产量,实现精准管理,该研究使用相关成分回归法(Correlated Component Regression,CCR),考虑地形因素(高程)、土壤理化性质(砂粒、粉粒、黏粒、容重、土壤含水率、土壤有机碳、全氮、全磷、速效氮、电导率)11个因子,评估规模化农田和聚类分析得到的3个管理区(M1、M2和M3)内产量的限制因子,并在不同分区内建立产量估算模型。模型验证结果表明:未分区的情况下,产量限制因子为土壤粉粒、砂粒、土壤有机碳、土壤含水率、速效氮和全氮,经验证,产量估算模型的决定系数(2)为0.70,标准均方根误差(Normalized Root Mean Square Error,nRMSE)为0.21。分区后,M1的产量限制因子为土壤粉粒、砂粒、黏粒、速效氮、电导率、全氮和全磷,M2的产量限制因子为土壤粉粒、砂粒和土壤含水率,M3的产量限制因子为高程、土壤砂粒、黏粒和电导率,产量估算模型的精度高(经验证,0.71<2<0.83,0.16 农田;分区;玉米;限制因子;产量估算模型;精准农业;相关成分回归 依据土壤理化性质确定农田管理分区,进而“因地制宜”地制定提升产量与水肥利用效率的管理策略是近年来的研究热点[1]。划分管理区可以将土壤因子相似的区域作为管理单元,依据各管理单元不同的土壤条件制定科学的管理方案,以实现农业生产要素的精准管理,提升水肥利用效率、减少资源浪费和对环境的不利影响[2]。 土壤各因子的空间变异是导致农田产量存在差异的主要原因[3]。国内外诸多学者研究表明,聚类分析法是对农田进行管理区划分的一种有效方法。Miao等[4]结合土壤属性(高程、土壤养分、阳离子交换量等)和作物产量的综合信息,对2块农田进行聚类分析,分别得到5个和4个管理分区,并制定了变量施氮策略,提升经济收益约37%;Chen等[5]基于土壤质地、农田高程及初始土壤属性对玉米种植区进行管理区划分,分区后各因子的变异系数减小,为进一步分区优化灌溉制度奠定了基础;Li等[6]基于土壤电导率、有机质、全氮、速效氮和速效磷等因子的空间变异性,应用模糊聚类法为盐碱农田进行了棉花种植管理分区;Albornoz 等[7]利用MZA v1.01软件(Management Zone Analyst, 美国)实现了模糊c均质聚类划分管理区,比较了不同分区数下的模糊性能指数和归一化分类熵的变化,并寻找两者与欧氏距离之间的关系。模糊聚类的分区方法同样适用于流域尺度的土壤管理区划分,减小分区内土壤因子的异质性[8-9]。 科学的农田管理区的划分方法已经较为成熟,但是未涉及分区后的管理策略,管理区之间作物产量存在差异的根本原因也尚未确定。在农业系统中,影响产量的土壤因子种类繁多,且部分因子之间存在共线性[10-11]。依据土壤因子对产量进行精确估算,需要消除因子间的共线性,避免各因子表达重复信息,从而提高估算精度。相关成分回归法(Correlated Component Regression,CCR)是一种针对多变量且变量之间存在多重共线性的回归方法[11]。相比于传统的稀疏正则化方法(如偏最小二乘法),CCR的估算结果具有精度高、成分少的特点,可以提高运算速度。基于此,为探究农田内不同管理区的产量限制因子,探讨基于不同管理区建立产量估算模型的可行性,本文依据课题组前期关于管理区划分的结果[12],应用CCR确定各管理区的产量限制因子以及各因子的标准权重,建立基于产量限制因子的CCR产量估算模型;同时,依据管理区内不同的产量限制因子,定性地提出不同分区的产量提升途径,以期为各管理区提供科学的管理策略,提升作物产量和水肥利用效率,为精准农业提供方法支撑。 试验地点位于甘肃省武威市凉州区(102°55′E,37°49′N),该区属典型的大陆性温带干旱荒漠气候。全年日照时数3 000 h以上,无霜期约150 d,年均气温8.8 ℃。该地区水资源匮乏,多年平均降水量为164 mm,但同时多年平均水面蒸发量为2 000 mm以上。研究区为制种玉米种植区,位于黄羊河农场七队2号地,面积为6.84 hm2(120 m×570 m)。依据测得的土壤砂粒、粉粒和黏粒的体积分数,采用美国制标准,研究区内土壤质地包括粉壤土、砂壤土和壤土。 2016年4月20日种植播种,种植密度为9.75万株/hm2,于9月5日成熟并收获。生育期内降雨量为111 mm。 在研究区中划分30 m×30 m的均匀网格,布设91个取样观测点用于测定土壤特性、作物产量和高程[12]。2016年4月8日对农田内土壤进行样品采集,在每个取样点获取深度为0~20、>20~40、>40~60 cm的土壤样品,用来测定土壤粉粒、砂粒、黏粒、容重(Bulk Density,BD)、土壤含水率(Soil Water Content,SWC)、速效氮(Available Nitrogen,AN)、电导率(Electrical Conductivity,EC)、有机碳(Soil Organic Carbon, SOC)、全氮(Total Nitrogen,TN)和全磷(Total Phosphorus,TP),测量结果取各层平均值进行分析。土壤样品分为3份:鲜土用来测定土壤含水率;样品风干后过2 mm筛网;风干后过0.25 mm筛网。土壤含水率使用烘干法测定;容重使用环刀法测定[13];速效氮用氯化钾浸提(2mol/L KCl溶液)后用流动分析仪(Auto Analyzer-II,SEAL Analytical Gmbh,德国)测定[14];电导率采用质量比为1:5的土水比法用电导率仪(Seven Compact S230,Mettler Toledo,美国)测定[15];土壤砂粒、黏粒、粉粒体积含量使用激光颗粒分析仪(MaterSizer2000,Malvern Instruments Ltd.,英国)测定[16];土壤有机碳采用K2Cr2O7-H2SO4法测定[17];土壤全氮使用凯氏定氮法测定[18];土壤全磷使用钼锑抗比色法测定[19]。研究区内取样点的位置和高程使用全球定位系统GPS(Trimble Recon,美国)获得[12]。 作物成熟后(2016年9月5日)以各取样点为中心划定2 m×2 m的矩形范围,选择10株玉米,人工脱粒后在85 ℃条件下干燥至恒定质量并称量,换算成单位面积产量作为该取样点所代表的网格产量。 使用CCR法量化土壤因子对产量的影响并建立产量估算模型。其中,CCR的核心算法是将个相关成分进行线性组合代替原始的个因子对结果变量进行估算,其表达如下[11]: 式中α为截距,为标准化回归系数,X为自变量,成分S是自变量(X)的精确线性组合(S=11+22+…+βX)。该分析使用逐步下降的算法排除与结果变量相关性弱的成分,确定每个因子的标准权重和荷载,计算标准化系数,最终得到CCR回归模型。其中,第一成分(1)包含对结果变量起主导作用的影响因子,对结果变量产生直接影响;第二成分(2)以及随后的相关成分与1相关,其中的变量对结果变量的作用与1中的变量相反,可以消除在1中的不相关变量的噪声,进而提高模型估算精度。结果变量的估计值与实测值的决定系数(2)与标准差(S)是筛选相关成分数量的重要参数,可得到相关成分矩阵方差为2/(1+S),当值最大且小于1时对应的相关成分数量即为最适合。利用XLSTATv2014(Addinsoft, 美国)软件中CCR插件进行产量限制因子的确定与产量估算模型的建立。 农田管理区是基于模糊聚类法,依据土壤因子空间分布规律分析得到[20]。综合考虑高程、土壤粉粒、砂粒、含水率、速效氮、电导率等的空间异质性,应用主成分分析法得到3个主成分以及各取样点的主成分得分,基于主成分得分应用模糊c均值聚类法,以模糊性能指数和归一化分类熵作为最佳分区数的评判标准,最终得到3个管理分区分别为M1、M2和M3,其面积分别为2.3、1.8和2.7 hm2[12]。分区后,M1分区中土壤粉粒含量以及土壤养分指标在3 个分区中最高,砂粒含量和电导率最低,土壤环境适宜玉米生长,其产量也较高(7 244 kg/hm2);反之,在M3分区中,土壤含水率和土壤养分含量低,砂粒含量和电导率高,土壤环境对玉米生长有不利影响,其产量处于较低水平(5 502 kg/hm2);M2 分区内各因子均值处于M1和M3之间,其产量为5 826 kg/hm2,处于中等水平。 表1为管理区内土壤因子和产量的描述性统计分析结果。根据Warrick等[21]对变异级别的分类,未分区的情况下,除高程和土壤容重外的因子均呈中等变异性。分区后,3个管理区的产量和土壤容重、M1中的土壤粉粒、黏粒和M3中的土壤黏粒呈现弱变异性,其他因子均呈现中等变异性。分区后,除粉粒和高程外的土壤因子变异系数较分区前下降1.22%~63.43%,说明管理区的划分使各因子的分布趋于均质化。使用方差分析比较管理区之间土壤属性的差异性,可以发现管理区之间的土壤含水率、有机碳、全氮、全磷、速效氮以及玉米产量差异显著(<0.01),大小顺序为M1>M2>M3。 产量与管理区空间分布如图1所示,产量的空间分布与管理区相似,即在M1中产量较高,M2次之,M3最低;根据土壤因子和产量的描述性统计分析结果(表1),分区后,产量的变异系数较未分区时下降11.33%~35.88 %;管理区之间产量由大到小顺序为M1>M2>M3,并呈现出极显著性的差异(<0.01)。 以实测高程、土壤砂粒、粉粒、黏粒、容重、土壤有机碳、全氮、全磷、土壤含水率、速效氮、电导率为自变量、产量为结果变量,应用CCR法分析,以相关成分矩阵方差最大为筛选条件,最终得到4个相关成分(CC1~CC4)和标准权重(表2)以及各因子对相关成分的标准荷载(表3)。在各管理区中,相关成分1(CC1)的权重均大于0.70。与此同时,在M1中相关成分2和3(CC2和CC3)的权重大于0.70。权重高(>0.70)的相关成分中荷载绝对值大于0.2的因子可视为主要的产量限制因子[11]。由表3可以看出,分区前,土壤粉粒、砂粒、SOC、SWC、AN和TN为产量的主要限制因子,这与分区后的结果有所不同:分区后,在管理区M1中,土壤粉粒、砂粒、黏粒、AN、EC、TN和TP为产量的主要限制因子;M2中产量的主要限制因子为土壤粉粒、砂粒和SWC;而在M3中产量的主要限制因子为高程、土壤砂粒、黏粒和EC。分区后各管理区的产量限制因子各不相同,说明实施分区管理是产量提升的关键措施,应针对不同管理区土壤质地与初始土壤属性制定科学的管理策略。 表1 研究区不同管理分区内土壤属性均值和变异系数 图1 研究区内高程、管理区与实测玉米产量空间分布[12] 表2 相关成分回归(CCR)中的各成分标准权重与矩阵方差 表3 使用CCR计算的各管理区内不同因子对相关成分的标准荷载 基于各管理区内不同产量限制因子对相关成分的荷载和相关成分的标准权重分析结果(表2和表3),应用CCR法建立产量估算回归模型。用留一交叉检验法将总体数据集分为“建模集”和“验证集”[22],用于建立CCR产量估算模型(表4和表5)。图2a和图2b分别为基于“建模集”和“验证集”的实测产量与模拟产量的对比图。 表4 基于CCR的玉米产量估算模型 注:为产量,kg·hm-2;其他变量含义见表1。 Note:is yield, kg·hm-2; Contents of the other variables are shown in Table 1. 表5 基于相关成分回归(CCR)的产量估算模型建立与验证 图2 基于CCR回归模型估算产量与实测产量对比 建模时,在未分区的情况下,CCR模型对产量的决定系数(2)为0.75,小于分区后M1、M2和M3的产量估算精度(R分别为0.91、0.84和0.75),且分区后模型的标准均方根误差(Normalized Root Mean Square Error,nRMSE)较未分区时降低0.04~0.06;模型验证时,未分区农田的产量估算精度(2=0.70,nRMSE=0.21)依然低于各管理区(0.71<2<0.83,0.16< nRMSE<0.18)。说明对大面积农田进行管理分区可以提高产量的估算精度,进而根据各分区的实际土壤质地及养分状况提出差异化的管理措施。 分布式管理是实现大面积农田产量提升和资源高效可持续利用的基础,划分管理分区并针对不同区域分析产量限制因子,从而实现分布式管理、提出因地制宜的产量提升途径,是规模化农场实现“精准管理”的关键步骤。土壤属性的空间变异性是造成田间作物产量存在差异的主要因素[23-25]。Moharana 等[26]对农田进行管理区划分,以提升管理效率与经济收益。Peralta 等[27]用土壤表观电导率进行管理区划分,避免了土壤因子之间的共线性,但以单一因素解释产量的空间变异性会丢失很多信息。Rossi 等[28]应用归一化植被指数插值图确定植被管理区,其结果与模糊c均质聚类法得到的分区结果具有极大的相似性。众多研究结果表明,管理区划分可以很好地描述各区域的土壤因子变化规律和作物产量的分布。 划分管理区后,分析不同管理区产量限制因子并制定各分区的产量提升策略,是目前很多研究所忽略的。在CCR分析结果中,若主控因子的标准化系数为正,表示其变化会造成产量的同步变化,即当该主要限制因子增大时产量随之增长;反之当标准化系数为负,该主要限制因子增大则导致减产。因此依据CCR分析结果可以为各管理分区提出产量提升途径:未分区情况下,产量限制因子为土壤粉粒、砂粒、SOC、SWC、AN和TN,因此土壤改良与施基肥是产量提升的关键;分区后,M1分区的产量限制因子为土壤粉粒、砂粒、黏粒、AN、EC、TN和TP,其产量提升途径主要为增施有机肥和磷肥,调整土壤电导率以及改良土壤持水性能;M2分区的产量限制因子为土壤粉粒、砂粒和SWC,土壤持水性能是限制产量的主要因素,因此提升土壤保水、持水性能是增产的关键;M3分区的产量限制因子为高程、土壤砂粒、黏粒和EC,因此除了需要考虑平整土地、出苗水和有机肥的施用外,还需要实行有效的管理措施以降低土壤电导率,如在播前灌水以淋洗表层土壤盐分。土壤结构在较短种植周期中较难改变,因此合理应用土壤改良剂可以有效提高土壤有效水含量、改善土壤电导率,进而提升水肥利用效率[29-31]。本研究中,在不同管理区内提出的产量提升途径均为定性分析,对产量限制因子的最优调控阈值的确定尚需深入进行田间控制性试验与定量分析,最终得到详细的分布式管理技术参数。 土壤因子之间存在共线性,一定程度上会掩盖自身变异性对结果变量(产量)的影响程度。所以,应用CCR回归法可在考虑多重土壤因子对产量影响程度的前提下消除土壤因子间的多重共线性,既可消除估算误差也尽可能保留土壤信息。基于土壤因子的CCR回归模型对产量的估算精度较高,且分区后估算精度较不分区时有所提升,说明该模型适于规模化农场生产中的产量分区估算,在进一步研究中尚需探究多尺度下的环境、气象、种植模式、作物品种、种植密度等因素对产量的影响,并建立估算模型、评价其精度。 基于土壤属性的空间变异性,通过划分管理区可以实现土壤属性的相对均质化分布,以制定分布式管理措施,提升管理效率,实现产量提升。 综合考虑高程等的空间异质性,将研究区分为3个管理区(M1、M2、M3)。依据相关成分回归法(Correlated Component Regression,CCR)筛选玉米产量的限制因子:分区前,土壤粉粒、砂粒、有机碳、含水率、速效氮和全氮为产量限制因子;分区后,M1的限制因子为土壤粉粒、砂粒、黏粒、速效氮、电导率、全氮和全磷,M2为土壤粉粒、砂粒和含水率,而M3则为高程、土壤砂粒、黏粒和电导率。 基于土壤质地、初始土壤属性建立的CCR产量估算模型的估算精度高(验证集0.70<2<0.83),同时各管理区内的估算精度高于分区前。依据管理分区的产量限制因子可以定性地制定分布式的管理措施,提升产量、水肥利用效率和农田管理效率,达到规模化农田精准管理的目的。 [1] Schepers A R, Shanahan J F, Liebig M K, et al. Appropriateness of management zones for characterzing spatial variability of soil properties and irrigated corn yields across years[J]. Agronomy Journal, 2004, 96: 195-203. [2] 金继运. “精准农业”及其在我国的应用前景[J]. 植物营养与肥料学报,1998,4(1):1-7. Jin Jiyun. Precision agriculture and its perspective in China[J]. Journal of Plant Nutrition and Fertilizer. 1998, 4(1): 1-7. (in Chinese with English abstract) [3] Cruz-Cárdenas G, Silva J T, Ochoa-Estrada S, et al.Delineation of environmental units by multivariate techniques in the duero river watershed, Michoacán, Mexico[J]. Environmental Modeling & Assessment, 2016, 22(3): 1-10. [4] Miao Y, Mulla D J, Robert P C. An integrated approach to site-specific management zone delineation[J]. Frontiers of Agricultural Science and Engineering, 2018, 5(4): 1-10. [5] Chen S C, Wang S F, Shukla M K, et al. Delineation of management zones and optimization of irrigation scheduling to improve irrigation water productivity and revenue in a farmland of Northwest China[J]. Precision Agriculture, 2020, 21(3): 655-677. [6] Li Yan, Shi Zhou, Li Feng, et al. Delineation of site-specific management zones using fuzzy clustering analysis in a coastal saline land[J]. Computers & Electronics in Agriculture, 2007, 56(2): 174-186. [7] Albornoz E M, Kemerer A C, Galarza R, et al. Development and evaluation of an automatic software for management zone delineation[J]. Precision Agriculture, 2017(2/3): 1-14. [8] 王改粉,赵玉国,杨金玲,等. 流域尺度土壤厚度的模糊聚类与预测制图研究[J]. 土壤,2011,43(5):835-841. Wang Gaifen, Zhao Yuguo, Yang Jinling, et al. Prediction and mapping of soil depth at a watershed scale with fuzzy-c-means clustering method[J]. Soils, 2011, 43(5): 835-841. (in Chinese with English abstract) [9] 周浩,雷国平,杨雪昕,等. 基于AgentLA模型的农田精准灌溉管理分区研究[J]. 水土保持学报,2018,32(1):274-279. Zhou Hao, Lei Guoping, Yang Xuexin, et al. Study on precision irrigation management zones in farmland according Agent-based model for optimal land allocation[J]. Journal of Soil and Water Conservation, 2018, 32(1): 274-279. (in Chinese with English abstract) [10] Stefanidis K, Panagopoulos Y, Mimikou M. Impact assessment of agricultural driven stressors on benthic macroinvertebrates using simulated data[J]. Science of The Total Environment, 2016(540): 32-42. [11] Magidson J. New Perspectives in Partial Least Squares and Related Methods [M]. New York, USA: Springer, 2013. [12] 陈世超,杜太生,王素芬. 基于模糊c均值聚类法的玉米农田管理分区研究[J]. 农业机械学报,2019,50(11):293-300. Chen Shichao, Du Taisheng, Wang Sufen. Delineating management zones in maize field based on fuzzy c-means algorithm[J]. Transactions of the Chinese Society for Agricultural Machinery. 2019, 50(11): 293-300. (in Chinese with English abstract) [13] Blake G R. Methods of Soil Analysis. Part 1. Physical and Mineralogical Properties[M]. Madison, WI, USA: ASA and SSSA, 1965. [14] Baroni G, Ortuani B, Facchi A, et al. The role of vegetation and soil properties on the spatio-temporal variability of the surface soil moisture in a maize-cropped field[J]. Journal of Hydrology, 2013, 489(3): 148-159. [15] Slavich P G, Petterson G H, Slavich P G, et al. Estimating the electrical conductivity of saturated paste extracts from 1:5 soil, water suspensions and texture[J]. Australian Journal of Soil Research, 1993, 31(1): 73-81. [16] Ryżak M, Bieganowski A. Methodological aspects of determining soil particle-size distribution using the laser diffraction method[J]. Journal of Plant Nutrition and Soil Science, 2011, 174(4): 624-633. [17] Rosero-Vlasova O A, Vlassova L, Perez-Cabello F, et al. Soil organic matter and texture estimation from visible-near infrared-shortwave infrared spectra in areas of land cover changes using correlated component regression[J]. Land Degradation & Development, 2019, 30: 544-560 [18] 鲍士旦. 土壤农化分析[M]. 北京:中国农业出版社,2000. [19] Page A L. Methods of Soil Analysis. Part 2. Chemical and Microbiological Properties[M]. Madison, Wisconsin, USA: American Society of Agronomy & Soil Science Society of America, 1982. [20] Fridgen J J, Kitchen N R, Sudduth K A, et al. Management zone analyst (MZA): Software for subfield management zone delineation[J]. Agronormy Journal, 2004, 96(1): 100-108. [21] Warrick A W, Nielsen D R. Spatial variability of soil physical properties in the field[J]. Applications of Soil Physics, 1980, 13: 319-344. [22] Kusumo B H, Hedley M J, Hedley C B, et al. Predicting pasture root density from soil spectral reflectance: Field measurement[J]. European Journal of Soil Science, 2010(61): 1-13. [23] Arshad M, Li N, Zhao D, et al. Comparing management zone maps to address infertility and sodicity in sugarcane fields[J]. Soil and Tillage Research, 2019, 193: 122-132 [24] Cicore P L, Franco M C, Peralta N R, et al. Relationship between soil apparent electrical conductivity and forage yield in temperate pastures according to nitrogen availability and growing season[J/OL]. Crop and Pasture Science, 2019. [2020-04-10] https://doi.org/10.1071/CP19224. [25] Zhao J, Yang X G. Distribution of high-yield and high-yield-stability zones for maize yield potential in the main growing regions in China[J]. Agricultural and Forest Meteorology, 2018, 248: 511-517. [26] Moharana P C, Jena R K, Pradhan U K, et al. Geostatistical and fuzzy clustering approach for delineation of site-specific management zones and yield-limiting factors in irrigated hot arid environment of India[J]. Precision Agriculture, 2020, 21(2): 426-448. [27] Peralta N R, Costa J L, Balzarini M, et al. Delineation of management zones to improve nitrogen management of wheat[J]. Computers and Electronics in Agriculture, 2015, 110: 103-113. [28] Rossi R, Pollice A, Bitella G, et al. Modelling the non-linear relationship between soil resistivity and alfalfa NDVI: A basis for management zone delineation[J]. Journal of Applied Geophysics, 2018, 159: 146-156. [29] 黄占斌,孙朋成,钟建,等. 高分子保水剂在土壤水肥保持和污染治理中的应用进展[J]. 农业工程学报,2016,32(1):125-131. Huang Zhanbin, Sun Pengcheng, Zhong Jian, et al. Application of super absorbent polymer in water and fertilizer conversation of soil and pollution management[J]. Transactions of the Chinese Society of Agricultural Engineering (Transactions of the CSAE), 2016, 32(1): 125-131. (in Chinese with English abstract) [30] 吴军虎,任敏. 羟丙基甲基纤维素作土壤改良剂对土壤溶质运移的影响[J].农业工程学报,2019,35(5):141-147. Wu Junhu, Ren Min. Effect of hydroxypropyl methyl cellulose as soil modifier on solute migration in soil[J]. Transactions of the Chinese Society of Agricultural Engineering (Transactions of the CSAE), 2019, 35(5): 141-147. (in Chinese with English abstract) [31] 邵玉翠,任顺荣,杨军,等. 有机无机-土壤改良剂对咸灌土壤理化环境调控及玉米产量影响[J]. 中国农学通报,2012,28(18):111-116. Shao Yucui, Ren Shunrong, Yang Jun, et al. Effect of organic-inorganic soil amendments on physical and chemical conditions of saline water irrigation soil and maize yield [J]. Chinese Agricultural Science Bulletin, 2012, 28(18): 111-116. (in Chinese with English abstract) Evaluation of limiting factors and prediction of seed maize yield based on management zones Chen Shichao1,2, Du Taisheng1,2※, Wang Sufen1,2, Han Wanhai2, Dong Pingguo2, Tong Ling1,2, Hu Tiemin2 (1.100083; 2.733000) In order to improve the maize yield in different management zones and achieve precision agricultural management within a large-scale field, Correlated Component Regression (CCR) was used to screen limiting factors of maize yield from topographical attributes (elevation), soil physical factors (sand, silt, clay, bulk density), and initial soil properties (soil organic carbon, total nitrogen, total phosphorus, soil water content, available nitrogen, electrical conductivity). Yield estimation model was established based on yield-limiting factors in each management zone and the whole field. Management zones were delineated by using the Fuzzy c-means Clustering Algorithm (FCM) based on the spatial variation of soil properties. For soil properties, statistically significant differences in most cases were found among different management zones (M1, M2, M3), excepted elevation, silt, and clay. The decrease in the Coefficient of Variation (CV) of soil properties in the management zones indicated that the distribution of soil properties was more homogeneous than in the whole field. Spatial distribution of yield and management zones were similar, while the yield was significantly different in the three management zones (M1>M2>M3). The inhomogeneous spatial distribution of soil properties showed that the limiting factors of yield could be varied among management zones. Therefore, this study was to find out the yield-limiting factors, establish yield estimation models based on yield-limiting factors, and find ways to improve the yield in each management zone within a field. Four correlated components (CC1-CC4) were obtained in management zones and the whole field by CCR. The factors with largely standardized loadings (absolute value of standard loadings was greater than 0.2) on major correlated components (values of standardized weights were greater than 0.7) were identified as the main limiting factors of maize yield in zones. Yield in three management zones was measured and the limiting factors of yield in different zones were evaluated. The results showed that limiting factors for yield were silt, sand, Soil Organic Carbon (SOC), Soil Water Content (SWC), Available Nitrogen (AN), and Total Nitrogen (TN) in the whole field, which was different from management zones. The limiting factors of M1 were silt, sand, clay, AN, Electrical Conductivity (EC), TN, and Total P (TP). Limiting factors of M2 were silt, sand, SWC, while the limiting factors were elevation, sand, clay, and EC for M3. Different yield estimation models were established by using CCR in management zones and the whole field. The correlation between simulated and measured yield was high, with2of 0.75 and nRMSE of 0.20 in the whole field; in management zones, higher simulation accuracy was found: the2of yield estimation model was 0.91, 0.84, and 0.76, while nRMSE were 0.15, 0.14, and 0.16 in M1, M2, and M3, respectively. For model validation, the2values were 0.70, 0.83, 0.78, and 0.71, while nRMSE were 0.21, 0.16, 0.18, and 0.17 in the whole field, M1, M2, and M3, respectively. According to the results, different ways of improving yield were found. For the whole field, soil amelioration and fertilizer application before sowing were the keys to increase yield. The application of organic fertilizer and phosphorus fertilizer, reduction of soil EC, and the improvement of soil water holding capacity were conducive to the improvement of yield in M1. Because soil texture and SWC were the main factors limiting the yield, improving soil water holding characteristics was also the way to increase yield in M2. For M3, irrigation before sowing could decrease EC of surface soil and improve soil water storage, which was beneficial to the emergence and growth of maize. Organic fertilizer application should also be considered for yield improvement in M3. Distributed management should be adopted based on the limiting factors of maize yield in management zones. farmlands; zones; maize; limiting factors; yield estimation model; precision agriculture; correlated component regression 陈世超,杜太生,王素芬,等. 基于农田管理分区的制种玉米产量估算与限制因子评价[J]. 农业工程学报,2020,36(15):128-133.doi:10.11975/j.issn.1002-6819.2020.15.016 http://www.tcsae.org Chen Shichao, Du Taisheng, Wang Sufen, et al. Evaluation of limiting factors and prediction of seed maize yield based on management zones[J]. Transactions of the Chinese Society of Agricultural Engineering (Transactions of the CSAE), 2020, 36(15): 128-133. (in Chinese with English abstract) doi:10.11975/j.issn.1002-6819.2020.15.016 http://www.tcsae.org 2020-03-24 2020-07-10 国家自然科学基金项目(51725904、51861125103);农业部公益性行业科研专项(201503125) 陈世超,博士生,主要从事节水灌溉理论与新技术研究。Email:chenshichaocsc@cau.edu.cn 杜太生,博士,教授,主要从事农业节水与水资源高效利用研究。Email:dutaisheng@cau.edu.cn 10.11975/j.issn.1002-6819.2020.15.016 S278 A 1002-6819(2020)-15-0128-060 引 言
1 材料与方法
1.1 研究区概况
1.2 数据采集与分析
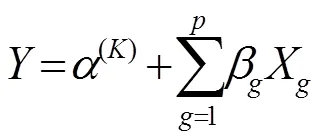
1.3 相关成分回归法

1.4 管理区划分
2 结果与分析
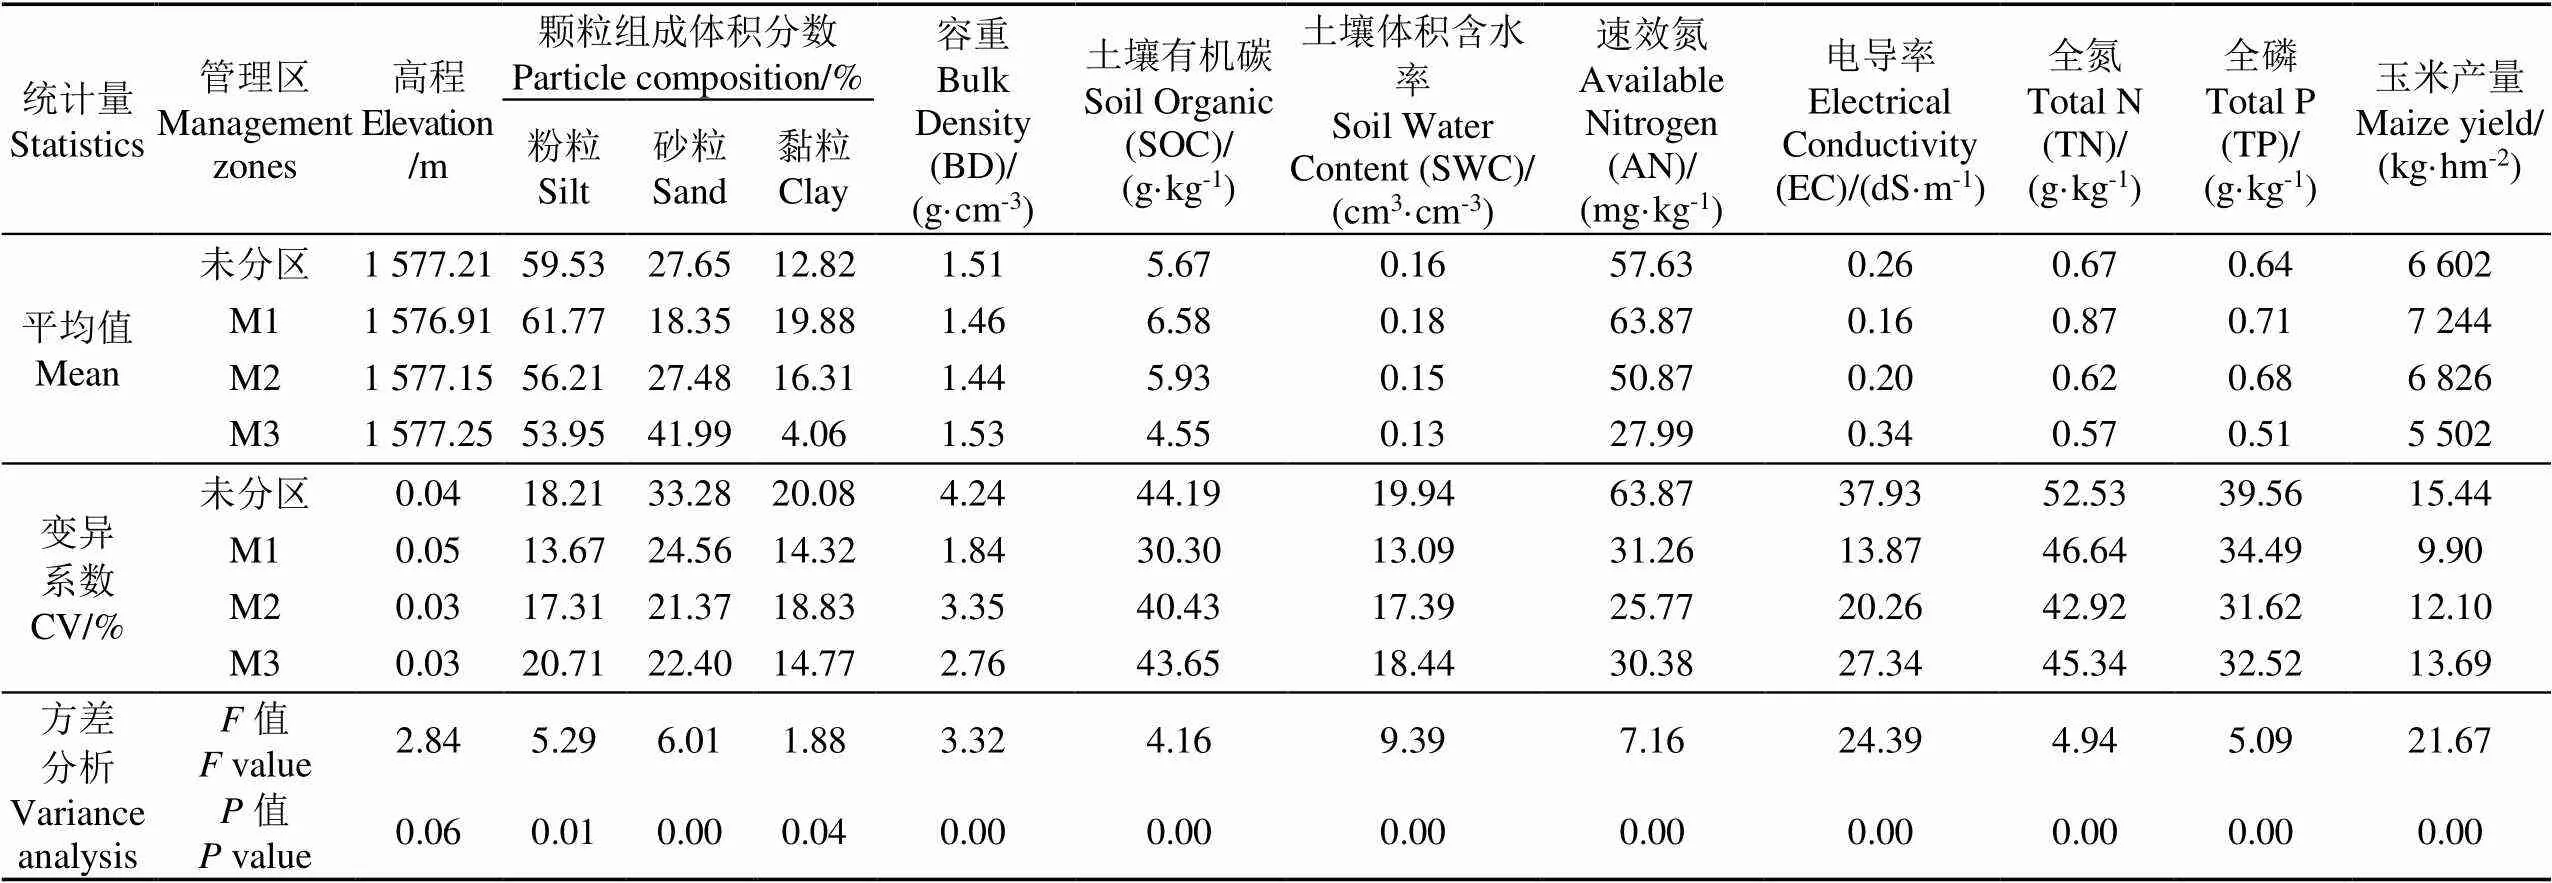
2.1 土壤及产量的描述性统计分析
2.2 产量限制因子分析


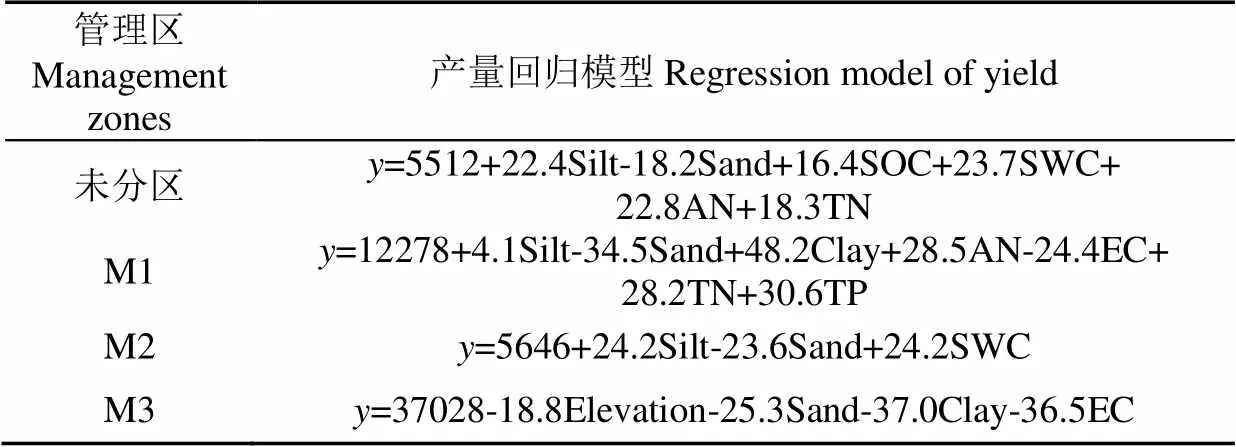
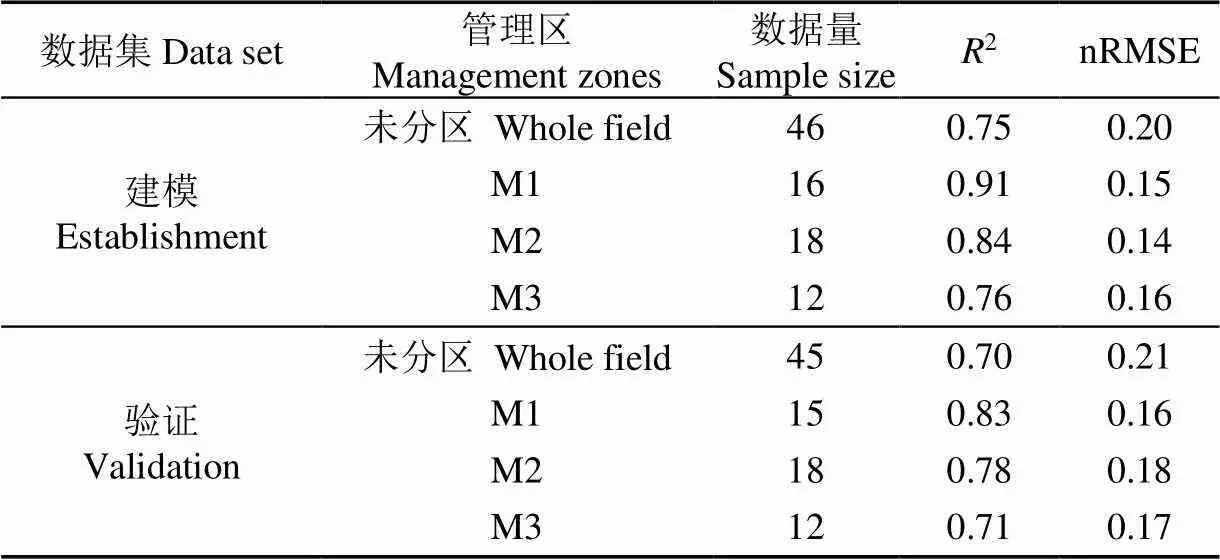
2.3 基于CCR的产量估算模型建立与验证


3 讨 论
4 结 论

