小兴安岭典型苔草和灌木沼泽N2O排放通量日变化研究
石兰英 牟长城 孙晓新


摘要:探明小興安岭修氏苔草(Carex schmidtii)沼泽和油桦-修氏苔草(Betula ovalifolia-Carex schmidtii)灌木沼泽N2O排放通量日变化动态,可为山地沼泽N2O排放季节动态及总量估算提供基础数据。因此,于生长季初期(2008年6月4~5日)、中期(2007年8月4~5日)和末期(2007年9月24~25日),在小兴安岭苔草和灌木沼泽中,采用静态暗箱—气相色谱法,在晴天观测了N2O排放通量。两种沼泽N2O排放通量日变化在生长季中期呈现昼高夜低规律,末期和初期的日排放规律性不显著。生长季中期和初期,苔草沼泽N2O日排放通量最高值出现在9:00,末期最高值出现在3:00;生长季初期和末期的最低值出现在21:00,中期最低值出现在18:00。生长季初期、中期和末期,灌木沼泽N2O日排放通量最高值分别出现在9:00、15:00和6:00;最低值分别出现在3:00、21:00和18:00。两种沼泽生长季初期为N2O的吸收汇,中期和末期为弱排放源。灌木沼泽的N2O日排放通量明显高于苔草沼泽。生长季初期和末期,两种沼泽N2O日排放通量与温度呈负相关,中期呈正相关。其中,苔草沼泽N2O日排放通量与10 cm土温呈现显著负相关,灌木沼泽与15 cm土温呈现显著负相关。苔草沼泽N2O日排放通量与地表温度呈现显著正相关,灌木沼泽与40 cm土温呈现显著正相关。据此,小兴安岭苔草沼泽和灌木沼泽为N2O排放弱源或吸收汇,温度、水位和植被类型是N2O日排放通量的主要影响因素。
关键词:N2O排放通量;日变化;修氏苔草沼泽;油桦—修氏苔草灌木沼泽;温度;小兴安岭
Abstract: In order to provide basic data for seasonal dynamics and total amount estimation of N2O emission from mountain marshes, this study was performed to understand the diurnal variation of N2O emission fluxes from Carex schmidtii marsh and Betula ovalifolia-Carex schmidtii shrub swamp in Xiaoxing'an Mountains. An experiment was conducted to observe the diurnal variation of N2O fluxes in marsh and shrub swamp in Xiaoxing'an Mountains using the static opaque chamber and gas chromatography techniques on August 4-5 of 2007, September 24-25 of 2007, and June 4-5 of 2008. The results showed that the diurnal variation of N2O emission flux in two kinds of marshes showed a diurnal high-night low pattern on August 4-5 of 2007, the daily emission regularity is not significant on September 24-25 of 2007 and June 4-5 of 2008. The highest N2O fluxes in marsh were appeared at 9:00 on August 4-5 of 2007 and June 4-5 of 2008, and appeared at 3:00 on September 24-25 of 2007. The lowest N2O fluxes in marsh were appeared at 21:00 on June 4-5 of 2008 and September 24-25 of 2007, and appeared at 18:00 on August 4-5 of 2007. The highest N2O fluxes in shrub swamp were appeared at 15:00 on August 4-5 of 2007 and appeared at 6:00 on September 24-25 of 2007, and appeared at 9:00 on June 4-5 of 2008. The lowest N2O fluxes in shrub swamp were appeared at 21:00 on August 4-5 of 2007, and appeared at18:00 on September 24-25 of 2007 and appeared at 3:00 on June 4-5 of 2008. Two kinds of marshes were the absorption sinks of N2O on June 4-5 of 2008, and were the weak emission sources on August4 -5 and September 24 to 25, 2007. The diurnal variation N2O fluxes of shrub swamp were higher than those of marsh. The daily N2O emission flux of two kinds of marshes were negatively correlated with temperature on September 24-25 of 2007 and June 4-5 of 2008, and were Positive correlation with temperature on August 4-5 of 2007. Among them, the daily N2O emission fluxes of marsh were negatively correlated with 10 cm soil temperature, while that of shrub swamp were negatively correlated with 15 cm soil temperature. The diurnal N2O emission fluxes of marsh were positively correlated with surface temperature, while that of shrub swamp were positively correlated with 40 cm soil temperature. The marsh and shrub swamp in Xiaoxing'an Mountains were weak sources or sinks of N2O emission, the temperature, water level and vegetation types were the main influencing factors of N2O daily emission fluxes.
Key words: N2O fluxes; diurnal variation; Carex schmidtii marshes; Betula ovalifolia-Carex schmidtii shrub swamp; temperature; Xiaoxing'an Mountains
N2O(氧化亚氮)作为大气中仅次于二氧化碳和甲烷的第三大温室气体,因其对全球气候变暖具有重要的推动作用及对臭氧层的破坏作用,近年来备受关注[1-3]。湿地N2O排放量约占全球总排放量20%[4,5]。N2O排放通量的日变化研究,以小时间尺度揭示其排放动态及影响因素,有助于季节排放规律探究及年际排放量估算[6]。温度和土壤含水量是影响N2O通量最主要的因子[7],同时,因环境条件、植被和季节的变化,其通量具有很强的时间变异性[8]。有研究认为天然湿地植物生长季N2O通量无明显的日变化[9,10],也有研究发现N2O排放日变化明显,夜晚是排放高峰期[11],还有研究认为午后为排放高峰期[12],说明在不同的季节、湿地类型或区域间,N2O日排放通量可能存在较大差异。
小兴安岭是东北三大林区湿地主要分布区之一[13],该区苔草和灌木沼泽N2O排放通量日变化的研究还未见报道。本研究根据野外实测结果,分析了小兴安岭典型修氏苔草(Carex schmidtii)沼泽和油桦-修氏苔草(Betula ovalifolia-Carex schmidtii)灌木沼泽N2O排放通量日变化规律及其与温度和水位等因子的关系,以期为山地沼泽N2O季节排放通量和总量估算及湿地保护提供参考。
1 材料与方法
1.1 研究区域概况
试验地点位于小兴安岭中段的黑龙江省伊春市友好林业局永青林场(48°3′53″N~48°17′11″N,128°30′36″E~128°45′E)。该区海拔260~500 m,属于温带大陆性湿润季风气候,年平均温度为0.4 ℃,积温2 000~2 500 ℃。该区年降水量为630 mm,主要是冬季降雪和7~8 月降水两个高峰,占全年降水量的70%。该区地带性土壤为暗棕壤,占所有土壤类型的71%,草甸土和沼泽土占27%,泥炭土占2%[2]。
参照文献[14],以优势植被进行分类,确定试验地的沼泽类型分别为季节性积水的修氏苔草沼泽和油桦—修氏苔草灌木沼泽 [14]。
1.2 数据采集
气体的采集与分析采用静态暗箱—气相色谱法[2,15]。采样时间为生长季初期(2008年6月4~5日)、中期(2007年8月4~5日)和末期(9月24~25日)。观测日天气晴朗,开始取样时间为上午9:00,3 h取样1次,一天共取样8次。气体采样的同时原位同步测定空气温度、采样箱内温度、地表温度和地下5、10、15、20、30、40 cm土壤温度及地下水位 [2,6]。
苔草沼泽和灌木沼泽的草本生物量分别为(466±61) g 和(218±78) g。生长季初期、中期和末期苔草沼泽的平均水位为6.4、-15.7、-8.7 cm;灌木沼泽为0.5、-45.0、-23.8 cm[2,6,15]。
1.3 统计分析
应用单因子方差分析(LSD法)进行三样本间差异性检验;选择独立样本T检验和成对样本T检验进行相同月份和不同月份双样本的差异性检验;采用Pearson相关分析进行温度与排放通量的相关性分析,所有过程均由SPSS 19.0软件完成,采用Excel 2003软件作图。
2 结果与分析
2.1 苔草和灌木沼泽N2O排放通量日变化
由图1可知,小兴安岭典型苔草沼泽N2O日变化规律表现为:生长季中期排放通量具有比较明显的昼高夜低规律,生长季初期和末期,排放规律性不明显。其中,在苔草沼泽生长季中期,最高值出現在9:00,为0.030 mg/(m2·h),之后迅速下降,至18:00达到最低值-0.008 mg/(m2·h),21:00至第二日6:00左右表现为波动上升;在生长季末期,N2O排放通量由9:00开始逐渐降低,至18:00降至最低,为-0.005 mg/(m2·h),由21:00又迅速升高,至第二日3:00达到最高值0.008 mg/(m2·h);生长季初期最高值出现在9:00,为0.002 mg/(m2·h),最低值出现在21:00,为-0.014 mg/(m2·h),其他时间表现为不规律的波动。
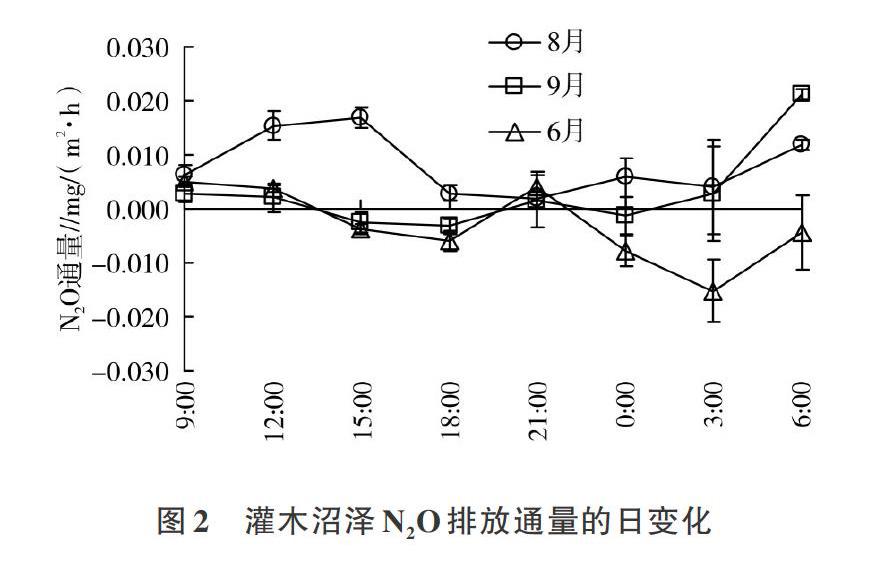
由图2可知,灌木沼泽在生长季中期N2O排放通量在9:00至15:00为排放峰值期,峰值出现在15:00,为0.017 mg/(m2·h),21:00以后呈现波动性升高趋势,最低值出现在21:00,为0.002 mg/(m2·h);生长季末期N2O排放通量在6:00达到最高值0.021 mg/(m2·h),然后逐渐降低,至18:00达到全天最低值-0.003 mg/(m2·h),21:00至第二日3:00出现不规则波动;生长季初期,9:00达到高峰值0.005 mg/(m2·h),3:00达到最低值-0.015 mg/(m2·h),其他时段表现为不规律波动。
2.2 苔草和灌木沼泽N2O日排放通量及其差异
两沼泽在生长季中期和末期为N2O的弱排放源,初期为N2O的吸收汇。其中,苔草沼泽在生长季中期的N2O日排放通量平均值为0.008 0 mg/(m2·h),日变幅为200.0%~262.5%;末期为0.000 9 mg/(m2·h),日变幅为655.6%~788.9%;初期为-0.005 5 mg/(m2·h),日变幅136.4%~154.5%。单因素方差分析可知,3个时期的日排放通量间具有显著的差异(P<0.05),成对样本T检验结果表明,2008年6月4~5日与2007年8月4~5日排放通量间差异极显著(P<0.01),2008年6月4~5日与2007年9月24~25日间差异显著(P<0.05)。
[9] 王毅勇,郑循华,宋长春,等.三江平原湿地CH4、N2O的地-气交换特征[J].地理研究,2006,25(3):457-467.
[10] HIROTA M, SENGA Y, SEIKE Y, et al. Fluxes of carbon dioxide, methane and nitrous oxide in two contrastive fringing zones of coastal lagoon, Lake Nakaumi, Japan[J]. Chemosphere, 2007(68): 597-603.
[11] CHEN G C, TAMA N F Y, YE Y. Summer fluxes of atmospheric greenhouse gases N2O, CH4 and CO2 from mangrove soil in South China[J]. Science of the total environment, 2010,408(13):2761-2767.
[12] 王德宣,宋长春,王跃思,等. 若尔盖高原沼泽湿地N2O排放通量研究[J]. 生态科学,2005,24(3): 193-196.
[13] 国家林业局. 全国首次湿地资源调查[J]. 新安全,2004,2(9): 24-25.
[14] 郎惠卿. 中国湿地植被[M]. 北京:科学出版社, 1999. 35-74.
[15] 牟长城,石兰英,孙晓新. 小兴安岭典型草丛沼泽湿地CO2、CH4和N2O的排放动态及其影响因素[J]. 植物生态学报,2009, 33(3):617-623.
[16] FRENEY J R, DENMEAD O T, WATANABE I, et al. Ammonia and nitrous oxide losses following applications of ammonium sulfate to flooded rice[J]. Australian journal of agricultural research, 1981, 32(1):37-45.
[17] 郑循华,王明星,王跃思,等. 温度对农田N2O产生与排放的影响[J]. 环境科学,1997,18(5):1-5.
[18] BAGGS E M, BLUM H. CH4 oxidation and emissions of CH4 and N2O from Lolium perenne swards under elevated atmospheric CO2[J]. Soil biology & biochemistry,2004,36(4):713-723.
[19] ZHOU C Y, ZHANG D Q, WANG Y S, et al.Diurnal variations of greenhouse gas fluxes from mixed broad-1eaved and coniferous forest soil in Dinghushan[J]. China forestry science and technology, 2005,4(2):1-7.
[20] 陳全胜,李凌浩,韩兴国,等.典型温带草原群落土壤呼吸温度敏感性与土壤水分的关系[J].生态学报,2004,24(4):831-836.

