
Establishment and evaluation of Type 2 Diabetes Mellitus andits complications induced by low dose of multiple streptozotocin
2020-07-31 09:25:10XianMeiZhangQinGuoSunXieXieXiaoMingDingZeWeiCongMingZhu
Journal of Hainan Medical College 2020年11期
Xian-Mei Zhang, Qin-Guo Sun, Xie Xie, Xiao-Ming Ding, Ze-Wei Cong, Ming Zhu
Department of Traditional Chinese Medicine Tongren Hospital of Wuhan University(Wuhan Third Hospital),Wuhan 430060
Keywords:High-fat diet SD rat Streptozotocin Diabetic nephropathy Diabetic osteoporosis
ABSTRACT Objective: To explore a simple, economical and feasible method for establishing type 2 diabetes mellitus and its complication model. Method: SD rats were randomly divided into two groups: normal group (15 rats) normal diet, model group (20 rats) with high glucose and high fat diet. After 2 weeks of feeding, model group was injected low dose(30mg/Kg) streptozotocin in the abdominal cavity, once a day for 6 days, normal group was injected with the same dose of citric acid buffer. Observe the changes of rat diet, body, hair, spirit, urine volume, and monitor weight, blood glucose. After 6 weeks, fast insulin, blood lipid, serum calcium, phosphorus and other biochemical indexes of rats, after HE staining observe morphologic variations changes of pancreas and kidney using microscope, and the changes of femoral bone in SD rats. Results: Compared with the normal group, the model group showed obvious symptoms, drink more, eat more, polyuria, emaciation, hyperglycemia, low calcium, low phosphorus, hyperlipidemia and other metabolic abnormalities, pancreatic atrophy, tissue fibrosis, glomerular area increased, basement membrane thickening, osteoporosis. Conclusion: High glucose and high fat diet combined with repeated intraperitoneal injecti on of low dose STZ can be successfully established the model of type 2 diabetes, and its high successful rate, low mortality rate, relatively simple, economical and feasible, has a certain significance of research on diabetes and its complications.
1. Introduction
According to the international diabetes federation statistics, in 2015, there are 415 million diabetes mellitus patients in the world, and about 50000 people died of diabetes,and diabetes caused by diabetes global health spending was estimated to be $6.73 billion. More than 90% were Type 2 diabetes mellitus, and these figures showed a trend of increase year by year, the incidence of T2DM is gradually increasing in our country rend [1-2]. The animal model of diabetes is the cornerstone of the study of diabetes and its complications, and the ideal model is the key of mechanism and pharmacy research diabetes and its complications. Currently, there is no unified standard for the modeling method of diabetes and its complications in China, which is influenced by experimental conditions, economic capacity, resource allocation, epidemiology and other factors, and most of the induced diabetes models of the T2DM studies are conducted. Intraperitoneal streptozotocin injection in SD, Wistar rats, C57BL and KM mice is a relatively well-studied method [3-11], Combined with the experimental design, SD rats were selected to establish an animal model of T2DM and its complications by multiple low-dose intraperitoneal STZ injections on a high-fat diet.
2.Experimental reagents and materials
SD rats (male, weight 180-200g) and feed were purchased from Hubei Hxperimental Animal Research Center (SCXK hubei 2008-0005) and fed to experimental animal center of our hospital (SYXK hubei 2014-0080). Rats routine biochemical indexes by the hospital clinical laboratory testing, Automatic Bochemical Analyzer (AU - 5400, beckman company), Scanning Electron Microscopy (VEGA3, Czech Thai Ken), Inverted Light Microscope (Olympus, Japan), glucose meter and test paper (Johnson & Johnson house type), streptozotocin (Sigma company), HE staining kit (Wuhan bayer biotechnology co. LTD), Insulin and Elisa kit (Wuhan huamei biological engineering co, LTD, CSB - E05070r).
2.1 Experimental methods
The modeling method randomly divided SPF rats into two groups, Normal group (15, 152.00±8.91g), general diet (corn 30%, wheat flour 21%, soybean meal 20%, bran 16%, fish meal 8%, yeast 2.5%, bone meal 1.5%, vegetable oil 0.3%, salt 0.5%, multidimensional element 0.2%), Model group (20 rats, 152.81±8.10g in weight), high-fat diet (normal feed 50%, lard 16%, sucrose 12%, egg yolk 12%, milk powder 5%, peanut 4%, sesame oil 0.5%, salt 0.5%). After 2 weeks of adaptive feeding, model group (20 animals, weight 151.06±7.96g) were intraperitoneally injected with 3%STZ at 30mg/kg, once a day, six times in a row, when the blood glucose was significantly increased (the blood glucose meter indicated HI), stop the injection once. The normal group was intraperitoneally injected with the same dose of 0.1mol/L citrate buffer. During the modeling period, the diet, spirit, hair and urine of the rats were observed. Detected glucose (the blood glucose meter suggested HI, the highest value was calculated by taking 33.3mmol/L), body weight, once a week.At the 9th week, blood was collected from the vein behind the ear after anesthesia to detect biochemical indicators such as blood calcium and blood phosphorus. The pancreas and kidney were taken for HE staining, and the femurs of both lower limbs were taken for fixation.
2.2 HE staining of pancreas and kidney
Carried out in accordance with the kit instructions: after 9 weeks, sterile conditions in the spleen and kidney, cut into small pieces of 4% paraformaldehyde fixed 24 h, gradient alcohol dehydration, transparent xylene, paraffin wax, paraffin 1 h, xylene, gradient alcohol dewaxing, wood staining, 1% ammonia solution back to blue, rinse red dye solution dyed into Iraq, neutral rubber seal, the microscopic observation.
2.3 Preparation of femur electron microscope sections
Under aseptic conditions to take out the SD rat femur, from the surface of the muscle and fascia, saline develop, fully take the femoral distal 1/3 cut nearly joints, put in decalcified liquid decalcified 48 h, along the sagittal section, with 2.5% glutaraldehyde fixation fluid before fixation after 2 h, 3 times, rinse thoroughly with 0.1 M phosphate buffer and then use 1% osmic acid fixed after 90 min, after rinsing with 50%, 70% and 80%, respectively, 100% gradient dehydration, embedding with epoxy resin, the last slice staining in lead citrate.
2.4 Calculation and statistical methods
According to the homeostasis model assessment method (HOMA), the insulin resistance index (HOMA -IR) was equal to the the fasting blood glucose level (FPG, mmol/L) multiply the fasting insulin level (FINS, mU/L) /22.5. All measurement data were expressed as mean ± standard deviation (±s), using SPSS16.0 software analysis. Independent sample t test was used for pantwise comparison between means, and P < 0.05 was statistically significant.
3.Results
3.1 General condition of SD rats in normal group and model group
The rats in the model group showed obvious symptoms of "three more and one less" (polyphagia, polyphagia, polyuria, emaciation), poor spirit, restlessness, thin body, dull hair, dirty hair, strong odor, and wet bedding, as shown in FIG. 1 (B). However, rats in the normal group had a good mental state, which was relatively quiet and docile, with white, smooth and shiny hair, dry pad and no peculiar smell, as shown in FIG. 1 (A).
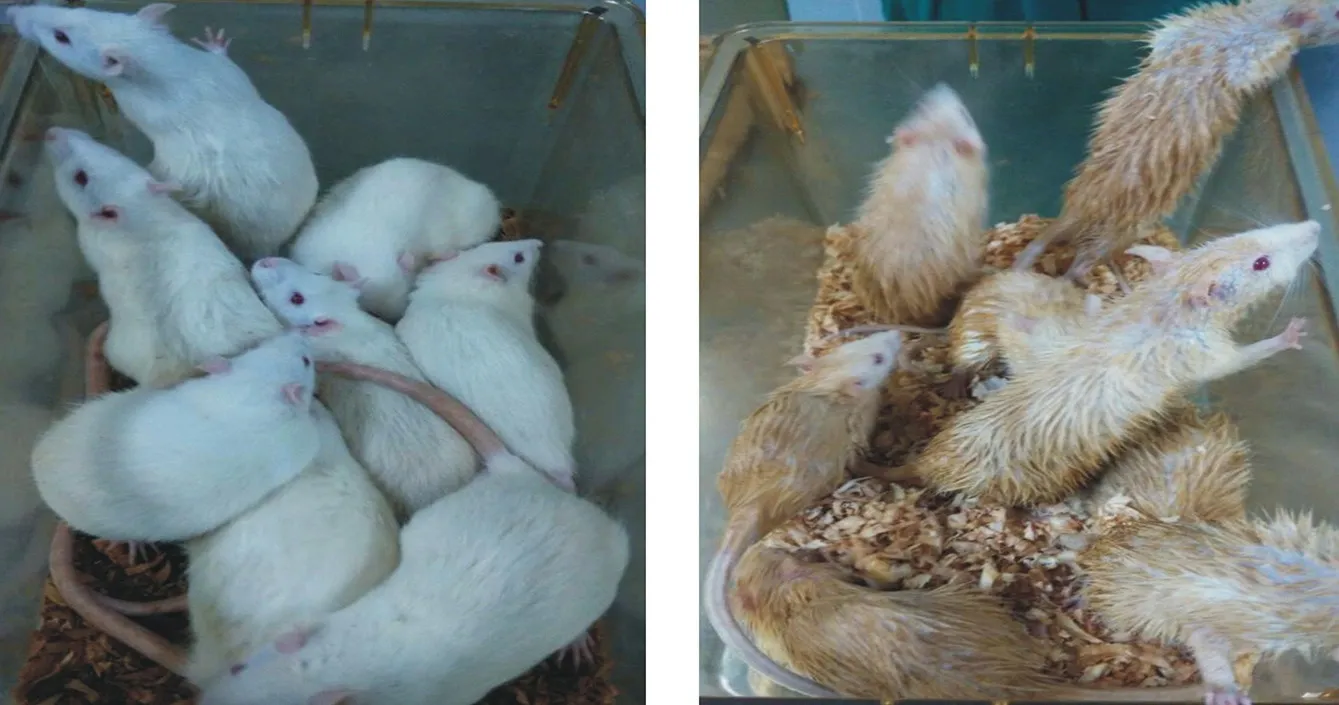
Fig. 1.General observation of SD rats in normal group and model group(A: normal group, B: model group)
3.2 The weight change trend of the normal group and the model group
Found in the whole process of building model group and normal group rats weight presents the change trend of "price scissors" (As shown in the table 1 and figure 2), the first 4 weeks, model group higher than that of normal control group, the average weight of 4 ~ 5 weeks, two groups of average weight (P > 0.05), after 5 weeks ,model group average weight growth is slow, while the average weight in the normal group increased steadily, the weight gap between the two groups gradually widened (P < 0.05).
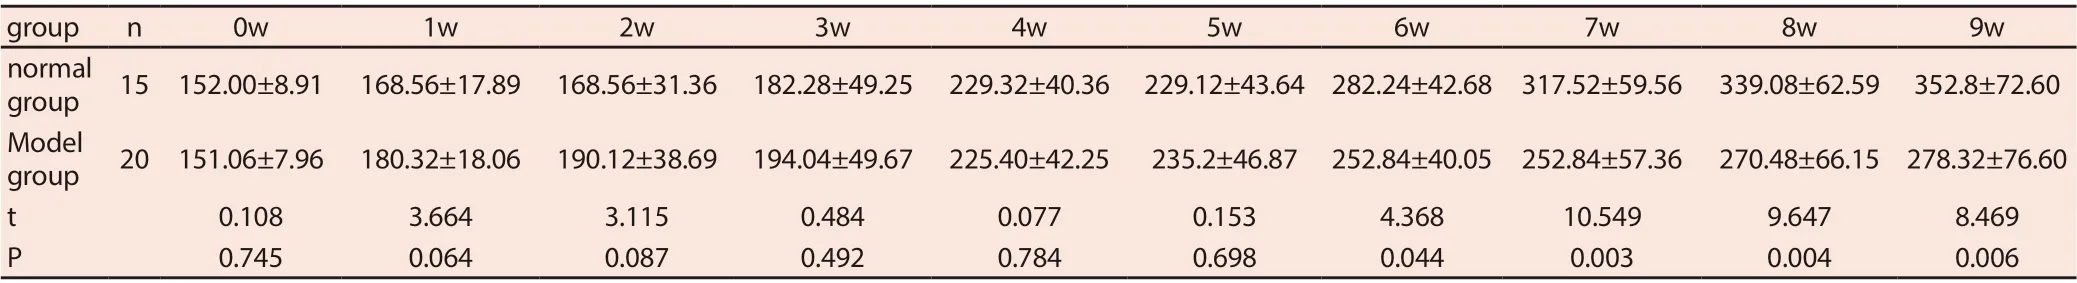
Tab. 1. Trend of body weight change in normal and model groups
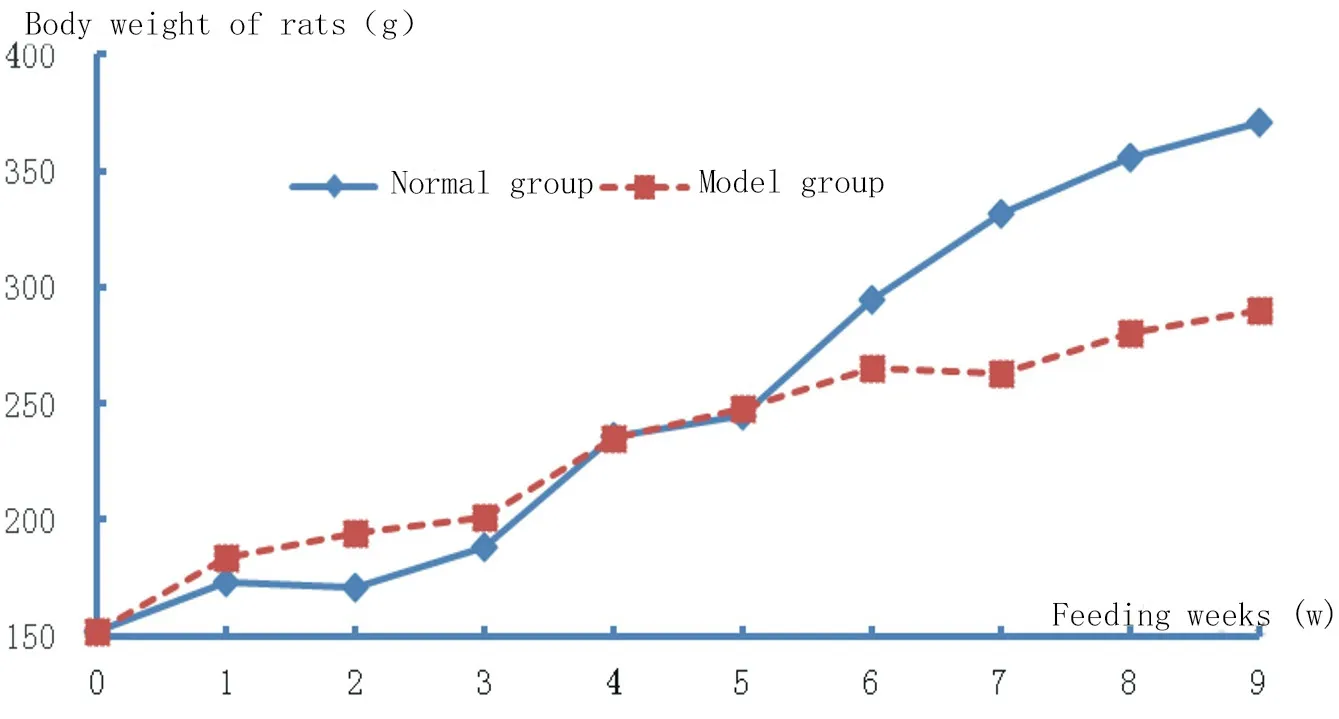
Fig. 2. Trend of body weight change in normal and model groups
3.3 Blood glucose was compared between the normal group and the model group
As shown in table 2 and figure 3, blood glucose in the normal group was relatively stable with a small error, while that in the model group was significantly higher than that in the normal group every week (P < 0.05), with a large fluctuation and a relatively large error. Blood glucose was significantly higher in 4-6 weeks with an average of ≥20mmol/L.
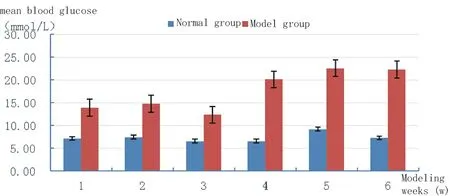
Fig. 3. Comparison of blood glucose between normal group and model group
3.4.Pathological changes of pancreas and kidney in normal group and model group
In the model group, compared with the normal group, the pancreas was reduced in size, with partial fibrosis, thin cords of shadows between the acinus and around the lobules, and scattered alveolar degeneration, as shown in FIG. 4 (B). In the model group, the glomerular area increased, the medullary loop lumen slightly expanded, part of the basement membrane thickened, the extracellular matrix increased, the glomerular mesangial region of the glomerulus increased, and the glomerular capillary cells proliferated, as shown in FIG. 4 (D). The normal glomerular vascular loop was thin and clear.
3.5 Changes of femoral bone in normal group and model group
The trabeculae in the normal group were distributed in a dense and uniform way with small spacing, as shown in FIG. 5 (A). The distribution in the model group was sparse, rough and irregular, and the gap increased significantly as shown in FIG. 5 (B).

Fig. 4. Pathological changes of pancreas and kidney in normal group and model group (A : the normal group pancreas, B : the model group pancreas, C: the normal group kidney, D: the model group kidney, HE× 400)
3.6 The normal group and the model group were compared on the conventional biochemical indicators
In the model group, triglycerides and total cholesterol were significantly increased, and metabolic abnormalities such as low calcium, low phosphorus, low magnesium, high insulinemia, and insulin resistance were observed. Cystatin C, fasting insulin, and moma-ir were increased, among which blood P, TC, CysC, FINS, and moma-ir were compared with those in the normal group, with P < 0.05, indicating statistical significance. See table 3.
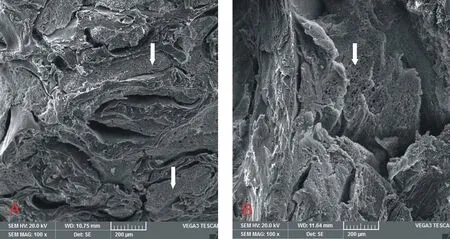
Fig. 5. Femur bone changes in normal group and model group (A: normal group, B : model group )
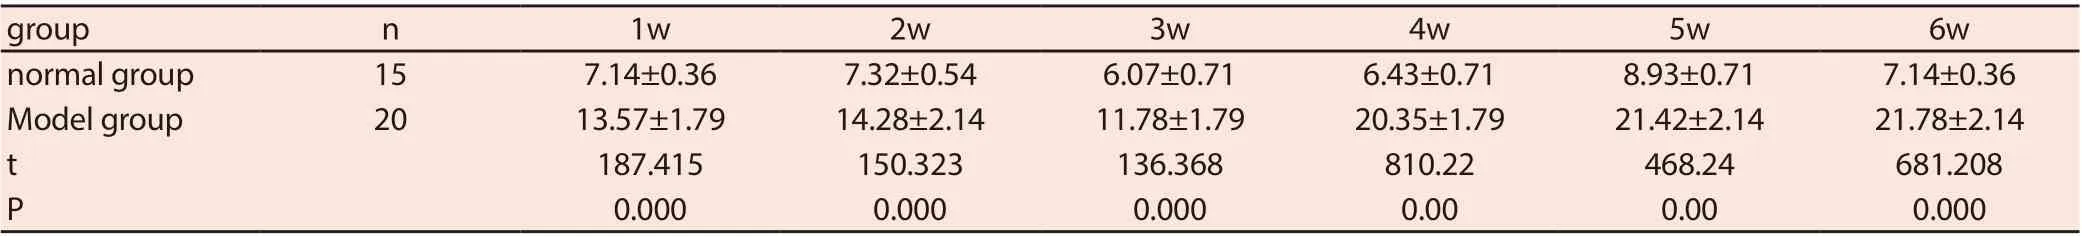
Tab. 2. Comparison of blood glucose between normal group and model group
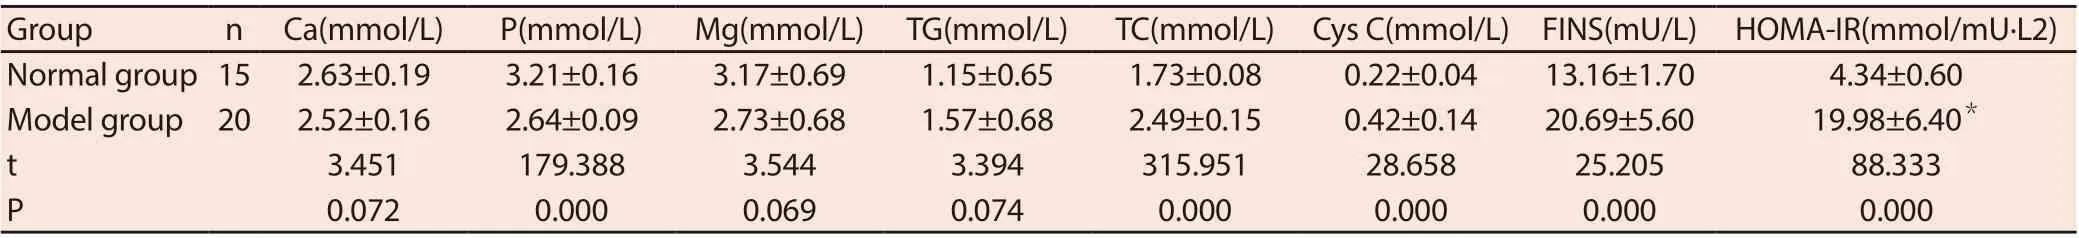
Tab. 3.Comparison of routine biochemical indexes between normal group and model group(x±s)
4.Discussion
The pathophysiological characteristics of type 2 diabetes are the decreased ability of insulin to regulate glucose metabolism (insulin resistance) accompanied by the decrease of insulin secretion caused by the functional defects of pancreatic islets., the T2DM model should conform to this feature as much as possible .Review [12] found induced experimental animal models are commonly used in our country at present and the economic model choice, including chemical drug induced joint food method is the most commonly used in the experimental process, but in the intervention of revulsant choose difference and revulsant dose, way, time, frequency and other factors influencing the success rate and the stability of the model. In this study, the model of T2DM and its complications was established by injecting SD rats with high-fat diet and STZ with several small doses intraperitoneally. High-fat diet can cause abnormal glucose and lipid metabolism, which reduces insulin sensitivity and induces insulin resistance by affecting fatty acid transport, oxidation, synthesis and insulin signaling [13-15]. STZ is transported to cells of beta cell by glucose transporter 2, leading to DNA methylation, and increasing reduced nicotinamide adenine dinucleotide phosphoric acid and oxygen free radicals, activating protein kinase C pathway and other pathways to destroy insulin function [16]. The modeling method of high-fat diet combined with small-dose STZ has a short time, high modeling rate and relatively good model stability, which is more in line with the pathological characteristics of T2DM than the high-fat diet alone or STZ intraperitoneal or tail-vein injection alone [17]. By this method, the rats in the model group showed obvious symptoms of "three more and one less". Compared with the normal group, the rats in the model group were significantly smaller and smaller in body shape, with dull and dirty hair, strong odor, moist padding, increased blood sugar and blood lipid, hyperinsulinemia, and resistance to pancreatic islet function, which were in line with the symptoms and pathological characteristics of T2DM. During the experiment, the number of intraperitoneal STZ injection was flexibly handled according to the general observation of the rats and the detection of blood glucose and body weight, which improved the success rate of the model and reduced the mortality rate of the rats. With random blood glucose ≥ 16.7mmol /L as the diagnostic standard, blood glucose was detected every week, and the mold formation rate fluctuated between 60% and 85%. The death time of rats in the model group was mainly concentrated in the 4th week and the 7th to the 9th week. The analysis may be related to the impact of inducers in the early stage and metabolic disorders caused by high blood glucose in the later stage. The rat body weight test found that the model group presented a "cutlery" like change compared with the normal group, and the analysis suggested that the first four weeks were related to the highfat diet, and the fifth week was related to the metabolic disorder caused by high blood sugar.
Diabetic nephropathy is one of the specific complications of DM and the main cause of renal failure in DM patients. In China, T2DM accounts for over 90%, DN can occur in 20% ~ 40% of DM patients, and DN accounts for 39.7% of DM chronic complications. The course of DM can be as high as 50% in 20-25 years. Microalbuminuria was shown in the early stage, and then a large amount of albuminuria and serum creatinine increased gradually. The histological manifestations were different in different stages. Early renal hypertrophy, increase of extracellular matrix, hyperplasia of mesangial cells, and then mesangial sclerosis, endothelial cell fibrosis, and interstitial vascular thickening gradually appeared. Cystatin C, also known as cysteine protease inhibitor C, is an endogenous marker reflecting changes in glomerular filtration rate. Since it is not affected by inflammation, bilirubin, hemolysis, triglyceride, etc., and is independent of gender, age, and muscle mass, it is a highly sensitive and specific indicator for evaluating renal function [18]. At the end of the 9th week of the experiment, blood samples of this study showed that cystatin C in the model group was increased compared with that in the normal group, which was statistically significant. Moreover, morphological changes in the kidney of the rats were observed under the microscope, indicating that the model rats had some renal function damage, which was consistent with the characteristics of early DN lesions.
Diabetic osteoporosis is one of the DM of serious complications, studies have shown that it may be associated with diabetes duration, age, gender, etc, but so far its pathogenesis is unclear, summary analysis is related to the following factors: high blood glucose causing osmotic diuresis in low calcium, phosphorus, magnesium and electrolyte metabolism disorder, activation of osteoclasts to enhance capacity of bone; The metabolism of protein, fat and nucleic acid caused the increase of glycosylation end products. The decrease of insulin-like growth factor-1 (IGF-1) affects the balance of osteoblasts and osteoclasts. The lack of insulin interferes with the balance of bone formation and bone resorption. Diabetic microvascular lesions affect bone circulation and metabolism, etc[19]. T1DM reduced bone mineral density and increased risk of fractures has been relatively clear, T2DM increased risk of fractures and bone mineral density change is still controversial, this difference analysis and different types of DM early insulin secretion status and effect of insulin on bone anabolic about [20]. This topic in 9 weeks to detect rats blood related indicators, low calcium, phosphorus, magnesium, high insulin and other metabolic abnormalities indicators, take microscope scanning tibia bone change, distribution of trabecular bone thinning, selection of male rats, eliminate the influence of estrogen on bone metabolism, comprehensive analysis in accordance with characteristics of DOP, the related study of DOP.
Based on the comprehensive analysis, the animal model of T2DM and its complications was established by multiple lowdose intraperitoneal STZ injection in this study, which is in line with its main characteristics and has certain reference significance for the related research on T2DM and its complications. However, there are also deficiencies, such as glucose tolerance test, urine protein detection and bone trabecular micromorphic measurement comparison, which require a larger sample size, better experimental design and random control, and close multidisciplinary collaboration.
 Journal of Hainan Medical College2020年11期
- Journal of Hainan Medical College的其它文章
- The potential mechanism of prevention and treatment of COVID-19 by shufeng jiedu capsule was studied based on network pharmacology
- A case of recurrent PMT caused by poor atrial pacing
- Experience of Professor Shao Mingxi in treating knee osteoarthritis based on "Bin Si Xue" acupuncture
- Meta analysis of Masquelet technology and Llizarov technology in the treatment of infectious bone defects
- Acupuncture for post-stroke dysphagia: An overview of systematic reviews
- Effect of TGIF1 expression on epithelial cadherin and Twist1 protein expression in breast cancer cells