
Evaluation of hepatic fibrosis parameter model and elastic modulus of liver and spleen for the diagnosis of hepatic fibrosis in chronic hepatitis b
2020-07-10 07:13:40WeiTingLuYiYunWuHaiYanGuoLiNaLiuJianXueZhao
Wei-Ting Lu, Yi-Yun Wu, Hai-Yan Guo, Li-Na Liu, Jian-Xue Zhao
1.Department of Infectious Diseases, Jiangsu Province Hospital of Chinese Medicine, Nanjing, Jiangsu 210029, China
2.Department of Ultrasound Medicine, Jiangsu Province Hospital of Chinese Medicine, Nanjing, Jiangsu 210029, China
Keywords:Liver fibrosis parameter model Elastography Chronic hepatitis b Hepatic fibrosis The diagnosis
ABSTRACT Objective Toinvestigate the diagnostic value of hepatic fibrosis parameter model and elastic modulus of liver and spleen in hepatic fibrosis of chronic hepatitis b. Methods 77 patients with hepatic fibrosis of chronic hepatitis in the infection clinic were recruited from July 2016 to December 2018. According to the classification of hepatic fibrosis, 23 patients were classified as S1, 20 as S2, 18 as S3 and 16 as S4.The serum indexes of liver function in all patients were tested, FIB-4, APRI and GPR model indexes were calculated. SWE values of liver and spleen were evaluated, and the correlation between FIB-4, APRI, GPR and SWE was analyzed. Results The SWE values of liver and spleen in the study group were significantly higher than those in the normal group (P<0.01), and the differences in serum GGT, PLT, AST and portal vein velocity between the two groups were statistically significant (P<0.01). GGT and PLT were correlated with SWE values of liver and spleen, which were statistically significant (P<0.01).The model indexes of fib-4, APRI and GPR in the study group were all higher than those in the normal group, with statistically significant differences (P<0.01).Pearson correlation analysis showed that liver SWE value and spleen SWE value were positively correlated with fib-4, APRI and GPR, and the differences were significant (P<0.01), with a higher correlation with GPR. Conclusion GGT, PLT and GPR are positively correlated with SWE of liver and spleen, and combined detection can improve the early diagnosis accuracy of liver fibrosis.
1. Introduction
Chronic hepatitis B (CHB) is prone to liver fibrosis to varying degrees. If it is not diagnosed and treated in time, it will inevitably develop into cirrhosis and even liver cancer. Early assessment of liver fibrosis can guide treatment and improve prognosis. At present, liver pathology is still the gold standard for the diagnosis and staging of liver fibrosis, but this test is invasive and difficult to repeat multiple times, and the small amount of specimens cannot comprehensively evaluate the overall liver condition [1, 2]. In recent years, non-traumatic fibrosis diagnosis methods have gradually been applied and popularized in clinical practice, including a variety of liver fibrosis parameter models and ultrasound elasticity tests used in this paper.
Hepatic fibrosis parameter models include APRI, FIB-4, and GPR models, and are recommended for the diagnosis of liver fibrosis in patients with CHB by the 2015 Chinese guidelines [3]. Studies with very large samples suggest that the predictive feasibility of GPR is better than APRI and FIB-4 in both HBeAg-positive and negative patients. However, the performance of GPR in predicting the degree of liver fibrosis still needs further verification and evaluation.
Real-time shear wave elastography (SWE) can evaluate the elastic modulus value (SWE value) of the tissue. The SWE value can indirectly reflect the stiffness of the tissue, because different organs and tissues have different elasticities, such as the abdomen Organs such as liver and kidney, superficial organs such as breast, lymph nodes, etc., and the difference between diseased tissue and normal tissue can also be reflected by the SWE value [5, 6]. Therefore, SWE technology can be used as a clinical evaluation An important method for liver fibrosis in patients with CHB. This study enrolled 77 patients with CHB liver fibrosis in the inpatient department from July 2016 to December 2018, and analyzed the liver fibrosis parameter model and the value of liver and spleen elastic modulus for diagnosis of disease.
2. Materials and methods
2.1 Research object
From July 2016 to December 2018, 77 patients with CHB were selected from our outpatient clinic, 55 males and 22 females. The age range was 20-73 years, and the average age was (48.7 ± 11.2) years. All patients with reference liver SWE value (normal value 2.5-7.0kPa) were divided into normal group (31 cases, SWE value 7.0kPa) and study group (46 cases, SWE value> 7.0kPa). The normal group SWE value range was 4.4-6.9 kPa, the average SWE value is 5.91 ± 0.61kPa, the SWE value range of the study group is 7.1-26.3kPa, and the average SWE value is 12.29 ± 3.92kPa.
Inclusion criteria: ① diagnosed with chronic hepatitis B with a history of 6 months; ② total bilirubin levels were normal, and alanine aminotransferase was less than 400U / L; ③ clinical data of patients were complete. Exclusion criteria: ① patients with other liver diseases, decompensated cirrhosis, and primary liver cancer; ② combined with diseases related to extrahepatic fibrosis; ③ after organ and bone marrow transplantation.
2.2 Research methods
2.2.1 Serological indicators of liver function
Collection of fasting blood in the early morning of test patients, preparation of serum, and detection of GGT (glutamyl transferase), PLT (platelet), AST (aspartate aminotransferase), ALT (alanine) by using the blood routine analysis instrument of the American BECKMAN COULTER AU5800. Acid transaminase) and other liver function indicators, the detection method is strictly in accordance with the kit.
2.2.2 Portal Doppler Ultrasound
The patient was fasted for more than 8 hours, and the color Doppler diagnostic apparatus and 2-5MHz convex array probe were used to monitor the portal vein pressure and portal flow rate.
2.2.3 Different liver fibrosis parameter models [7, 8]
FIB-4 index calculation formula: FIB-4 = [Age (years) AST (U / L)] / [PLT count (109 / L) ALT (U / L) 1/2];
APRI index calculation formula: APRI = [AST (U / L) / Upper normal value (ULN) / PLT count (109 / L) 100 (ULN of our hospital: 40U / L for men, 32U / L for women);
GPR index calculation formula: GPR = GGT / ULN 100 / PLT (109 / L).
2.2.4 Detection of liver and spleen elastic modulus [9, 10]
All patients were fasted for more than 8 hours before SWE examination. Supersonic Axplore instrument was used and SC6-1 probe was used for SWE detection.
The operation of liver SWE is as follows: take a supine position, breathe for a few seconds calmly, take 1cm under the liver capsule of the right anterior lobe of the liver, when the two-dimensional ordinary ultrasound image is stable and clear, switch to SWE mode, the probe is properly pressurized, and the image is frozen and frozen image. The operation of the spleen SWE is as follows: take the right side, hold your breath for a few seconds, select the appropriate position of the spleen between the left intercostal space, switch the SWE mode, and perform image collection. The sampling frame of all patients was (3×4) cm2, and then a circular area with a diameter of 2-3 cm was selected as a quantitative measurement. Five valid measurements were collected and the average value was calculated.
2.3 Statistical methods
SPSS 20.0 statistical software was used for analysis. The measurement data that conformed to the normal distribution was expressed as mean ± standard deviation (x ± s). The intra-group and inter-group comparisons were analyzed by t test. Pearson softwarewas used to divide liver parameters and liver fibrosis parameters. Correlation between model indicators and SEW values. P <0.05 was considered statistically significant.
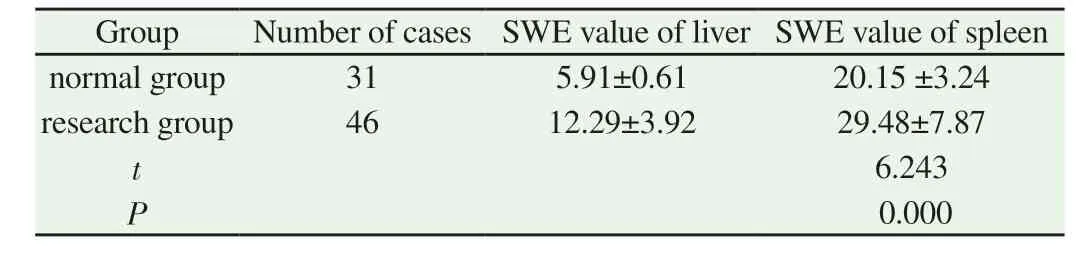
Table 1 SWE values of patients in two groups (x ± s, kPa)
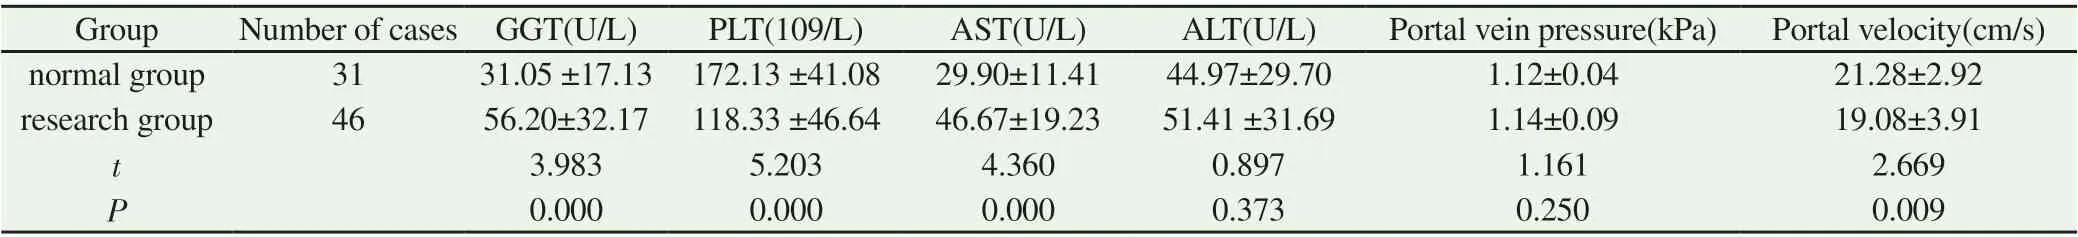
Table 2 Indexes of liver function in two groups of patients (x ± s)
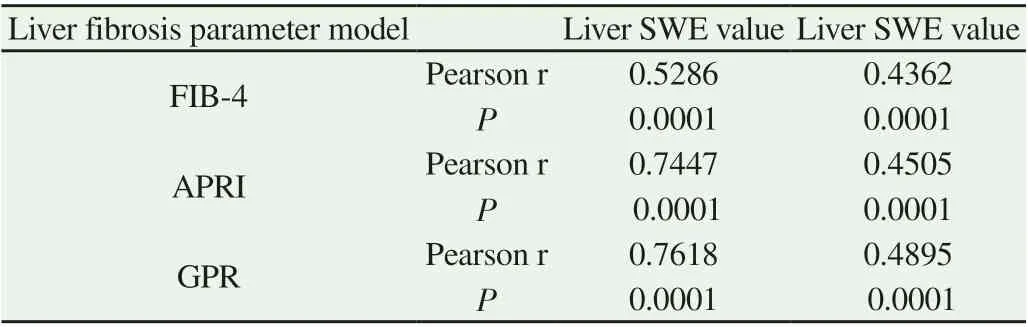
Table 5 Correlation analysis between liver fibrosis parameter model index and SWE value
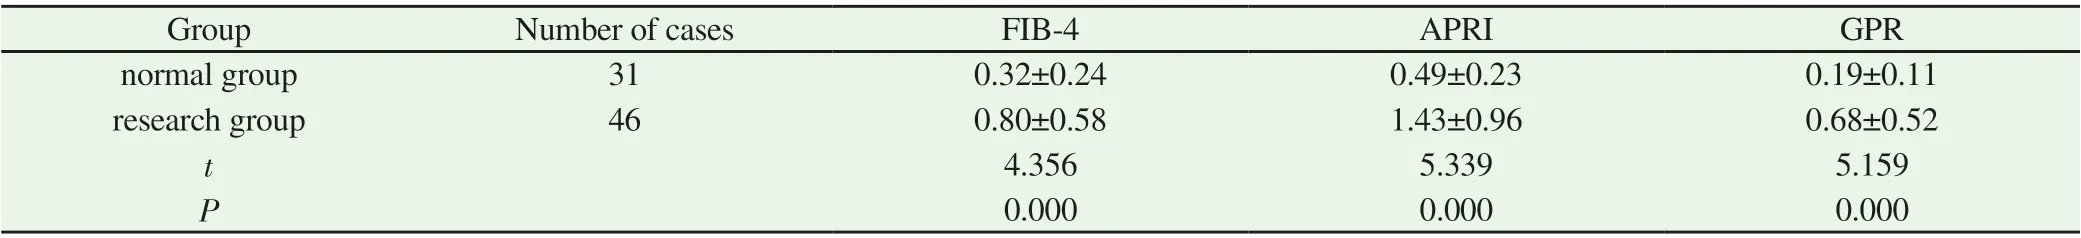
Table 3 Parameters model of liver fibrosis in two groups of patients (x ± s)
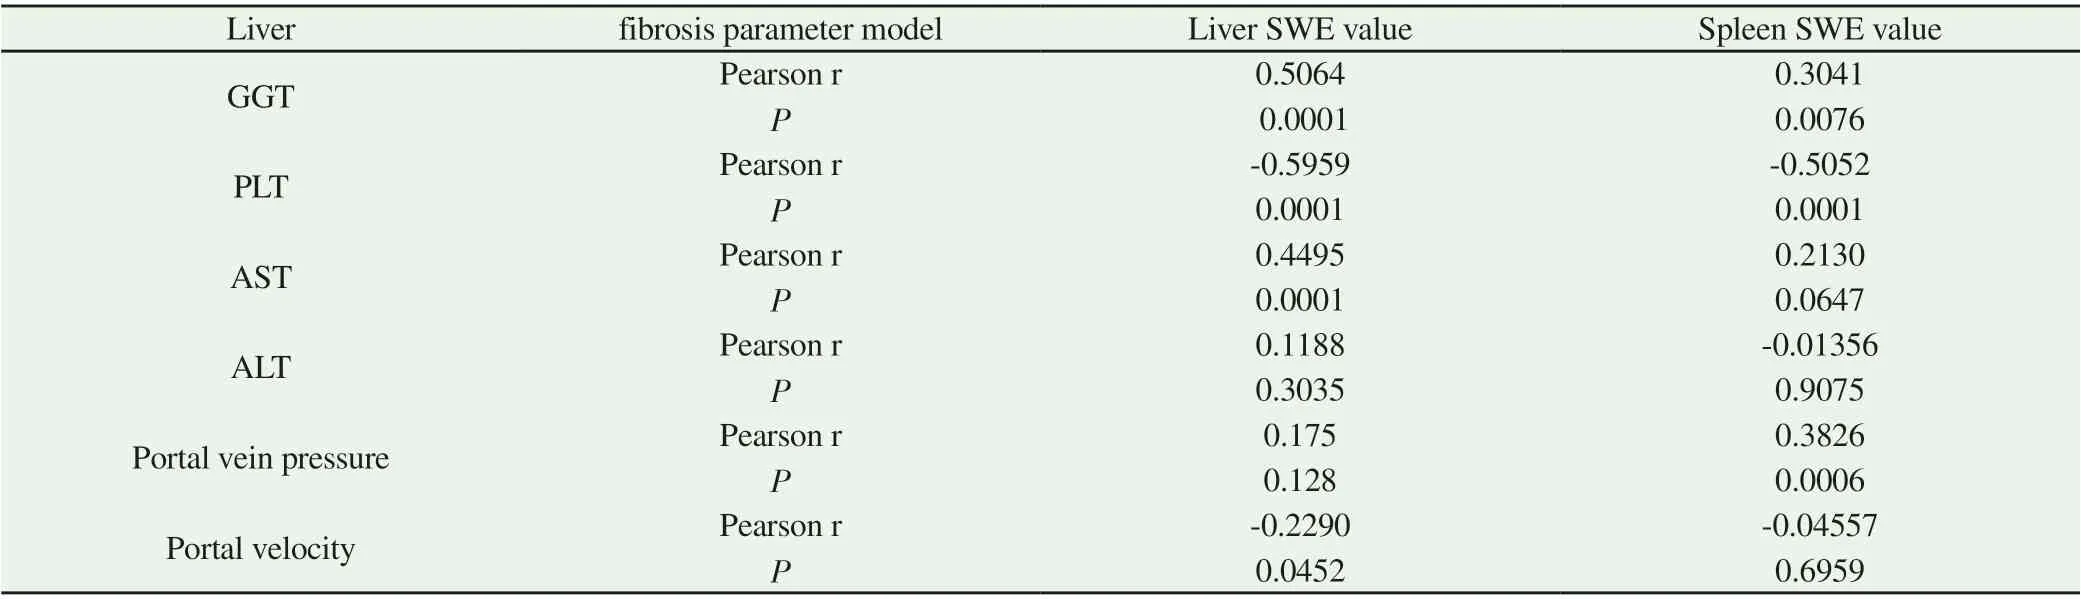
Table 4 Correlation analysis between liver function indexes and liver and spleen SWE values
3. Results
3.1 Comparison of liver and spleen SWE between two groups of patients
The spleen SWE of the study group was higher than that of the normal group, and the difference was statistically significant (P <0.01), suggesting that the SWE value of the spleen was consistent with liver stiffness.
3.2 Comparison of liver function indexes between two groups of patients
The differences in serum GGT, PLT, AST, and portal flow rate between the two groups of patients were statistically significant (P <0.01), but there were no differences in ALT and portal vein pressure (P > 0.05).
3.3 Comparison of liver fibrosis parameter model indexes between two groups of patients
The FIB-4, APRI, and GPR models can be used to predict the degree of liver fibrosis in patients with CHB. The FIB-4, APRI, and GPR models in the study group were higher than the normal group, and the differences were statistically significant (P <0.01).
3.4 Correlation analysis between liver function indexes and liver and spleen SWE values
There was a correlation between GGT, PLT and liver and spleen SWE values, which were statistically significant (P <0.01), and ALT had no significant correlation with both (P> 0.05).
3.5 Correlation analysis between liver fibrosis parameter model index and liver and spleen SWE value
Pearson correlation analysis revealed that liver SWE and spleen SWE were positively correlated with FIB-4, APRI, and GPR, and the differences were significant (P <0.01), with a higher GPR correlation.
4. Discussion
The development of the course of CHB patients mainly includes liver fibrosis, cirrhosis, and liver cancer. The latter two stages are irreversible. Therefore, early diagnosis of liver fibrosis in CHB patients, effective assessment of the risk of liver cancer in CHB patients, and guidance for early clinical intervention [11] . Liver biopsy has traditionally been considered the gold standard for diagnosing and assessing the degree of liver fibrosis, but it also has many shortcomings: ① invasive and difficult to repeatedly operate; ② patients with high aminotransferase or bilirubin or elderly patients with physical deficiencies Feasibility of operation is low; ③ There are complications such as infection and bleeding [12].
As a non-invasive detection method for CHB liver fibrosis serological markers, a recent study found that GGT is a good predictive marker of liver fibrosis. GGT / PLT is significantly more valuable in predicting fibrosis or liver cirrhosis than ALT, AST [13]. This study found that serum GGT levels increased with increasing liver stiffness, while PLT levels decreased. GGT and PLT were significantly correlated with liver and spleen SWE values. GGT can reflect the damage of liver cells. In addition, patients with early liver cirrhosis will also have thrombocytopenia. With the high requirements of CHB patients for the quality of treatment, the demand for non-invasive diagnosis is also increasing. The use of liver fibrosis parameter models for non-invasive evaluation of liver fibrosis in HBV patients has been widely used clinically. The areas under the curve predicted by APRI for liver fibrosis and cirrhosis are 0.89 and 0.94, respectively. In addition, the model contains only two calculation indicators (AST and PLT), which is simple and easy for clinical operation. In 2015, Lemoine et al. Proposed a new serum diagnostic model of GPR liver fibrosis. Compared with APRI and Fib-4 for diagnosis of liver fibrosis and cirrhosis in CHB patients, GPR in West Africa and Senegal have better diagnostic accuracy. However, there is no significant difference between the three in France, but the accuracy of its diagnosis varies regionally [14]. The results of this study indicate that FIB-4, APRI, and GPR models can be used to predict the degree of liver fibrosis in patients with CHB. Pearson correlation analysis found that liver SWE and spleen SWE are positively correlated with FIB-4, APRI, and GPR. And the difference was significant (P <0.01), and the GPR correlation was higher. Domestic studies have shown that the specificity of diagnosing significant liver fibrosis is 95.42% when GPR = 2.49, the specificity of diagnosing significant liver fibrosis is 95.42% when APRI = 2.64, and diagnosing significant liver fibrosis when FIB-4 = 5.16 Its specificity is 95.42%, which has certain clinical diagnostic reference value [14].
SWE technology is the latest development of a popular ultrasound technology. It uses ultrasound to detect this reaction force, and uses high-speed computer image and signal processing technology to image or digitize the corresponding changes generated inside the tissue. [15]. At present, 2D-SWE has been used at home and abroad as one of the routine methods for the examination and follow-up of patients with chronic hepatitis B. The results of this study indicate that the higher the liver SWE value, the higher the spleen SWE value. Therefore, measuring the spleen SWE value can also reflect the degree of fibrosis in patients. The advantage of spleen SWE detection is that it is not affected by factors such as inflammatory response of liver tissue [16]. Quantifying and monitoring changes in spleen stiffness can more accurately reflect the malignant degree of liver fibrosis. Wei Yutong et al. [17] tested the spleen SWE value in patients with liver cirrhosis and found that it has a certain correlation with the degree of varices of the esophagus and gastric fundus veins. It can be seen that the spleen SWE value detection has significant advantages and feasibility in clinical application.
In comparison with liver fibrosis index, liver biopsy pathology, APRI, FIB-4 score, FORN index and other methods, SWE technology is better than liver fibrosis index in evaluating liver fibrosis [18, 19]. In this study, Pearson analysis was used to analyze the significant correlation between liver and spleen SWE values, GGT, and PLT, and GPR was the highest in liver fibrosis parameter models. Therefore, SWE technology combined with liver fibrosis parameter model (GPR) may greatly improve the accuracy and severity of liver fibrosis in CHB patients.
 Journal of Hainan Medical College2020年9期
- Journal of Hainan Medical College的其它文章
- Effect of aripiprazole and olanzapine on the cognitive function in patients with schizophrenia
- Mid-term follow-up of one-stage posterior debridement, intertransverse process bone grafting and screw-rod system fixation for Brucella spondylitis of the lumbar spine
- Effects of virtual reality balance games combined with muscle strength training on balance function and motor ability of Parkinson's patients
- Analysis of treatment strategies of traditional Chinese medicine for COVID-19 in tropical regions based on the pathogens of dampness and heat
- Survey and analysis of anxiety of 804 residents in Hainan during the COVID-19 epidemic
- Epidemiological characteristics of 168 cases of COVID-19 in Hainan Island, tropical China: A descriptive study