Investigation of open channel flow with unsubmerged rigid vegetation by the lattice Boltzmann method*
He-fang Jing,Yin-juan Cai,Wei-hong Wang,Yakun Guo,Chun-guang Li,,Yu-chuan Bai
1.State Key Laboratory of Hydraulic Engineering Simulation and Safety,Tianjin University,Tianjin 300350,China
2.Key Laboratory of Intelligent Information and Big Data Processing of Ningxia Province,Yinchuan 750021,China
3.School of Civil Engineering, North Minzu University,Yinchuan 750021,China
4.Faculty of Engineering and Informatics,University of Bradford, Bradford,UK
Abstract:The aquatic vegetation can significantly affect theflow structure, thesediment transport,the bed scour and the water quality in rivers,lakes,reservoirs and open channels.In this study,the lattice Boltzmann method (LBM)is applied in the two-dimensional numerical simulation of the flow structure in a flume with rigid vegetation.A multi-relaxation time model is applied to improve the stability of the numerical scheme for flows with a high Reynolds number.The vegetation induced drag force is added in the lattice Boltzmann equation model in order to improve the simulation accuracy and an algorithm of the multi-relaxation time is developed.Numerical simulations are performed for a wide range of flow and vegetation conditions and are validated by comparing with the laboratory experiments.Analysis of the simulated and experimentally measured flow fields shows that the numerical simulation can satisfactorily reproduce the laboratory experiments,indicating that the proposed lattice Boltzmann model enjoys a high ac c uracy for simulating the flow-vegetation interaction in open channels.
Key words:Lattice Boltzmann method (LBM),multi-relaxation time model,aquatic vegetation,drag force,open channel flow
Introduction
The aquatic vegetation is one of the important components in the water flow system in natural rivers,lakes,reservoirs and open channels and can significantly affect not only the flow structure,but also the sediment transport,the bed deformation,the navigation, the stability of banks and the flood control equipment[1].Due to the practical environmental and engineering importance,extensive studies were carried out for the flow-vegetation interaction and its effect on the flow system by using the laboratory experiments,the numerical simulations and occasionally the field observations[2-3].In general,comparing with the numerical simulations and the laboratory experiments,the field measurements are more difficult due to the limitations of the related instrumentations,the field conditions and the cost. In past decades,the laboratory experiment serves one of the main tools to investigate the flow-vegetation interaction.The drag force induced by the vegetation was an important concern.Carollo et al.[2]measured the local flow velocities for different vegetation densities,flow discharges,and flume bed slopes using 2-D acoustic Doppler velocimeter (ADV).Based on their experiment measurements and theΠ-theorem analysis,Li et al.[3]measured the local flow velocities for different vegetation densities using 3-D ADV.Shan et al.[4]analyzed the flow direction along meandering compound channels.Wilson et al.[5]investigated the flow structure in the open channel flow for various submerged flexible vegetations.Ricardo et al.[6]calculated the time and space averaged flow variables in a flume with non-uniform emergent vegetation from the instantaneous velocity maps measured by using the particle image velocimeter(PIV).Liu et al.[7]investigated the flow features in a meandering compound channel with grass on the floodplain.Song et al.[8]conducted experimental study of open channel flows with submerged rigid vegetation by employing 3-D laser Doppler velocimeter (LDV).More laboratory experimental studies of the flow vegetation interaction can be found in the recent excellent review of Nepf[9].
With the rapid development of the computer technology and the computational fluid dynamics techniques,various numerical models were developed to simulate the flow characteristics in rivers and open channels.Guo et al.[10]investigated the effect of the bed roughness on the flow structure in an open channel using a 2-D numerical model.Jing et al.[11]applied a 2-D flow turbulence model to investigate the characteristics of the water flow in meandering compound channels.Coupled with the sediment transport model,they simulated the hydrodynamics and the sediment transport in the upper meandering reach of the Yellow River[12].Huai et al.[13]proposed a random displacement model (RDM)to predict the concentration of suspended sediment in vegetated steady open channel flow. Huai et al.[14]evaluated the effect of the turbulent structure on the momentum transfer across the outer line of the emergent vegetation patch by using the large eddy simulation(LES).Marsooli and Wu[15]examined the wave attenuation due to the vegetation using a 3-D Reynolds-averaged Navier-Stokes equations(RANS)model.Kim et al.[16]computed the flow through rigid,emergent cylinders and the bed morphdynamics by employing a 3-D LESapproach.
Though many flow features in a vegetated open channel or river flow were revealed by these studies,the complicated boundary condition of the flows in vegetated rivers or open channels still poses challenges and makes the accurate simulation very difficult on the macro level.The lattice Boltzmann method(LBM),a mesoscopic method has a great advantage to treat complex boundary conditionsand is suitable for describing the internal interactions among the fluid particles and those between the fluid and the external environment[17].As a result, the LBM was widely used to simulate various complicated flow phenomena, such asthe multiphase flows, the flows in porous media,the quasi Newtonian fluid and the chemical reaction flow[18].
In recent years,the LBM began to be applied to simulate open channel flows with vegetation.Yang et al.[19]developed a 2-D LBM with a D2Q9 lattice arrangement to simulate the flow-vegetation interactions in an open channel.Buxon studied the fluid dynamics of the acid mine drainage flow using a lattice Boltzmann model with a D2Q9 lattice arrangement[20].
In this study,the LBM is applied to simulate the flow structure in a laboratory flume with rigid vegetation for a range of flow conditions and vegetation arrangements.The multi-relaxation time LBM (MRT-LBE)model is proposed as well as a specific numerical algorithm,to treat the instability of the single-relaxation time(SRT)model for flows with a large Reynolds number.To improve the simulation accuracy,the drag force induced by vegetation is considered in the model to take into account of the effect of vegetation on the flow field.Accompanied laboratory experiments are carried out in a flume with vegetation to validate the numerical simulation.3-D LDV is used to measure theflow velocity field.
1.Mathematical model and numerical algorithm
The Boltzmann equation describesthe spatial and temporal distributions of the particle velocities and is a very complex integral differential equation, which is difficult to obtain its analytic solutions[21]and has to be solved numerically.The LBM is the spatial,temporal,and velocity space discretized form of the Boltzmann equation,and consistsof threecomponents:the evolution equation of the distribution function,the discrete velocity model and the equilibrium distribution function.In addition,the boundary conditionshave to be specified to solvethe equations.
1.1 Theevolution equation of distribution function
The evolution equation of the particle distribution function is the lattice Boltzmann equation (LBE)and can be written as[21]

where wiis the weight coefficient, ρ is the fluid density, u is the macro fluid velocity and csis the grid sound speed.
1.2 The discrete velocity model
Among the LBGK models, the widely used one is the DnQb models developed by Qian et al.[24],where n is the space dimension, b is the number of discrete velocities. In this study, the D2Q9 model is used, where the discrete velocity vectors are organized as in the following matrix In the model, the grid sound speed and the weight factors for the corresponding distribution functions are taken as follows:


The discrete velocities and their weight factors in the D2Q9 model are shown in Fig. 1.

Fig. 1 The discrete velocities and their weight factors in the D2Q9 model
1.3 The MRT-LBE model
In the LBGK model, the collision operator is linearized and the computational process for the LBE is simplified. However, the application of the LBGK model is limited because only a single relaxation time is used. d’Humeriers proposed a generalized LBE(GLBE) model, named the multiple-relaxation-time lattice Boltzmann equation (MRT-LBE) model[21]:


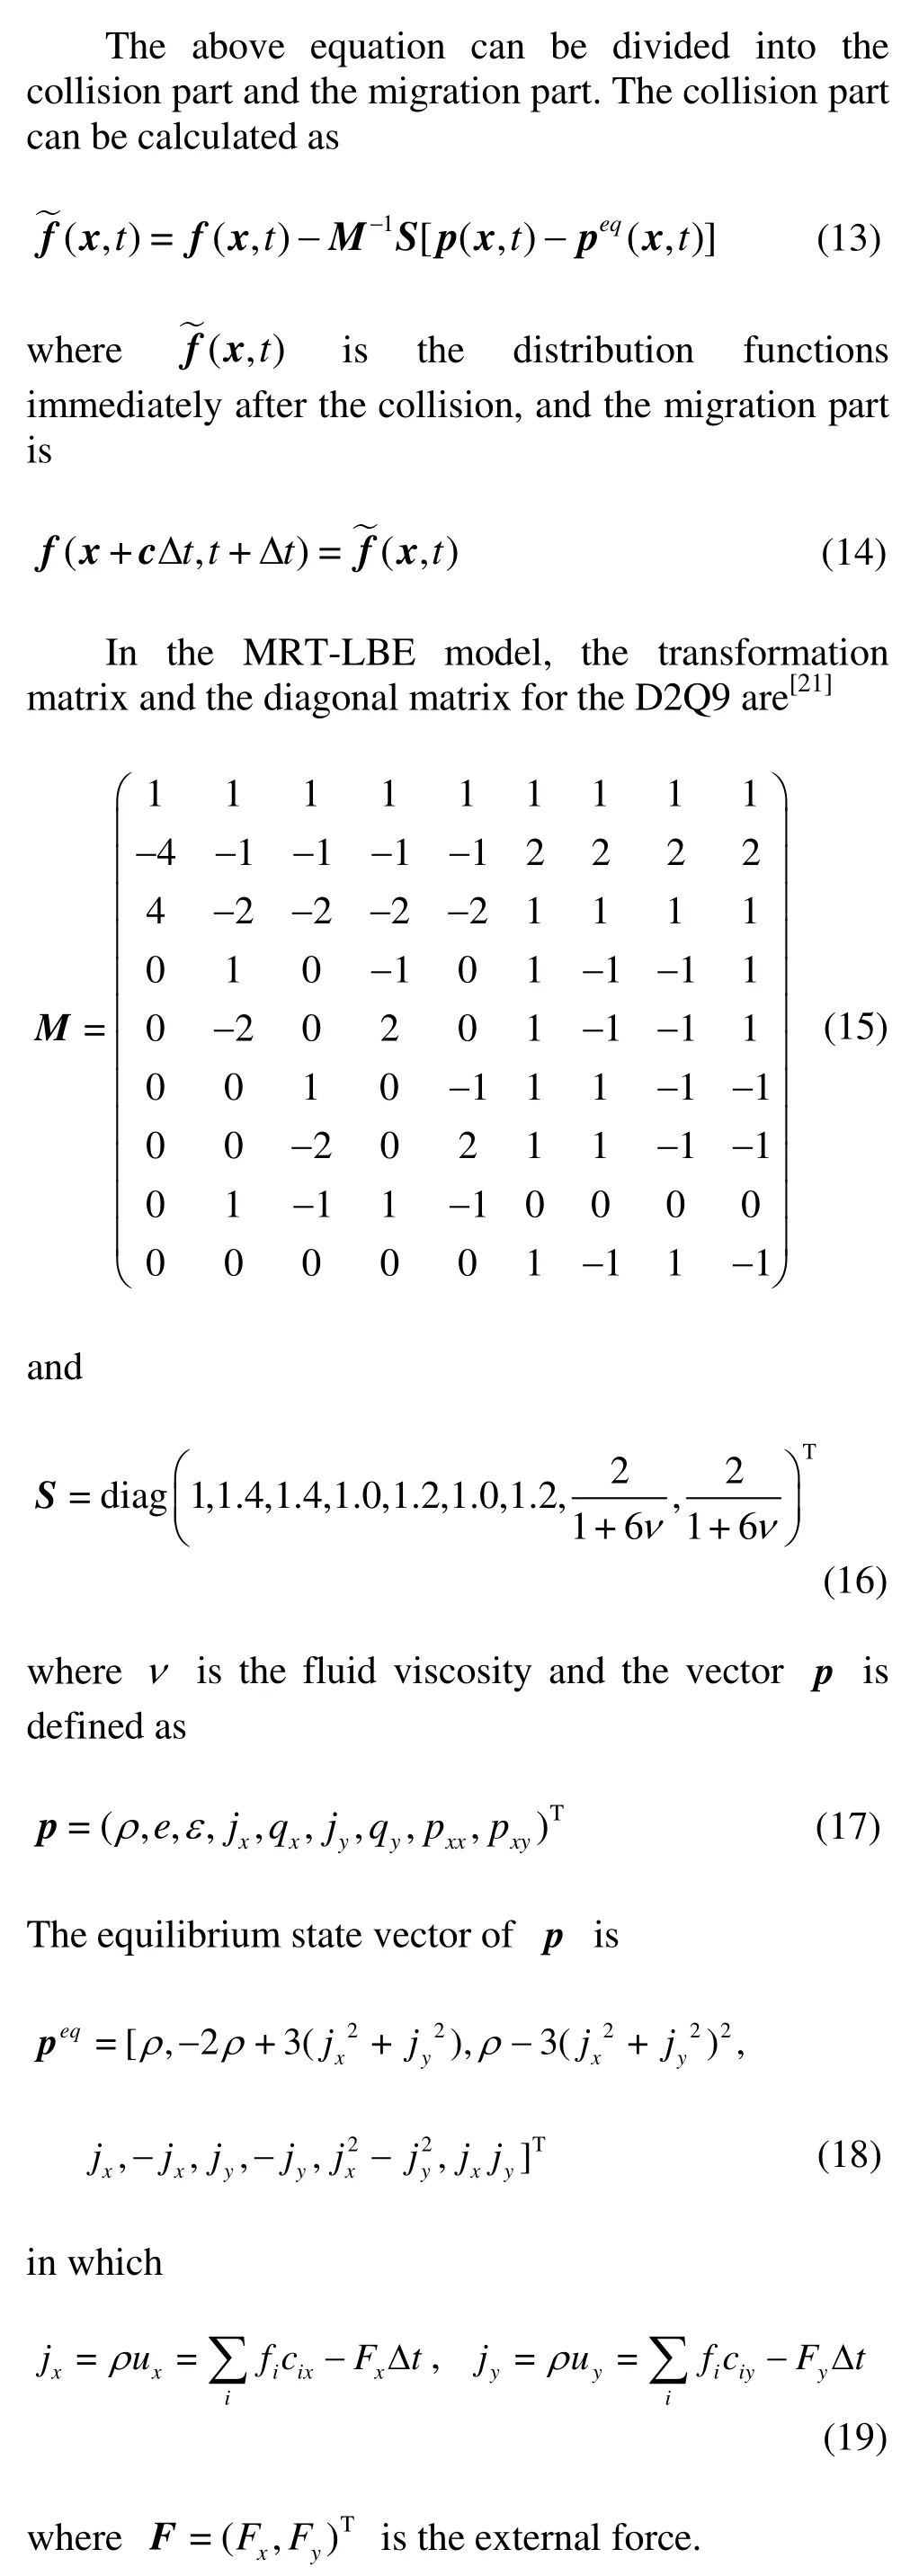
The collision part calculation for the MRT-LBE in the velocity space is difficult, and this part needs to be transformed. Let S be a diagonal matrix and the relationship between S and Λ is as follows

where M is called the transformation matrix.Equation (5) can then be rewritten in the vector form as follows
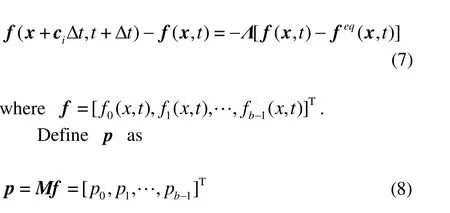
The following equation can be obtained by pre-multiplying the matrix M to both sides of Eq.(7)

Therefore, the component version of Eq. (9) can be written as:

As such, p can be calculated in similar steps as those for the LBGK model, and f can then be calculated through the following transformation

For the convenience of the numerical simulation,pre-multiplying Eq. (9) with M-1yields

1.4 Thedrag forceof vegetation
The drag force induced by the aquatic vegetation has a great impact on the water flow.Therefore,it is important to consider the aquatic vegetation induced drag force in the mathematical model.In this study,the vegetation-induced drag force is considered in the MRT-LBE model,and based on the research result in Ref.[25],the drag force of the vegetation in the two dimensional MRT-LBE model (D2Q9)can be estimated as


1.5 Boundary conditions
The laboratory flume and the vegetation group are symmetric about the center line of the flume.Therefore,in order to save the simulation time,only the flow region from the left wall to the center line of the flume is simulated in the numerical computation.As a result,the symmetric boundary condition is adopted at the center line,asshown in Fig.2.
If the simulated area is from the south wall to the center line,then the unknown distribution functions(4f ,7f and8f )at the center line can be calculated asfollows:

Fig.2 Thesymmetry boundary condition of D2Q9

wherewu is the velocity at the inlet,and it is given in a parabolic distribution along the cross-section

in whichmaxu is the maximum velocity at the inlet,B is the width of the channel and y is the transverse distance from the left bank of the channel.
At the outlet boundary (east), the following full development boundary condition isused:

At the solid wall boundary (the south boundaries and the vegetation), the bounce back boundary condition is applied[21],as shown in Fig.3.For example,at the south wall,the unknown distribution functionsf5,f2,f6can be obtained asf5=f7,f2=f4,f6=f8, in which f7,f4,f8at the node(1,1)can be calculated by migrating the neighbor nodes,i.e.

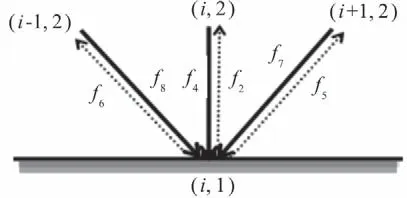
Fig.3 Thebound back condition at south wall
1.6 The algorithm of MRT-LBE with drag force induced by vegetation
It is important to develop an algorithm for the MRT-LBE model with consideration of the influence of the vegetation-induced drag force on the flow structure in order to improve the accuracy of the numerical simulation.The algorithm for the MRT-LBE model with the drag force induced by vegetation can bedescribed as follows:
Step 1 Mesh generation
As the computational domain is rectangular,the square grids are used to divide the domain and the spatial and computational time steps are set to be unity(=1).
Step 2 Initial conditions
The initial velocities,density and distribution functionsare specified asfollows:
Velocitiesat x and y directions( uxand uy)are set to be zero at all grids except for the inlet grids;the initial density(ρ = 1)is set to be 1,the initial distribution function is set asfi=wiρ ,i=0,1, …, b-1,wherewiis the weighting factor along the i-th direction.
Step 3 Calculation of peq( x, t)and p ( x , t)
peq( x, t)can be calculated from Eq.(18)and p ( x, t) is obtained from Eq.(8).
Step 4 Collision step
The distribution function after the collision(( x, t))iscalculated from Eq.(13).
Step 5 Migration step
The distribution function of the next time step f ( x +c Δt , t + Δt )is calculated from Eq.(14).
Step 6 Boundary conditions
At the inlet,wu andwv are specified,wρ and the unknown distribution functions are calculated from Eqs.(23)-(26).At the outlet,the full development boundary condition is used,and the unknown distribution functions can be calculated from Eq.(28).At the solid wall(the solid boundary of the flume and the vegetation),the bounce back boundary condition is applied.At the center line of the flume,the symmetry boundary condition is adopted and the unknown distribution functions can be computed from Eq.(22).
Step 7 Calculation of macroscopic physical quantities
After the distribution functions are obtained,the macroscopic physical quantities can be calculated as follows:

Steps 3-7 are repeated until a prescribed time is reached.
2.Description of experiment and numerical simulation
2.1 Description of laboratory experiment
In order to validate the numerically simulated results,physical laboratory experiments are carried out by using a flume,which is 15.00 m in length,0.49 m in width and 0.50 m in depth.The 3D LDV is used to measure the flow velocity field.Glass rods of three different diameters of =D 10 mm,8 mm and 6 mm and the height of 0.50 m are used to simulate the unsubmerged vegetation in experiments.Because the flow characteristics of vegetation of glass rods of different diameters is similar,only the measured results for the rod diameter of 10 mm are presented and discussed in thispaper.
Four typical cases are chosen in the experiments with different vegetation arrangements,as listed in Table 1.The glass rods are set sparsely and staggeringly in case 1,they are set densely and staggeringly in case 2,they are set sparsely and parallel in case 3,and they are set densely and parallel in case 4.The flow Reynolds number and the vegetation Reynoldsnumber are defined asfollows


whereinU andinR are the averaged flow velocity and the hydraulic radius at the flow inlet,respectively,νis the water viscosity coefficient.The water flow discharge is kept to be 0.054 m3/sin all four cases.
The first row of the glass rods is installed 8.48 m from the inlet of the flume.The row and column numbers of the rods for dense conditions are 11 and 13,respectively,while for sparse conditions,they are 5 and 7,respectively.Both the longitudinal and transverse distances between two neighbor rods are 81.7 mm in cases 1,3,and 40.8 mm in cases 2,4.The length of the vegetation area is 0.49 m in all four cases.The positionsof the glassrodsare shown in Fig.4.
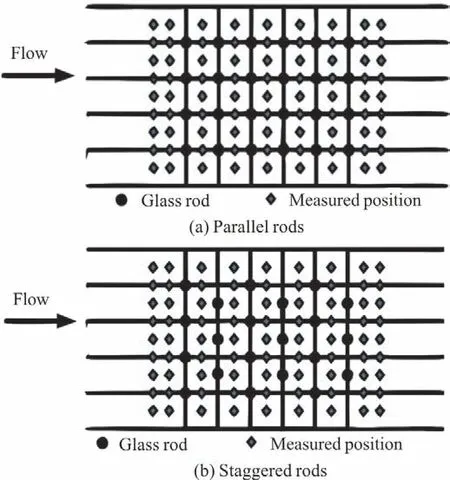
Fig.4 Sketch of the rods and measured positions
Several cross sections are chosen as the measurement sections,as shown in Fig.4.In particular,a cross-section between two columns of rods is set as a measurement section to investigate the flow structures within the vegetation.In addition,the flow structures are measured at two cross-sections upstream and downstream the vegetation area.Along the vertical direction,the measurements are taken every 10mm from the flume bed to the water surface.

Table 1 Basic conditions of the four typical cases
2.2 Description of the simulated area and mesh generation
It would be expensive and unnecessary to set the whole flume as the computational domain.As one is only interested in the flow characteristics around the vegetation patch,a region of 1.53 m×0.49 m,covering the vegetation patch is chosen as the computational domain.The domain is 8.48 m from the inlet of the flume.The vegetation patch is0.49 m long and 0.49 m wide,asshown in Fig.5.

Fig.5 Sketch of simulated area and vegetation area in the laboratory flume (m)
The simulated area is a rectangle of 1.53 m long(in the-x direction)and 0.49 m wide (in the -y direction).Because the flume and the flow condition are symmetrical along the -y direction,only a half of the area is used in the numerical simulation.So the actual simulated area is 1.53 m long in the -x direction and 0.25 m wide in the -y direction.
1 200 grids and 192 grids are assigned along the x -and y -directions,respectively.There are 1200 ×192=230 400grid cells in the whole simulated area.Each of the glass rods are covered by 7.8 grids along both thex -and y -directions,as shown in Fig.6.

Fig.6 (Color online)The mesh around a typical glass rod
3.Resultsand discussions
3.1 Evaluation of numerical convergence

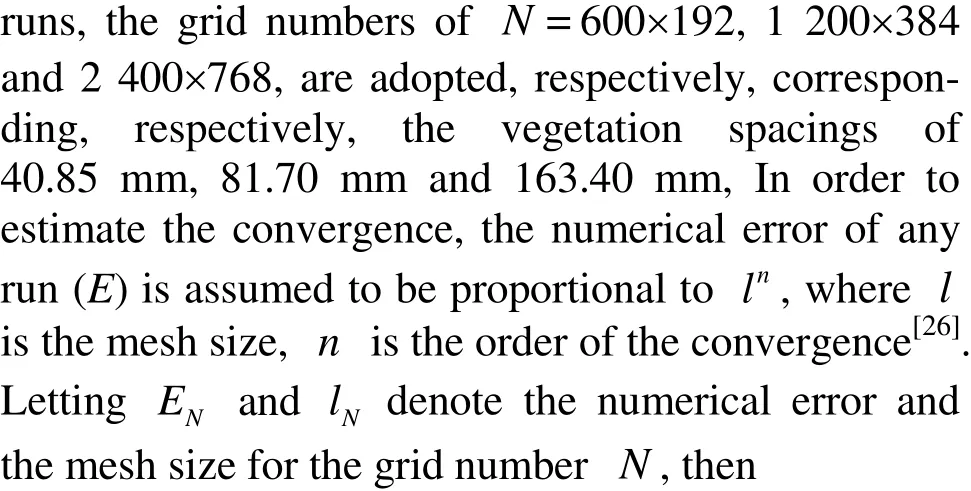

An averaged value of the left hand side of above formula is3.3.Therefore,the order of convergence for the numerical method isabout 1.7.
3.2 Comparison between simulated and measured data
Before the simulation using the LBM,all physical variables are usually transformed into non-dimensional form (lattice units).Let ρP,LP,WP,DP,UP,ReP,νP,FPand ρL,LL,WL,DL,UL,ReL,νL,FLbe the density of the water,the length of the flume,the width of the flume,the diameter of the rods,the flow velocity,the Reynolds number,the fluid kinematic viscosity and the drag force of the vegetation in the physical area and the computational domain,respectively,then these variablesmust satisfy the following relationships:
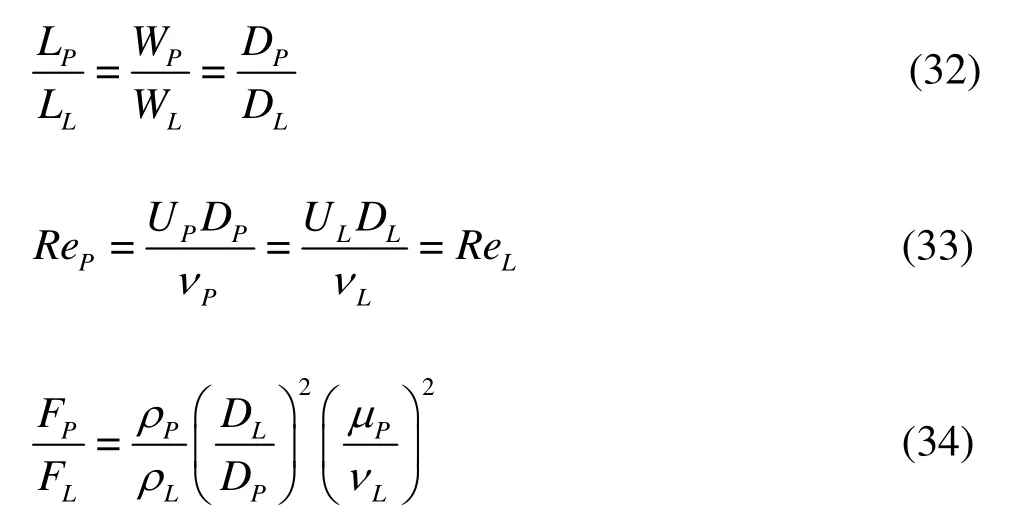
Equations(32),(33)give the non-dimensional form of the basic parameters in the computational domain,which are calculated,asshown in Table 2.

Table 2 Basic parameters in non-dimensional form
For the convenience of comparison,the dimensional basic parameters are also presented in Table 3.
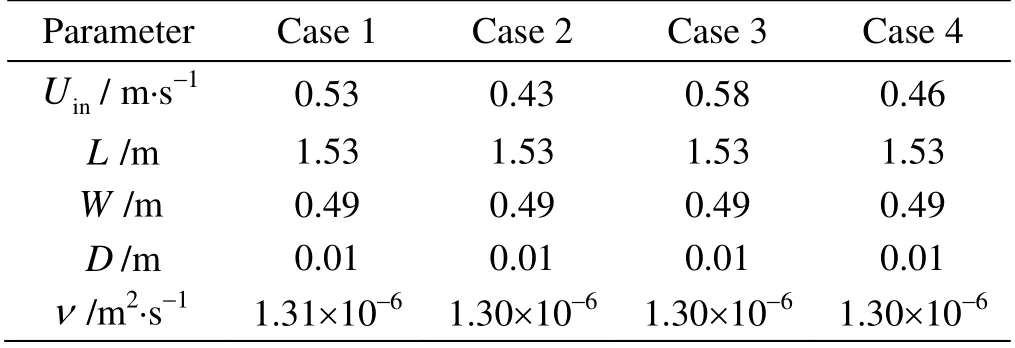
Table 3 Basic parameters in dimensional form
In order to investigate the effect of the vegetation on the flow structure,two simulations are performed with one considering the vegetation-induced drag force and another without consideringthedrag force generated by the vegetation.For a convenient comparison,the measured velocity is converted into the non-dimension form as shown in Fig.7.
Three cross sections(3 lines perpendicular to the banks of the channel)at the middle of two adjacent columns of the vegetation are chosen for comparison.The distances of these sections from the inlet are 347,443 and 539,respectively.
Figure 7 shows that the simulated flow velocity decreases when the drag force generated by the vegetation is considered.It is seen that the simulated velocity with the vegetation-induced drag force agrees well with the laboratory measurements,while there exists some discrepancy between the simulation and the measurement when the drag force generated by the vegetation is ignored in the numerical model.This indicates that the numerical simulation accuracy can be improved when the vegetation-induced drag force is taken into account.
Figure 7 also shows that the flow velocity field is in an indented distribution.The flow behind the glass rods is held back due to the blockage effect caused by the glass rods.As a result,the flow velocity decreases greatly behind the rods.Meanwhile,the flow velocity between the rodsincreases.A little difference is found between the simulated and measured velocities.In general,the simulated velocity field is in good agreement with the measured one when the vegetationinduced drag forceisconsidered.

Fig.7 Comparison between the simulated and measured velocities

Fig.8 (Color online)Comparison of the flow velocity contour among four typical cases
3.3 Comparison among numerically simulated results
Figure 8 shows the simulated velocity distributions in cases 1-4.It can be found that the velocity distributions largely depend on the arrangement of the rods.In the upstream of the computational domain,i.e.,from the inlet to the first column of the vegetation,the flow velocity is in a parabolic distribution along the transverse direction in all four cases.In the vegetation area,i.e.,from the first column of the rods to the last column of the rods,the velocity distribution is very complicated.The flow velocity becomes smaller near the rods,while it islarger near the middle of two adjacent rows of the rods.When the rods are staggered (cases 1,2),the main stream lines are not

Fig.9 (Color online)Flow velocity field in the vegetation area in four cases
parallel to the channel banks due to the complex blockage effect generated by the staggered rods.However,when the rods are parallel,the main stream lines are approximately parallel to the channel banks.Moreover,it can be found that the velocity between two adjacent rod rows is in a parabolic distribution along the transverse direction.
In the downstream of the vegetation area,i.e.,from the last column of the vegetation to the outlet,when the rods are denser and staggered (case 2),the flow velocity reaches the smallest value and is the most uniform among the four cases.This means that such rod arrangement generates the largest blockage effect and the flow resistance to the water flow.Meanwhile,when the rods are sparse and parallel(case 3),the flow velocity reaches the largest value and is mostly uniform among the four cases,indicating that the smallest flow resistance is generated by such rod array.
Figure 9 is the flow velocity field within the vegetation area in all four cases to clearly show the flow characteristics.It is seen that the flow velocity field is very complex in the vegetation area,especially when the rods are staggered (cases 1,2).The secondary flow circulation is seen to form close to the rod when the water flow passesthe rod.
In order to show the flow field more clearly,the flow field around some typical rods in case 2 is enlarged,asshown in Fig.10.

Fig.10 (Color online)Flow field around some typical rods in case 2
Figure 11 shows the flow streamlines in the four cases.It is seen that one sees an oscillation of the streamlines when the flow passes through the vegetation area.Such a streamline oscillation diminishes and dies out after the flow leaves the vegetation area.In the vegetation area,the streamlines are approximately parallel to the channel banks when the rods are parallel,while the streamlines become very complicated when the rodsare staggered.
In order to show the streamlines more clearly,the streamlines around some typical rods in case 2 are presented in Fig.12.

Fig.11 (Color online)Flow streamlines in four typical cases
Figure 13 shows the flow field in five typical cross sections in cases 1-4 to indicate the effect of different arrangements of the vegetation on the flow structure.Section 1 locates in the place upstream the simulated area ( =118)x ,Sections 2,3 and 4 locate in the middle of two adjacent columns of the vegetation( =x 347,443 and 539,respectively),and Section 5 locates in the place downstream the simulated area( =910)x .

Fig.12 (Color online)Flow streamlines around some typical rods in case 2
It is well known that the velocity distribution along the transverse direction in a channel without vegetation is usually in parabolic forms.However,in a channel with vegetation,the velocity distribution is quite different.Figure 13(a)shows that the flow velocity distribution in the upstream of the vegetation patches is parabolic.It is seen from Fig.13(a)that the averaged velocities in cases 1,3 are larger than those in cases2, 4 in Section 1, indicating that a sparse vegetation arrangement gives smaller flow resistance than that a denser vegetation arrangement does.
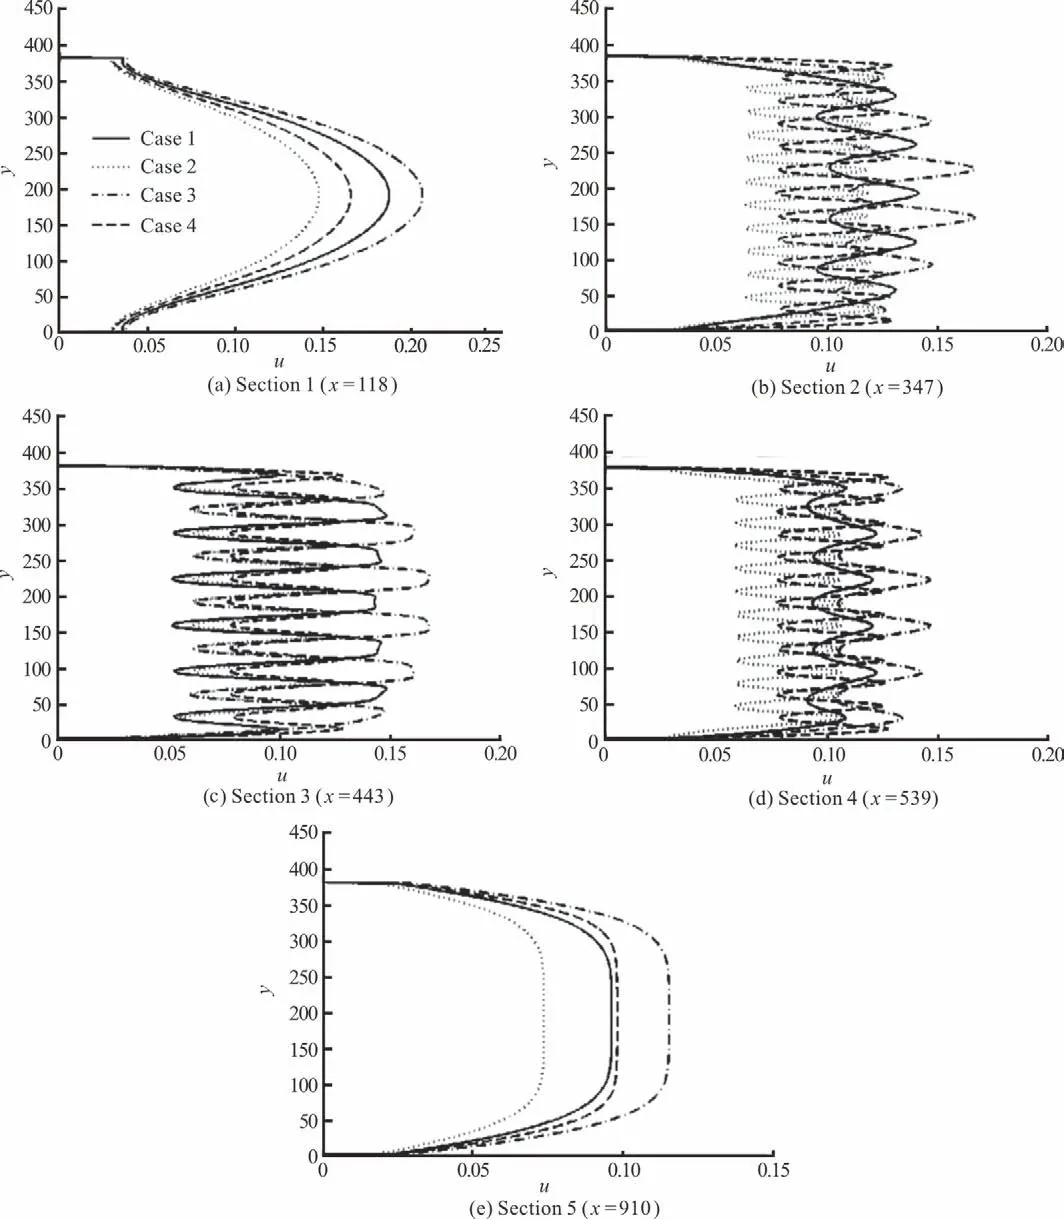
Fig.13 Comparison of the simulated velocities among four typical casesin four typical cross-sections
The velocity distributions in Sections 2-4 are in indented shapes,as shown in Figs.13(b)-13(d).Right behind each glass rod,the flow velocity is smaller due to the blockage effect induced by the rods.However,the velocity is larger at other area because of the narrowing of the wetted cross-section area.It can also be found that the averaged velocities in cases 1,3 are larger than those in cases2,4, respectively.
The flow in Section 5 is still affected by the vegetation-induced drag force.In Fig.13(e),the flow velocity in Section 5 is shown as in a U-shape distribution in all these cases,indicating that the flow velocity is nearly in a uniform distribution along the transverse direction after the flow passes through the vegetation area.The averaged velocity increasesin the order of cases 2,1,4 and 3.This means that the flow resistance is the strongest when the rods are denser and staggered,while the flow resistance isthe weakest when the rods are sparse and parallel.The flow resistance is between the above cases when the rods are in dense and parallel arrangement,or in sparse and staggered arrangement.
3.4 Comparison of drag force in thevegetation area
The drag force of the vegetation plays an important role in the flow field in the vegetation area and can be calculated by using Eq.(20).Because the drag force distributions in the four cases are similar,only the contour lines of the drag force in cases 1,3 are presented in Fig.14.It is seen that the distribution of the drag force in the vegetation area is very complicated.Generally speaking,the drag force near the upstream of the vegetation area is larger than that near the downstream.
4.Conclusions
In this study,the D2Q9 model based on the LBM as well as the numerical algorithm is presented and the 2-D numerical simulation of the flow in an open channel with unsubmerged rigid vegetation is carried out.The MRT-LBE model is applied to improve the stability of the LBGK model for the flow with a high Reynolds number.The vegetation-induced drag force is added in the MRT-LBE model to improve the simulation accuracy.
Based on the analysis of the numerical simulated results,the following conclusionscan be obtained:
(1)Good agreement between the simulated and measured velocity values indicates that the MRT-LBE model is capable of simulating the water flow in open channels with various arrangements of vegetation arrays.

Fig.14 (Color online)The contour lines of drag force in the vegetation area (N/m3)
(2)The flow velocity distribution is parabolic in cross-sections upstream the vegetation patch in open channel and in a U-shaped curve in cross-sections downstream the vegetation patch,indicating that the vegetation can greatly affect the flow structure downstream the vegetation patch to some extent.However,such effect is weaker than that within the vegetation area.
(3)The flow velocity is in an indented distribution in the cross-sections within the vegetation area due to the vegetation-induced drag force.Generally speaking,due to the blockage effect,the flow velocity behind a glass rod is relatively small,while the flow velocity between two adjacent rows is relatively large because of the contraction effect.
(4)The flow velocity within the vegetation area is larger for sparse arrangements of the vegetation than for denser arrangements of the vegetation.Thisis because that the denser vegetation will generate a larger flow resistance than the sparse vegetation under otherwise identical conditions.
(5)Generally speaking,the drag force near the up stream of the vegetation area is larger than that generated near thedownstream.
(6)The numerical convergence is evaluated for the MRT-LBE model.The order of the numerical convergence is found to be about 1.7.
AcknowledgmentsThis work was supported by the Key Project of North Minzu University in China (Grant No.2019KJ25),the Project of Key Research and Development Planned by Science and Technology Department of Ningxia,China (Grant No.2019BEG03048)and the Foreign Expert Project of North Minzu University,China.
- 水动力学研究与进展 B辑的其它文章
- Development and application of a new random walk model to simulate the transport of degradablepollutants*
- Some notes on numerical simulation of the turbulent cavitating flow with a dynamic cubic nonlinear sub-grid scalemodel in OpenFOAM*
- Predictions of bulk velocity for open channel flow through submerged vegetation*
- On solitary wave in nonuniform shear currents *
- Fission law of solitary waves propagating over sharply variable topography *
- A TensorFlow-based new high-performance computational framework for CFD *

