Comparison of immune profiles between hepatocellular carcinoma subtypes
2020-05-19 06:51XueminPanPingLinFangyouminFengJiaLiYuanYuanLiWentaoDaiBoHuXinRongYangJiaFanHongLiYixueLi
Biophysics Reports 2020年1期
Xuemin Pan, Ping Lin, Fangyoumin Feng, Jia Li, Yuan-Yuan Li,Wentao Dai, Bo Hu, Xin-Rong Yang, Jia Fan, Hong Li,Yixue Li,2,3,✉
1 School of Life Sciences and Biotechnology, Shanghai Jiao Tong University, Shanghai 200240, China
2 Bio-Med Big Data Center,Key Laboratory of Computational Biology,CAS-MPG Partner Institute for Computational Biology, Shanghai Institute of Nutrition and Health, Shanghai Institutes for Biological Sciences, University of Chinese Academy of Sciences, Chinese Academy of Sciences, Shanghai 200031, China
3 Collaborative Innovation Center of Genetics and Development, Fudan University, Shanghai 200433, China
4 Shanghai Center for Bioinformation Technology, Shanghai Academy of Science & Technology, Shanghai 201203,China
5 Shanghai Engineering Research Center of Pharmaceutical Translation, Shanghai 201203, China
6 Department of Liver Surgery, Liver Cancer Institute, Zhongshan Hospital, Fudan University; Key Laboratory of Carcinogenesis and Cancer Invasion, Ministry of Education, Shanghai 200032, China
7 School of Life Science and Techonology, ShanghaiTech University, Shanghai 211210, China
8 University of the Chinese Academy of Sciences, Beijing 100049, China
Abstract Immunotherapy, especially immune checkpoint inhibitors, is becoming a promising treatment for hepatocellular carcinoma (HCC). However, the response rate remains limited due to the heterogeneity of HCC samples. Molecular subtypes of HCC vary in genomic background, clinical features, and prognosis.This study aims to compare the immune profiles between HCC subtypes and find subtype-specific immune characteristics that might contribute to the prognosis and potential of immunotherapy. The immune profiles consist of immune-related genes, cytolytic activity, immune pathways, and tumorinfiltrating lymphocytes. HCC-c1 samples showed an overall higher activation level of immune genes and pathways, and this pattern was consistent in validation sets. We associated the difference in immune profiles with the activation level of cancer hallmarks and genomic mutations. There was a negative correlation between most of the metabolism pathway and immune-related pathways in HCC samples.CTNNB1/WNT signaling pathway mutation,one of the common mutations in HCC,appears to be associated with the expression of immune genes as well. These results reveal the difference of immune profiles between HCC subtypes and possible reasons and influence,which may also deepen our understanding of the carcinogenesis process.
Keywords Hepatocellular carcinoma, Immune, Tumor-infiltrating lymphocytes, Metabolism, CTNNB1 mutation
INTRODUCTION
Primary liver cancer is one of the most common cancer and the leading cause of cancer-related death worldwide, with a steady increasing incidence and mortality.Worldwide, there are about 841,000 new diagnosed cases and 782,000 deaths annually. Hepatocellular carcinoma (HCC) is the most common type of liver cancer,accounting for 75%-85% of primary liver cancer cases(Bray et al. 2018).
HCC originates from hepatocytes. Hepatocytes constitutes of liver lobules, which is the basic function unit of liver. The risk factors of HCC vary geographically.Common risk factors include hepatitis infection,alcohol abuse, aflatoxin B, and so on (Forner et al. 2018) The development of HCC is closely related to chronic liver disease, with 90% of HCC developed from cirrhosis(Llovet et al. 2016).
Despite metabolism function, liver has critical immune-regulatory functions. Facing amounts of microbial byproducts and antigens from intestine, liver is under an immune-suppressive state in normal physiological conditions, to avoid overreacting to these molecules. While liver is under infection or inflammatory state,liver could also recruit immune cells and activate immune systems rapidly (Guha et al. 2017;Ringelhan et al.2018).The immune-suppressive state of liver is often utilized by cancer cells to avoid immune surveillance.
Early-stage HCC patients could be treated with resection,liver transplantation,or local ablative therapy.For liver transplantation, the limited liver source restricts its application. For other treatments, the recurrence rate remained high because the chronic liver disease is not cured with the cancer(El-Serag 2011).For advanced stage patients,sorafenib has been approved as first-line therapy but just prolong patients’ mean survival time for three months (Llovet et al. 2008). Regorafenib and nivolumab have been approved as secondline therapy with promising efficacy (Bruix et al. 2017;El-Khoueiry et al. 2017) while the response rate is not desirable (~30%) and no definitive predictive biomarkers have been found (Llovet et al. 2018). Nivolumab is anti-PD1 drug, which is one of the immune checkpoints. In recent years, immune checkpoint inhibitors have made great progress in treating several cancer types. The heterogeneity of tumor microenvironment may contribute to the low response rate (Pitt et al. 2016). This study aims to analyze the immune profiles of HCC subtypes and identify subtype-specific immune characteristics that might contribute to the potential of immune therapy and difference in prognosis.
In recent years, the development of sequencing technology enables us to know more about the heterogeneity of HCC, from which we could also extract immune profiles. The immune profiles include the immune-related gene expression, immune-related pathway/gene sets, estimated tumor-infiltrating lymphocytes (TILs) score, and immunogenicity. The tumor immunogenicity could be evaluated with several signatures, including mutation load, neoantigen load, and cancer-germline antigen expression. The response of immune system could be measured with TILs score and cytolytic activity (CYT). In the following, we compared the immune profiles between HCC subtypes, with data from TCGA (the Cancer Genome Atlas). Immune gene expression, pathway activation, and TILs score were obtained from transcriptome data. Mutation and neoantigen information was obtained from previous studies (Charoentong et al. 2017). The study provides an integral comparison of immune profiles between HCC subtypes which might be valuable to clinical application.
RESULT AND DISCUSSION
Difference of immune-related genes by subtype
Transcriptome data, mutation files, and clinical information for HCC samples were downloaded from TCGA with cBioPortal (Cerami et al. 2012; Gao et al. 2013).Based on transcriptome data, TCGA-HCC samples were classified into three classes according to Hoshida’s work(Hoshida et al. 2009) (supplementary Fig. S1). Clinical features differed between three subtypes, as summarized in Table 1. Similar to previous studies (Hoshida et al. 2009), there were less advanced tumor in class 3(c3),higher AFP levels in class 2(c2),and less hepatitis infection samples in class 1 (c1). Both overall survival(OS) and disease-free survival (DFS) differed between subtypes, with c3 better in OS and c2 worse in DFS(Fig. 1C).
Firstly, we paid attention to the expression of 386 immune-related genes. It could be identified that three subtypes showed obvious different expression of these genes (Fig. 1A). In TCGA datasets, HCC-c1 subtype presented an overall higher expression of immunerelated genes. By comparing gene expression values between c1 and other samples with Wilcoxon rank sum test, 229 immune-related genes were identified as upregulated in c1 subtype (FDR <0.1). This pattern could be observed in the three independent validation sets as well (Fig. 1A).
In HCC, CD57+natural killer cells (NK cells) and CD8+T cells mediate the main cytolytic attack to the tumor cells (Ringelhan et al. 2018). Cytolytic activity(CYT), evaluated as the mean expression value of five genes (GZMA, PRF1, CD8A, CD8B, GZMB) (Jiang et al.2018), could be regarded as a measurement ofantitumor effects. HCC-c1 samples showed higher CYT compared with the other two subtypes (Fig. 1B,p value = 1.2 × 10⁻⁸; 9.9 × 10⁻⁹). Previous study has found CYT is associated with better prognosis in some cancer types (Wakiyama et al. 2018). In TCGA-HCC samples, patients with higher CYT had better prognosis in both OS and DFS (Fig. 1D), even after adjusted to stage (OS: p value = 0.026; DFS: p value = 0.0034). The prognostic value of CYT reached agreement with the previous ideas that the immune cells preserved part of the function even in the advanced tumor site (Sanmamed and Chen 2018).
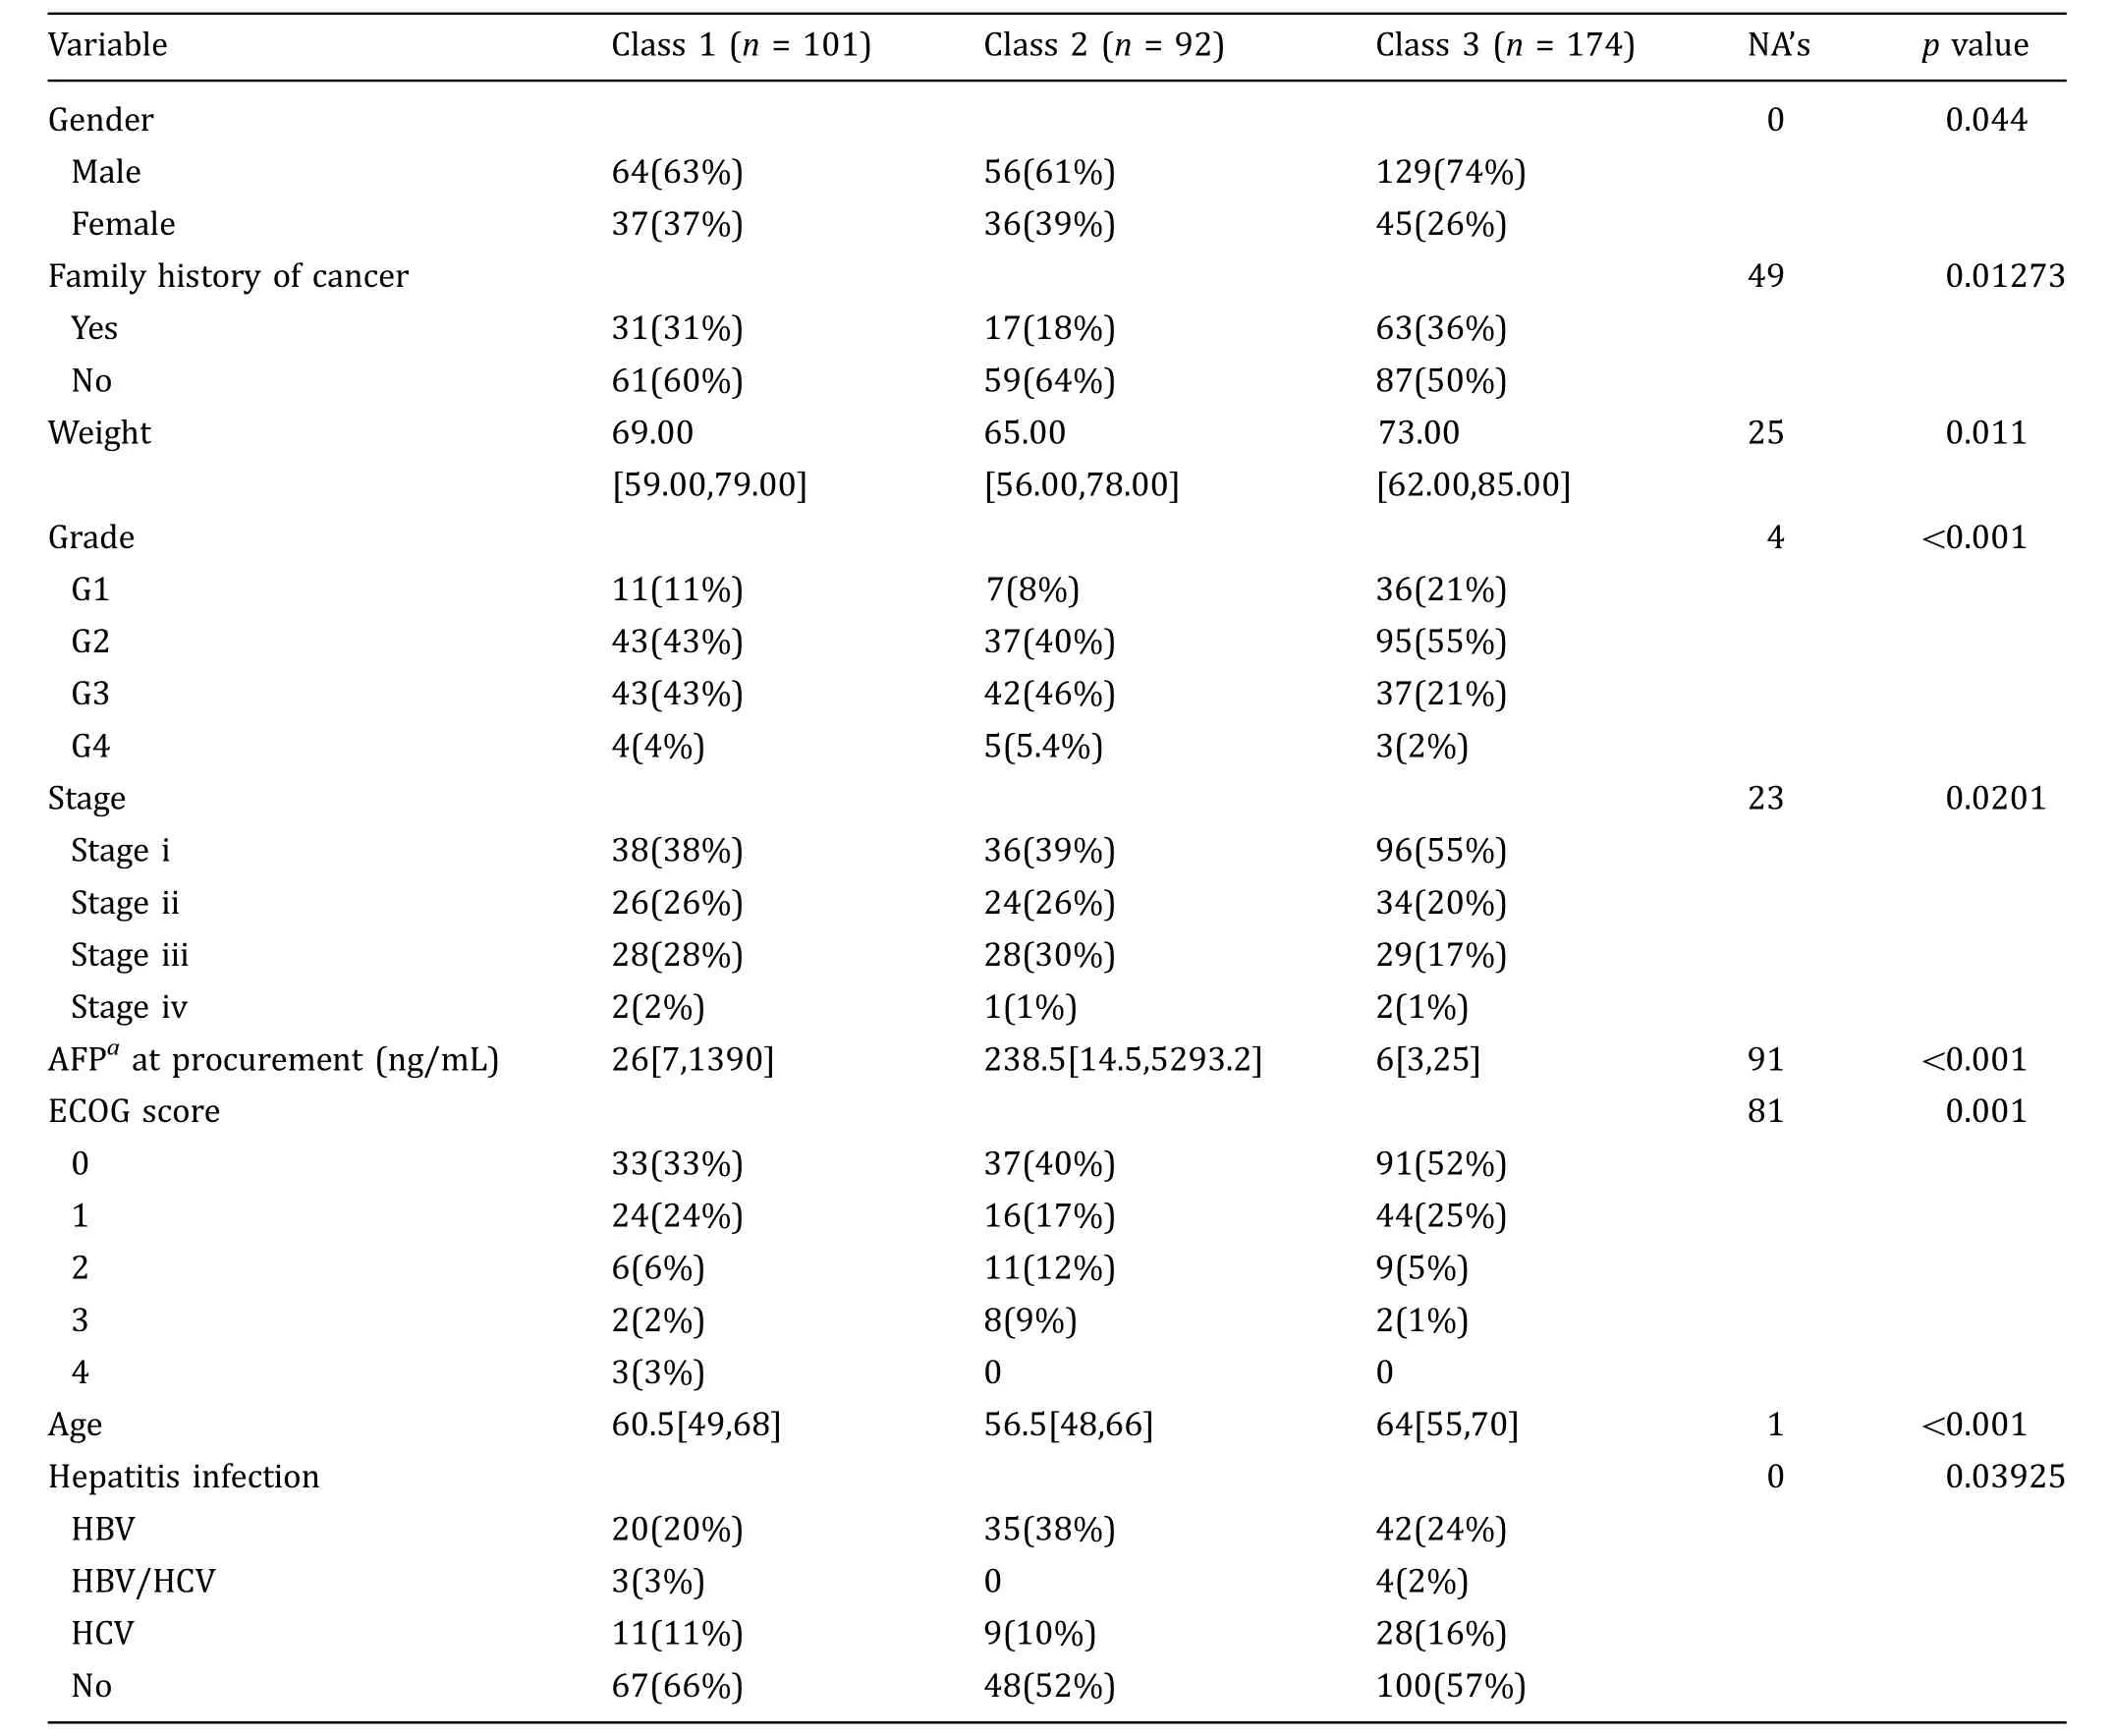
Table 1 Clinical difference between HCC subtypes
Signature genes for each subtype were identified among the 386 immune-related genes. In TCGA-HCC dataset,229 immune-related genes expressed significantly higher in c1 compared with the other two subtypes(Wilcoxon rank sum test, FDR<0.1) while for c2 and c3 samples, 13 and 23 immune-related genes were overexpressed, respectively. Pathway overrepresentation analyses were applied to signature genes for each subtype,and the results are summarized in supplementary Table S1. C1 over-expressed genes were enriched in antigen processing and presentation pathway(hsa04612),T cell receptor signaling pathway (hsa04660), and Th1 and Th2 cell differentiation (hsa04658).
Interferon gamma (IFN-γ) is the signature cytokine for Th1 cells (Rengarajan et al. 2000), which also plays an crucial role in the tumor immune surveillance.Recent studies find that IFN-γ plays dual roles in microenvironment. It could activate antigen presentation, thus enhancing immunogenicity of tumor cells(Saha et al. 2010). In contrast, it also regulates the expression of immune checkpoint genes,such as PD-L1,CTLA4, and IDO1, which may lower immune response by effector T cells (Mojic et al. 2017). In TCGA-HCC samples, the expression of IFN-γ is upregulated in c1(supplementary Fig. S2A)and positively correlated with the expression of PD-L1 (cor = 0.47), CTLA4 (cor =0.71), and CYT (cor = 0.82) and the activation of pathway hsa04612 (cor = 0.73) (supplementary Fig. S2B-2E). After all, the differential expression of IFN-γ between subtypes plays critical role in the difference of immune profiles.
Immune checkpoint inhibitors targeting PD1, PD-L1,and CTLA4 have achieved great success in several cancer types. And the expression of PD-L1 is considered as a potential biomarker for anti-PD1 drugs(Ocker 2018). C1 subtype showed higher expression of all these three genes and it was consistent in most of the validation set except PD-L1 in GSE36376 (Fig. 2).An IFN-γ-related signature gene was used as a potential predictive marker for anti PD-1 drug pembrolizumab (Ayers et al. 2017). The 18 signature genes showed higher expression in c1 samples as well(supplementary Fig. S3). Considering the higher expression of IFN-γ signature genes and PD-L1, the c1 subtype may have the greater potential to benefit from immune checkpoint inhibitors.
For over-expressed genes in c2 and c3 subtypes, we focused on the genes whose corresponding receptors were over-expressed in the same class. For c2 samples,cytokine encoding genes, BMP4, NODAL, and their corresponding receptors, BMPR1A, and ACVR2B were upregulated (supplementary Fig. S4A). For c3 samples,NRG1 and their receptors ERBB2 showed higher expression values(supplementary Fig. S4B).Both BMP4(bone morphogenetic protein 4) and NODAL encode ligand of the TGF-β superfamily.Recent studies revealed that BMP4 could enhance HCC proliferation and metastasis (Ma et al. 2017; Zeng et al. 2017) and is associated with poor prognosis in HCC samples(Guo et al.2012).Over-expression of NODAL is involved in promoting invasive phenotypes of tumor cells in vitro(Duan et al.2015;Quail et al.2014).The over-expression of BMP4 and NODAL might contribute the poorer DFS of c2 samples.
Difference of TILs between subtypes
The tumor-infiltrating lymphocyte (TIL) scores were estimated using CIBERSORT(Newman et al.2015)from transcriptome data. TILs for 22 kinds of immune cells were estimated. It could be observed that in LIHC samples, 14 types of immune cells had different infiltration levels between three subtypes (Fig. 3A). C1 samples had higher infiltration level of macrophage M0,activated CD4+memory T cells, and lower infiltration level of naı¨ve B cell, monocytes, resting mast cells,resting CD4+memory T cells, T follicular helper cells,and regulatory T cells.C2 samples had lower infiltration level of γδT cells. C3 samples had higher infiltration score of macrophage M2, resting dendritic cells, and lower infiltration level of activated dendritic cells.
Among all solid organs in the body, the liver harbors the greatest proportion of macrophages, which are in term the most common infiltration immune cells in liver cancers (Robinson et al. 2016). Tumor-associated liver macrophages may be derived from self-proliferation of Kupffer cells and differentiation of recruiting monocytes. In response to different signals in microenvironment,macrophages are polarized to different status and exert opposite functions.Macrophage M1,activated with IFN-γ, produces proinflammatory cytokines and chemokines. Macrophage M2, activated with IL4 and IL13,produces immune-regulatory cytokines and has phagocytic activity (Sica et al. 2014). In several cancer types,infiltration level of macrophage M1 is associated with better prognosis while macrophage M2 is associated with poor prognosis (Fridman et al. 2017).
From Fig. 3B, it could be observed that the TIL score of macrophage M2 is higher than macrophage M1 in every subtype, indicating a local immune-suppressive microenvironment. As stated above, c1 showed lower infiltration score of monocytes and higher infiltration of macrophage M1,consistent with higher expression level of IFN-γ in c1. C3 showed higher infiltration of macrophage M2, compared with the other two classes. When comparing the main activation signals and expressing cytokines distinguishing M1 and M2 state (Sica et al.2014), it could be found that most of the signature genes for macrophage M1, such as IL1B, TNF, STAT1,and IL6, showed elevated expression in c1. The signature genes for macrophage M2 showed less significant difference between subtypes, among which ARG1 and ARG2 were over-expressed in c3 samples (supplementary Fig. S5). ARG1 could dampen the proliferation of T cells by limiting the availability of arginine (Carambia and Herkel 2018), which may partly contribute to the lower CYT in c3 samples.
Regulatory T cells (Tregs) play an important role in establishing immune-suppressive microenvironment in tumors, impairing the activity of effector T cells. The infiltration of Tregs is associated with poor prognosis in several cancer types, including HCC. In TCGA-HCC samples, we observed that the infiltration of Tregs is associated with poor prognosis as expected (OS: HR =2384; DFS: HR = 391.5). C1 samples show lower infiltration of Tregs than the other two classes,which might partly explain the overall higher activation level of immune genes in c1.
Difference of cancer hallmarks between subtypes
To explore the potential reasons for immune profile difference, we compared the difference of cancer hallmarks between HCC subtypes with ssGSEA(Barbie et al.2009), as described in method. HCC subtypes showed divergent activation levels of cancer hallmarks(Fig. 4A).Consistent with immune-related gene expression pattern, c1 samples were enriched in most of the immunerelated hallmarks, such as IFN-γ response, IL6-JAk-STAT3 signaling. c1 and c2 samples showed higher enrichment scores in cell cycle and MYC hallmarks,such as hallmark G2M checkpoint, E2F targets, and MYC targets.While c3 samples were enriched in metabolismrelated hallmarks, such as fatty acid metabolism and bile acid metabolism,most of which were closely related to the physiological functions of liver. Considering the lower CHILD-Pugh scores in HCC-c3 samples (Table 1),it could be speculated that c3 samples may have better liver function remained, resulting in the enrichment of these metabolism pathways.
We found that the enrichment scores of immune pathways/hallmarks were negatively correlated with the metabolism-related hallmarks, except glycolysis(Fig. 4B). Hallmark glycolysis, different from other metabolism hallmarks, was enriched in c1 samples and positively correlated with immune pathways (Fig. 4B).Transferring from oxidative phosphorylation to glycolysis is one of the important metabolism reprogramming features of tumor cells, termed as ‘‘Warburg effect.’’Recent studies find that during T cell activation, similar metabolism reprogramming feature could be observed(Allison et al. 2017). Since we cannot distinguish metabolism profiles of different cells with bulk tumor sample, the activation of glycolysis may exert complex influence to the tumor microenvironment.
Hallmark bile acid metabolism is enriched in c3 samples and negatively correlated with most of the immune pathways/hallmarks,especially IL-17 signaling pathway (Fig. 4B, C). Similar pattern could be observed in two available validation datasets(Fig. 4C).One of the physiological functions of liver is to secret bile acids,helping fatty acids digestion and absorption. Besides its role in digestion, bile acids also exert immuneregulatory functions,probably through activation of bile acid receptors (Fiorucci et al. 2010). There are two kinds of bile acid receptors in human,G-protein coupled receptors (TRG5), and nuclear receptors (FXR, CAR,PXR, etc.). FXR, also known as NR1H4, is a bile acid receptor on hepatocytes. FXR and TRG5 are expressed on circulating monocytes, macrophages, and Kupffer cells. Activation of both receptors could repress the expression of pro-inflammatory cytokines. Previous study found that treated hepatocytes with hydrophobic bile acids could upregulate the expression of IL-17A(Fiorucci et al. 2018). IL-17 is a subset of cytokines important to inflammatory responses and high expression of IL-17 is related to poor prognosis in HCC samples (Zhang et al. 2014).
Genomic associations with immune-related genes
Genomic background may contribute to the difference of immune profiles as well. In TCGA-HCC samples, 356 samples with the transcriptome data have the mutation files. There were 26 significantly mutated genes. The most frequent mutations were detected in TP53 (111/356), CTNNB1 (96/356), ALB (41/356), APOB (36/356),ARID1A(31/356),AXIN1(23/356),and RB1(20/356). TCGA-HCC subtypes showed no significant difference in mutation load and neoantigen load (supplementary Fig. S6) while the mutation frequency of four genes differed between subtypes. C1 samples have less frequent CTNNB1 mutations and c3 samples have less frequent TP53 mutations. Meanwhile, AXIN1 and RPS6KA3 are more common in c2 samples (Table 2).
CTNNB1 encodes β-catenin, which binds to the product of APC gene. Both CTNNB1 and APC belong to the WNT signaling pathway. The most common mutated genes in WNT signaling pathway in TCGA-HCC include CTNNB1, AMER1 (6/356), AXIN1 (23/356), AXIN2 (6/356), and APC (10/356). If we consider patients had any one of these gene mutations as mutated in WNT signaling pathway, it could be found that frequency of WNT signaling pathway mutation varied between subtypes.In c1 samples,only 13.1%samples had mutations in WNT signaling pathway,while for c2 and c3 samples,mutated samples accounted for 46.6% and 43.8%,respectively.
Gene mutations may influence specific gene or pathway expression as well as immune-related genes.We compared whether gene mutation could significantly influence the expression of immune-related genes out of whole transcriptome. Take CTNNB1 mutation as an example, the expression of 9234 genes was correlated with CTNNB1 mutation (Wilcoxon rank sum test,FDR <0.05), among which 240 is immune-related genes. CTNNB1 influenced more immune-related genes compared with other genes, under Fisher’s exact test(p value = 2.30 × 10¹⁰, Fig. 5A). Besides, ALB, AXIN1 and CTNNB1 mutation as well as WNT signaling pathway mutation could greatly influence the expression of immune-related gene. And most of the immune-related genes were downregulated in the CTNNB1 or WNT pathway-mutated samples (Fig. 5B; supplementary Fig. S7A). In the validation set GSE65485, 9 out of 50tumor samples harbored CTNNB1 mutation and most of the immune-related genes were downregulated in the CTNNB1-mutated samples as well (supplementary Fig. S7B).
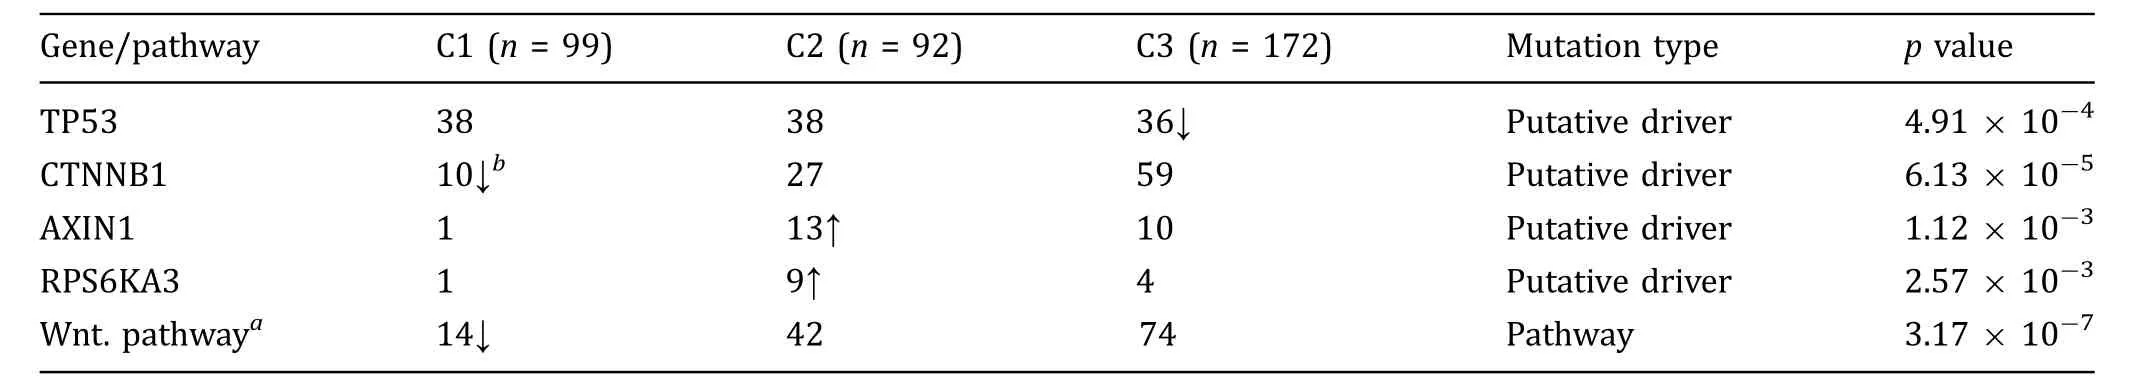
Table 2 Mutation frequency difference between HCC subtypes
We wonder whether the negative correlation between CTNNB1 mutation/WNT pathway mutation and immune-related gene expression exists in other cancer types. According to integrative cancer genomics(IntOGen) (Gonzalez-Perez et al. 2013), CTNNB1 is considered as mutational cancer driver in seven cancer types, including prostate adenocarcinoma (PRAD),hepatocarcinoma, uterine corpus endometrioid carcinoma (UCEC), stomach adenocarcinoma (STAD), colorectal adenocarcinoma (COAD), cutaneous melanoma,and medulloblastoma. Data for the former six types were collected from TCGA. Transcriptome data and mutation files were downloaded from TCGA,and similar analysis was conducted.
Similar results were found in PRAD,STAD,and UCEC.In these three cancer types, CTNNB1 mutation influenced the expression of more immune-related genes than other genes (Fig. 5C). However, the negative correlation was not observed in these three cancer types(supplementary Fig. S7C-E).
Previous research has found that WNT/β-catenin pathway could influence the cancer immunity(Pai et al.2017). These findings, though preliminary, suggest that the genomic background may influence the immune profile.
Discussion
In this study, we compared the immune profiles between HCC subtypes, searching for immune characteristic for each subtype,possible reasons, and impacts.The prognosis for HCC remains poor,and the treatment method is limited. Considering the special immunosuppressive microenvironment of liver and potential for immunotherapy, we expect that the investigation of immune profiles would deepen our understanding of carcinogenesis process and provide clues to clinical application.
C1 subtype showed a consistent higher expression of immune-related genes, CYT as well as immune checkpoints(PD-1,PD-L1,CTLA4)in TCGA data and validation sets. The higher expression of IFN-γ in c1 would increase the antigen presentation pathway meanwhile induce the expression of co-inhibitors. This would probably explain why c1 subtype didn’t show advantages in prognosis with an immune-active state.
The higher expression of PD-1 and IFN-γ proposed that c1 samples are most likely to benefit from immune checkpoint inhibitors. For c2 and c3 samples, there is possible therapy based on upregulated genes or gene mutation,listed in Table 3.ERBB3,over-expressed in c2 samples, could be the target for antibody(Gaborit et al.2016). AXIN1 mutation and RPS6KA3 mutation, with higher frequency in c2 samples, have inhibitors,respectively(Khemlina et al.2017;Schulze et al.2015).EGFR, over-expressed in c3 samples, is the target in other cancer types (Schulze et al. 2015).
For TILs, several immune cells showed different infiltration levels between subtypes, among which macrophage M1 and M2 and Tregs might play important roles in the tumor microenvironment. And the TILs were associated with prognosis as previous studies found. CIBERSORT provides a valuable estimation of TILs, while the different status of immune cells sometimes is hard to perceive. Compared with immunohistochemistry method, the location information is not available.
The difference of immune profiles was probably due to different activation level of cancer hallmarks and genomic background. It was intriguing that there was a negative correlation between most of the metabolism pathways and immune pathways. In recent years, several studies have found metabolism reprogramming is important to the functions of immune cells(Allison et al.2017; Renner et al. 2017; Zhang et al. 2018). While sequencing of bulk tumor samples would not enable us to distinguish expression profiles of different cell types.Single-cell sequencing,if possible,would give us a more precise landscape of metabolism status of different cells in tumor site. However, these results may provide an overall landscape which may need further study.
Genomic background may affect the immune profile.Mutations or neoantigens generated by tumor cells may stimulate immune response. In TCGA-HCC samples,there was no significant difference of mutation/neoantigen load between subtypes. However, we observed an association between CTNNB1/WNT mutation and the expression of immune-related gene in HCC and UCEC, STAD, and PRAD. It proposed a possibility that mutations affect the immune profiles through various ways.
Besides genomic background,HCC is a disease closely related with chronic liver diseases.Different risk factors may result in different carcinogenesis process (Llovet et al. 2016). In TCGA-HCC samples, several risk factors other than hepatitis infection were documented,such as alcohol consumption, non-alcohol fatty liver disease,and hemochromatosis. The frequency of these risk factors didn’t differ between subtypes. It would be interesting to identify the influence of risk factors to the immune profiles but it was not covered in this study.
DATA AND METHODS
Genomic and clinical data
Genomic and clinical data for HCC from the Cancer Genome Atlas (TCGA) were downloaded from cBioPortal, including clinical information (n = 373), RNAsequencing expression profiles(n = 376),and mutation files (n = 366). Overall characteristic of clinical information was listed in supplementary Table S2. Mutationprofiles for 26 recurrently mutated genes identified by MutSig were downloaded.
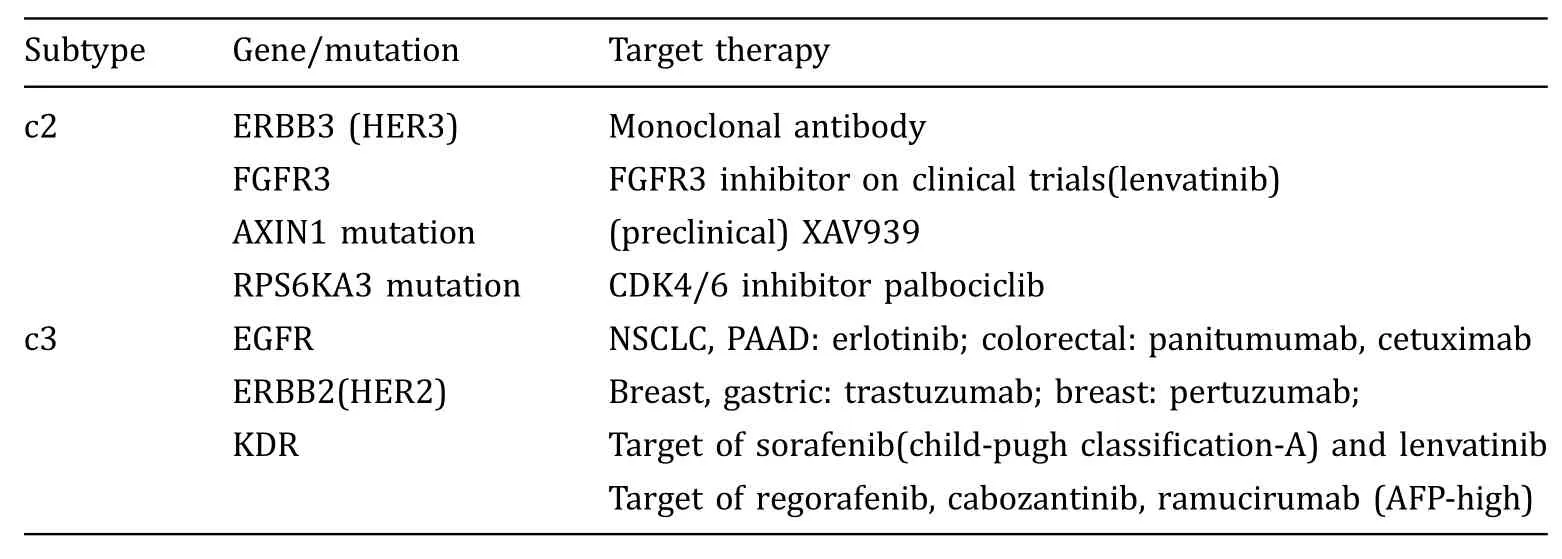
Table 3 Potential therapybased on signatures
Three HCC datasets were used as validation set,listed in supplementary Table S3. Processed transcriptome data of GSE65485 and GSE36376 were downloaded from GEO (Barrett et al. 2013) with the R package GEOquery (Davis and Meltzer 2007). For GSE65485 dataset, mutation status for gene TP53 and CTNNB1 was also grepped from GEO. Another dataset of paired HCC samples (Liver110) was provided from collaborators. Liver110 dataset consisted of 55 tumor samples and 55 paired normal samples acquired from surgical resection.The RNA of specimens was sequenced and the expression values of immune-related genes and classifier genes were provided from collaborators.
Subtype classification based on transcriptome
HCC samples were classified into three subtypes based on transcriptome as described in Hoshida’s paper(Hoshida et al. 2009). Subtype classification was performed using gene pattern (Reich et al. 2006) module nearest template prediction(Hoshida et al.2008;Reiner et al. 2003; Xu et al. 2008), given signature genes for each class. The confidence level of classification was evaluated with resampling, providing p value and FDR for each sample. Samples with classification FDR <0.1 were considered as successfully classified and other samples were not included in the following analysis.Same classification procedure was applied to TCGA-HCC and three validation sets. Classification result of three validation sets was listed in supplementary Table S3.
Identification of immune-related genes
Transcriptome data of TCGA samples were downloaded from cBioPortal as RSEM values.The transcriptome data were log2-transformed before further analysis. For microarray data GSE36376, gene expression values were calculated as mean of probe detection values. The gene symbols were converted to ENTREZ ID with R package AnnotationDbi (Herve et al. 2018) and org.Hs.eg.db database (Marc 2018).
The immune-related gene set was collected from TCIA and KEGG(Charoentong et al.2017;Kanehisa et al.2017). It was composed of MHC-class-related genes,immunoinhibitors, immunostimulators, cytokines, and cytokine receptors. Among them, 386 gene expressions were identified from the RNA-seq data. Genes not expressed in more than 80% of sample were removed from further analysis.
Cytolytic activity(CYT) was evaluated with the mean expression value of GZMA(granzyme A),PRF1(perforin 1), CD8A, CD8B, and GZMB (granzyme B) referring to previous study (Jiang et al. 2018).
Pathway analyses
Pathway overrepresentation enrichment test was conducted with WebGestalt (Wang et al. 2017) to explicit functions of over-expressed genes for each subtype.KEGG was used as pathway database. Three hundred and eighty-six immune-related genes were used as reference set and significance level as FDR <0.1.
Enrichment of cancer hallmarks and immune-related pathways was calculated with ssGSEA (Barbie et al.2009; Subramanian et al. 2005) using R package GSVA(Ha¨nzelmann et al.2013).Fifty hallmark gene sets were downloaded from MSigDB (Molecular Signatures Database). Twenty immune-related pathways were downloaded from KEGG.
The correlation between enrichment scores of pathways were calculated as spearman correlation.For gene expression correlation, Pearson correlation was used.
Estimation of TILs
A deconvolution method, CIBERSORT, was adopted to identify the TILs in the tumor microenvironment. With signature genes for each cell type, CIBERSORT could provide a robust estimation of the abundance of 22 immune cell types. Expression data of tumor samples were processed with the online version of the tool,with default parameter settings. The relative values of TILs were used in the following analysis.
Neoantigen and mutation load
The neoantigen information of TCGA-HCC was downloaded from TCIA (https://tcia.at/). Neoantigen load,similar as mutation load,counts the number of possible neoantigens per sample.
Statistical analyses
All statistical analyses were completed in R (R Core Team 2017).
To test the difference of clinical data between subtypes, continuous and categorical variables were tested with Kruskal-Wallis test and Fisher’s exact test,respectively.
To test differential gene expression and TILs score between subtypes, the non-parametric Kruskal-Wallis test was used.For comparison between two groups,the non-parametric Wilcoxon rank sum test was used. The p values were adjusted for multiple testing using the Benjamini-Hochberg approach.
Fisher’s exact test was used to identify whether mutation of specific genes/pathways have greater influence to immune-related genes compared with other genes.Genes significantly differently expressed between mutant and non-mutant groups were considered as influenced by the mutation.
Survival analysis
To evaluate the influence of one variable on survival,such as gene expression or TIL score, univariate cox model was used. The cox model was adjusted to stage where specified. To compare the survival difference between groups, log-rank test was used. Survival analysis was conducted in R with the package survival.
For TCGA-HCC samples, two samples who had received neoadjuvant treatment were excluded from the survival analysis.
Acknowledgements The results shown above are in part based upon data generated by the TCGA Research Network: https://www.cancer.gov/tcga.This work was financially supported in part by grants from the National Natural Science Foundation of China(31771472) and National Key R&D Program of China(2017YFC0907505, 2016YFC0901704, and 2017YFC0908405).
Compliance with Ethical Standards
Conflict of interest All authors declare that they have no conflict of interest.
Human and animal rights and informed consent This article does not contain any studies with human or animal subjects performed by any of the authors.
Open Access This article is licensed under a Creative Commons Attribution 4.0 International License, which permits use, sharing,adaptation, distribution and reproduction in any medium or format, as long as you give appropriate credit to the original author(s)and the source,provide a link to the Creative Commons licence, and indicate if changes were made. The images or other third party material in this article are included in the article’s Creative Commons licence, unless indicated otherwise in a credit line to the material. If material is not included in the article’s Creative Commons licence and your intended use is not permitted by statutory regulation or exceeds the permitted use, you will need to obtain permission directly from the copyright holder. To view a copy of this licence, visit http://creativecommons.org/licenses/by/4.0/.