Influence of pore size optimization in catalyst layer on the mechanism of oxygen transport resistance in PEMFCs
Shumeng Guan ,Fen Zhou ,Jinting Tan,∗ ,Mu Pan,∗∗
a State Key Laboratory of Advanced Technology for Materials Synthesis and Processing,Wuhan University of Technology,Wuhan,430070,China
b Hubei Provincial Key Laboratory of Fuel Cells,Wuhan University of Technology,Wuhan,430070,China
ABSTRACT In PEMFC,the oxygen transport resistance severely hinders the cell from achieving high performance.In this paper,pore-forming agent was used to optimize the pore size distribution of the catalyst layer(CL),and to study its effect on the mechanism of oxygen transport resistance,including molecular diffusion resistance,Knudsen diffusion resistance,and local O2 resistance in CL.The results showed that with the pore formation the cell performance had a significant improvement at high current density,mainly due to its better oxygen transport properties,especially under low platinum conditions.The addition of pore-forming agent moved the pore diameter toward a larger pore diameter with a range from 70 to 100 nm,and also obtaining a higher cumulative pore volume.It was found that the increase of the cumulative pore volume and larger pore size were conducive to the diffusion of oxygen molecules in CL,and the resistance caused by which was the dominant part in total transport resistance.Further tests indicated that the improvement of molecular diffusion resistance was much larger than that of Knudsen diffusion resistance in the catalyst layer after pore formed.In addition,the optimized pore structure will also get a higher number of effective pores,which resulted in an increased effective area of the ionomer on the Pt surface.The higher effective area of the ionomer was particularly beneficial for the reduction of local O2 resistance with low Pt loading.
Keywords:Pore size optimization Pore-forming agent Oxygen transport resistance PEMFC
1.Introduction
With the advantages of high efficiency and clean emissions,proton exchange membrane fuel cells (PEMFCs) would become one of the development direction of future energy application [1-3].In order to realize a higher output power and better durability of the membrane electrode assemblies(MEA),the optimization of the electrode structure is of the essence.The mass transfer polarization is always a non-negligible obstacle for MEA to achieve higher performance in high current density.Therefore,rationally designing the structure of the electrode,increasing the mass transfer performance and improving the Pt utilization in MEA are the keys to get better capability [4-8].The mechanism of gas transport in the MEA is of great significant.
The oxygen transport resistance,as an indicator of gas transport properties,has become a popular index for evaluating the behaviors in fuel cells[9-13].It has been shown that the oxygen transport resistance in CL accounts for up to 2/3 of the total oxygen transport resistance in the MEA [14].
In CL,the total oxygen transport resistance consists of molecular diffusion resistance (RCL,Fick),Knudsen diffusion resistance (RCL,Knudsen),and local O2resistance (RLocal) [12].RCL,Fickand are both transport resistance caused by pores,and collectively denoted as gas transport resistance (RCL,gas).The Knudsen diffusion occurs in pore diameters smaller than the free path of gas molecules,while the molecular diffusion occurs in pore diameters larger than the free path of gas molecules and a pore diameter of 100 nm is usually as a boundary to distinguish them.The molecular diffusion is affected by pressure,whereas the Knudsen diffusion is not.Therefore,during the test of oxygen transport resistance,molecular diffusion resistance and Knudsen diffusion resistance are divided by the change of pressure [12,15].TheRLocalcaused by the ionomer film is inversely proportional to the roughness of Pt in CL,which dominates the electrode's total oxygen transport resistance under low Pt loading [15].
The addition of pore-forming agent is a common method to optimize the structure of CL.In detail,it is aimed to tailor the pore size distribution of CL [16-21].Pore-making materials usually include polystyrene (PS) microspheres,ammonium carbonate,ammonium oxalate,ammonium sulfate,etc.[22-26].The addition of a pore-forming agent indeed increases the mass transfer of the MEA and improves the performance of the cells.However,the mechanism about the change of the pore size affects the mass transfer has not been studied.Recently,a study explained the mechanism of mass transfer properties in which the MgO was used as the pore-forming agent.However,MgO was added to a dummy catalyst layer (DCL) without Pt,would exclude the effect of pore-forming agents onRLocal.Moreover,RCL,FickandRCL,Knudsenwere not separated to be investigated.Therefore,the effect of pore size distribution on oxygen mass transfer in each part has not been fully analyzed [27].
The pore size distribution of CL in this work was adjusted by adding PS microspheres,and the effect of pore size optimization on the oxygen transport resistance of each part has been investigated.The relationship between this effect and the Pt loading also has been quantitatively analyzed.
2.Experimental
2.1.Fabrication of MEAs
In this work,two specifications cathode CLs of MEA with Pt loading of 0.1 mg cm−2and 0.3 mg cm−2were prepared.The traditional cathode inks were composed of 57.3 wt% Pt/C (Tanaka Inc.),5%Nafion solution (DuPont),deionized water and isopropyl alcohol.The ionomer-to-carbon weight ratio (I/C) was controlled to be 0.9.The modified ink was obtained by mixing the PS microspheres with a diameter of 300 nm to the traditional ink.The weight ratio of pore-forming agent to catalyst (PF/Catalyst) was 0.3.All anode catalyst layers had the same Pt loading of 0.1 mg cm−2.The anode inks were prepared by the same way,except that the catalyst was changed to the 30 wt%Pt/C(Tanaka Inc.).The well-mixed inks were coated on the substrate by controlled Meyer rod to obtain different loading of CLs,following with a drying process,as showed in Fig.1.The catalyst layer with the poreforming agent should be immersed in toluene for 72 h to remove the PS microspheres[26].Both of the anode and cathode CLs were transferred to the proton membrane (W.L.Gore &Associates) by decal transfer method to form catalyst-coated membrane (CCM).
The gas diffusion layers (GDLs) were purchased from WUT New Energy Co.Ltd.The MEAs were composed of the CCM with clamping GDLs on both sides to form a sandwich structure.The traditional MEA was denoted as“Without-PS-X″,and the modified MEA was“With-PSX″,and X stands for the Pt loading of the cathode (0.3 or 0.1).
2.2.Morphological analysis
The structures of cathode CLs with or without PS microspheres were studied by scanning electron microscopy (SEM,HITACHIS-4800,Japan)with an accelerating voltage of 5 kV and a resolution of 0.5 nm.Mercury Injection Apparatus (MIP,Auto Pore Ⅳ) was carried out to investigate the specific pore volume and its distribution from 10 nm to 10,000 nm of cathode CLs.
2.3.Fuel cell testing
The active area of CL was 25 cm2(5 × 5 cm2).The polarization curves of single cell tests were recorded on an automated HEPHAS(HTS-125)fuel cell test station to evaluate the performance of the MEA.The testing condition was set at 75°C with hydrogen and air at 150 kPa as fuel and oxidant.The initial flow rate was 210 cc min−1(anode)and 500 cc min−1(cathode).The stoichiometric ratio of hydrogen to air was maintained at 2.0 throughout the testing.The relative humidity of the anode and cathode were fixed at 100% throughout the measurements.
2.4.Oxygen transport resistance testing
Oxygen transport resistance test methods and fixture selection can refer to the previous work [8],In this work,the automated HEPHAS(HTS-125) fuel cell test station was also used to test the polarization curve,and the limiting current was derived from the polarization curve.Therefore,the oxygen transport resistance (Rtot,s·cm−1) of the MEA was calculated according to the following equation [8,28]:

whereIlimis the limiting current density (A·m−2),is the oxygen partial pressure (Pa),is the oxygen mole fraction,Ris the gas constant(J·mol−1K−1),Tis the gas temperature(K),andFis Faraday's constant (C·mol−1).
According to Eq.(1),Rtotis proportional toIn theory,the intercept of the ordinate represents the pressure-independent oxygen transport resistance (RNP).Rtotis the sum ofRNPandRP(pressure-dependent resistance):

RNPcan be calculated as follow [15]:

whereRMPL,Knudsenis Knudsen diffusion resistance generated in the microporous layer (MPL),RPt,Localis the local O2resistance normalized to Pt surface area,andfPtis the roughness factordefined as the product of the Pt loadingand the electrochemical surface area
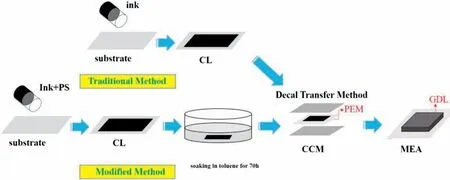
Fig.1.Schematic flowchart illustrates the procedure for preparation of MEA using the decal method.
According to Eq.(3),theRCL,Knudsencan be obtained:

In this work,the variable quantity inRCL,Knudsencan be shown by the value ofRKnudsendue to the identical MPLs were used.
For Eq.(3),under the condition of ensuring the same diffusion layer and CL structure,RNPis proportional to the inverse of the roughness factor,and the slope isRPt,Local.Therefore,with the Pt loading of the cathode CL adjusted,theRLocalcan be calculated by Eq.(5).

Eqs.(1)-(5) can be combined to obtain the variable quantity of the transport resistance before and after the pore-forming agent added in CL.
For the accuracy of the experiment,a single cell with a small active area(1×2 cm2)was selected.Straight flow field,low oxygen fraction,high gas flow are chose to prevent uneven gas distribution within the cell and the generation of large amounts of liquid water.
The anode was bubbled into pure hydrogen with the excessive flow rates of 1600 cc min−1,to maintain the stability during the single cell test.The diluted O2was supplied to the cathode (the dry mole fraction of oxygen was 0.5,1,1.5 and 2%) in N2gas with a fixed flow rate of 4600 cc min−1.The cell temperature was 75 °C and the relative humidity of the cathode and anode were 70%.
In order to study the relationship between back-pressures and oxygen transport resistance,the limiting current measurements were conducted at different back-pressures of 150,200,250,and 300 kPaabs.
3.Results and discussion
3.1.Single cell performances
Fig.2 shows the performance curves of the MEAs with and without pore-forming agent under different Pt loading conditions.It can be found that the performance of MEA is significantly improved by adding pore-forming agent to the CL,especially at high current density.With Pt loading of 0.3 mg cm−2,the cell voltage is increased by 14.8% from 0.473 V to 0.543 V after pore formed at 2500 mA cm−2,while With-PS-0.1 sample shows a higher increase by 39.6% from 0.326 V to 0.455 V at the same condition,indicating that the effect of pore-forming agent is more obvious with low Pt loading.The addition of poreforming agent better delays the arrival of mass-transport polarization[29,30].In addition,in low current density region (0-200 mA cm−2),the performance of With-PS-X is slightly larger than that of Without-PSX.It is even more pronounced at a Pt loading of 0.1 mg cm−2.The behavior of the cells in this region is mainly controlled by activated loss,which is related to the activity of Pt/C and the three-phase interface of the CL [31].
The performance of the MEAs after pore formed was compared with other groups [22,23,27,32-34].The maximum power density is shown in Fig.S1.It reveals that the performance of CL after pore formed in this paper (1.18-1.43 W cm−2) is far great than other groups(0.3-0.592 W cm−2).
Based on the discrepancy in performance of MEA before and after pore forming,the analysis for the changes in performance will be explained through further tests,including the structure of CL and the oxygen transport resistance.
3.2.Morphological characterization of the catalyst layer
Fig.3 presents that the SEM images of CLs.Fig.3(a) shows the surface morphology of Without-PS-0.3.Fig.3(b) and (c) display the surface morphology of CL before and after adding pore-forming agent with a Pt loading of 0.3 mg cm−2.It could be seen from Fig.3(a) that Without-PS-0.3 sample is composed of carbon aggregates and pores.After adding pore-forming agent,the PS microspheres in Fig.3(b) are evenly dispersed in CL.The particle size of PS microspheres is about 300 nm,and there is not agglomeration for the pore-forming agent.It can be observed from Fig.3(c) that the PS microspheres have been completely removed,and obtaining 300 nm pores in CL.It is proved that PS microspheres are successfully used to form pores in CL,increasing the pore size of CL.Similar surface structure can be observed for the CL with 0.1 mg cm−2.
Fig.4 shows the pore size distribution and cumulative pore volume curves of CL measured by MIP.From Fig.4(a) and (b),it can be observed that the pore-forming agent promoted the pore size distribution of CL moving toward the direction of large pores,which belongs to the secondary pores formed between the carbon aggregates.It demonstrates that the pore-forming agent successfully changed the pore size distribution of CL.Fig.4(c) and (d) exhibit that the cumulative pore volume in CL increased after the pore formed,which may be beneficial to the transport of gases and the generated water.Moreover,it could be obtained from Fig.4 that the size of the increased pore diameter was about 70-100 nm.However,it is not consistent with the particle size of the PS microspheres.This could be ascribed to the decal transfer process during which the CL would undergo hot pressing and resulting in a smaller pore size [20].The detailed manufacturing method has been shown in Fig.1,in which the PS microspheres in CL were removed before decal transfer.In addition,the increased cumulative pore volume in the case of low Pt loading is more obvious,and getting a better cell performance [23].
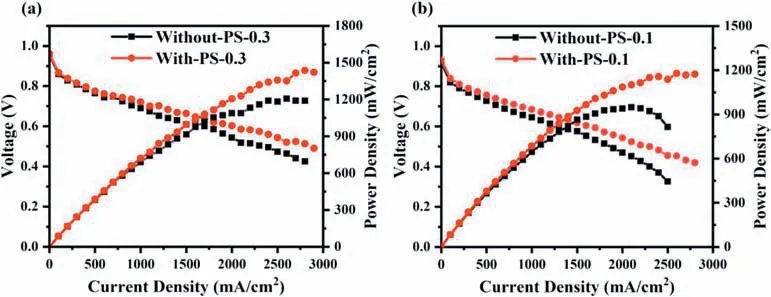
Fig.2.Polarization curves of CL with and without the pore-forming agent (a) Without-PS-0.3 and With-PS-0.3.(b) Without-PS-0.1 and With-PS-0.1.
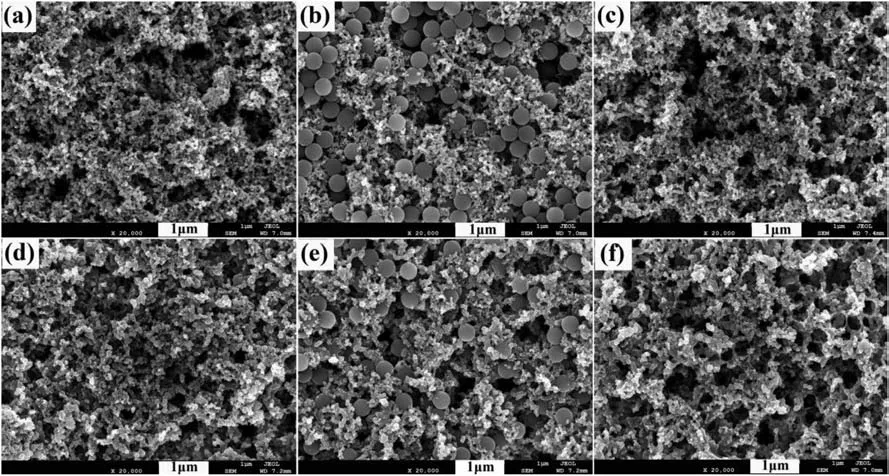
Fig.3.SEM images for the CLs.(a)Without-PS-0.3.(b)and(c)are the CLs before and after removal of PS at 0.3 mg cm−2.(d)Without-PS-0.1.(e)and(f)are the CLs before and after removal of PS at 0.1 mg cm−2.
3.3.Oxygen transport resistance
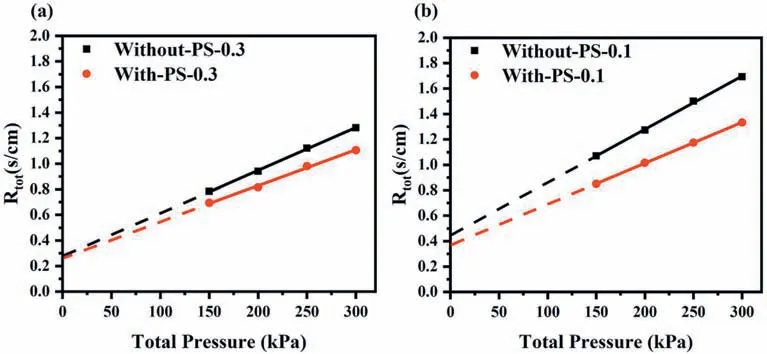
Fig.5 showsRtotplotted versus absolute gas pressure before and after the pore formed with different Pt loading.The specific limiting current data has been displayed in Fig.S2 and Fig.S3.Rtotof With-PS-0.3 was slightly lower than Without-PS-0.3.At 300 kPa,Rtotwas decreased by 13.7%from 1.282 s cm−1to 1.106 s cm−1in Fig.5(a).The value ofRNPwas dropped from 0.279 s cm−1to 0.268 s cm−1after the pore formed with a decrease of only 4%.However,under the condition of 0.1 mg cm−2,a higher improvement ofRtotwas observed from 1.693 s cm−1to 1.333 s cm−1at 300 kPa,and more obvious than that with high Pt loading.Furthermore,the value ofRNPfor 0.1 mg cm−2was 0.370 s cm−1with a decline up to 16.3% from 0.442 s cm−1after the pore formed as showed in Fig.5(b).It was also found that the poreforming agent mainly reduced theRPin CL,while had little effect onRNPat high Pt loading.When the Pt loading was low,the reduction ofRtotwas more significant than that with high Pt loading,and both ofRNPandRPdecreased.
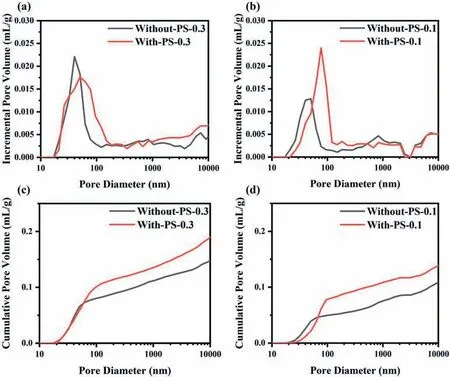
Fig.4.Incremental pore volume versus pore diameter as a function of different Pt loading.(a)0.3 mg cm−2,(b)0.1 mg cm−2.Cumulative pore volume versus pore diameter as a function of different Pt loading,(c) 0.3 mg cm−2,(d) 0.1 mg cm−2.
4.Discussion
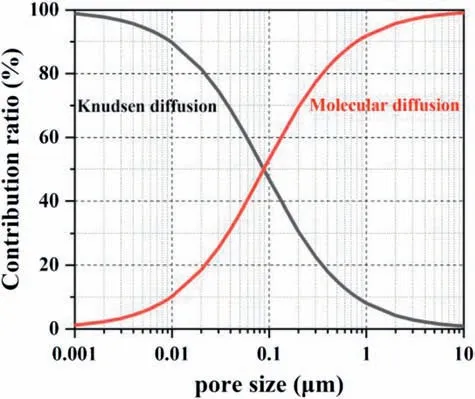
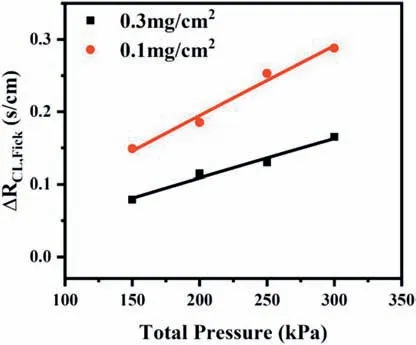
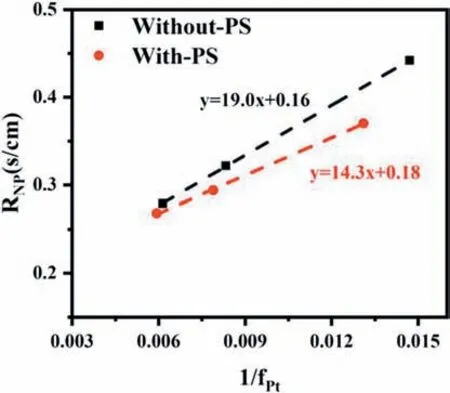
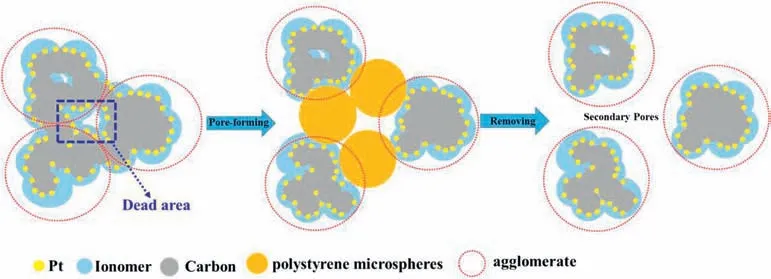
When the oxygen diffuses through the GDL and the CL with different pore size distributions,it must follow different diffusion mechanisms.It may be closely related to the Knudsen number(Kn),which is defined as the ratio of the free path of the gas molecule (λ) to the pore diameter(dp).Diffusion follows either the molecular diffusion mechanism(Kn<0.1),or the Knudsen diffusion mechanism (Kn>10),or a combination of both (0.1 wherekBis the Boltzmann constant,Tis the absolute temperature,σis gas molecular diameter,Pis the absolute pressure. Molecular diffusion occurs in pores that are much larger than the mean free path of gas molecules,and the self-diffusion coefficient is not sensitive to pore size.So,Eq.(11)can be used to express the molecular self-diffusion coefficient.υis the molar-average velocity [36]. Knudsen diffusion occurs in pores that are much smaller than the mean free path of gas molecules,and gas molecules collide with solid walls more frequently than with each other.The Knudsen diffusion coefficient is given by Eq.(12) [36]. Assuming that both molecular diffusion and Knudsen diffusion exist in CL,the diffusion coefficient (DCL,gas) is estimated by using the Bosanquet relation: wherehCLis the thickness of the CL. Combining Eqs.9-15,it can be obtained the following equations: According to Eq.(16) and Eq.(17),the contribution ratio of molecular diffusion vs Knudsen diffusion on the oxygen transport resistance in nitrogen can be obtained (Fig.6). The value ofΔRCL,Fickcan be calculated based on Eq.(6),as showed in Fig.7.The effect of the pore-forming agent onRPcan be observed,as shown in Fig.5.It can be observed that the slope of the curves after pore formed was smaller than that of the traditional CL.It indicates that the change of the pore diameter of the CL moving toward a large pore diameter (70-100 nm) is beneficial to reduceRCL,Fick.Fig.6 illustrates that the oxygen diffusion in CL can't simply use 100 nm as the boundary between molecular diffusion and Knudsen diffusion.In addition,adding the pore-forming agent also improves the cumulative pore volume and porosity of the CL,which is coincided with the analysis results of the MIP.Other study also comes out the same results [27].Furthermore,ΔRCL,Fickis more obvious along with the absolute pressure increase,which could be ascribed to two reasons.One is thatRCL,Fickvs pressure is positively correlated,and the other is that the mean free path of oxygen molecules decreases as the pressure increases,resulting in a higher contribution ratio of the molecular diffusion in the gas transport resistance [12,35]. Fig.5. Rtot versus absolute gas pressure plots before and after pore formed.(a) 0.3 mg cm−2.(b) 0.1 mg cm−2. Fig.6.Contribution ratio of molecular diffusion as well as Knudsen diffusion to the gas transport resistance vs pore size in nitrogen with atmospheric pressure at 75 °C. Fig.7. ΔRCL,Fickplotted versus absolute gas pressure. Depending on the different gas diffusion mechanism,RNPof Without-PS-X and With-PS-X were obtained through oxygen transport resistance tests.The curves ofRNPvs1/f Ptare plotted according to Eq.(3).The slope of the curves isRPt,Local,as shown in Fig.8.RPt,Localis 14.3 s cm−1for With-PS-X,which is smaller than Without-PS-X of 19.0 s cm−1.Based on Eq.(3)~(5),RLocalandRKnudsenof Without-PS-X and With-PS-X can also be obtained.The specific values are showed in Table S1. Fig.8. RNP plotted versus1/f Pt. Fig.9.Change of ΔRCL,Knudsen and ΔRLocal with Pt loading. Based on the values ofRKnudsenof Without-PS-X and With-PS-X in Table S1,ΔRCL,Knudsencan be calculated by Eq.(7).The change ofΔRCL,Knudsenwith Pt loading is shown in Fig.9,indicating that the Pt loading and the addition of pore-forming agent have little effect onRCL,Knudsen.This may be attributed to that the cumulative pore volume of the CL has slight change in the range of 20-70 nm,where the Knudsen diffusion is dominant part,as shown in Fig.4 (c) and Fig.4 (d).It should be noted thatRKnudsenis composed of bothRMPL,Knudsenand,and the pore size distribution of MPL and CL is similar [37].However,the thickness of MPL is much larger than the CL.Thus,the contribution ratio ofRCL,Knudsenin CL is very small,which may also be the reason why the change in the pore size of CL has little effect onRCL,Knudsen. ΔRLocalis acquired from Eq.(8).The change ofΔRCL,Knudsenwith Pt loading is illustrated by Fig.9.At 0.3 mg cm−2,the values ofRLocaldecreased from 0.170 s cm−1to 0.102 s cm−1after the pore formed,andΔRLocalwas only 0.068 s cm−1.WhileRLocaldropped from 0.437 s cm−1to 0.218 s cm−1with a Pt loading of 0.1 mg cm−2,and itsΔRLocalwas up to 0.219 s cm−1,which is more than three times that of 0.3 mg cm−2.It indicates that the addition of pore-forming agents could effectively reduce the value ofRLocal.Moreover,this phenomenon was getting more prominent with the decrease of Pt loading.Therefore,the improvement ofRLocalin reducingRtotis particularly obvious under low Pt loading,which is consistent with those reported results in the literatures [12-15]. The main reason is that there are enough Pt particles with higher Pt loading,which can completely meet the requirement for the oxygen reduction reaction.Under this condition,though the pore-forming agent separated the carbon agglomerates,and part of dead areas between the agglomerates are released,it does not significantly affect the effective oxygen transport ionomer area on the Pt surface.However,with the decrease of Pt loading,the effective oxygen transport ionomer area on the Pt surface is declining due to a small amount of Pt particles[12,38].After pore formed,both the accumulative pore volume and the number of effective pores of the CL are increased,a certain number of Pt particles and dead areas are exposed,which will increase the effective oxygen transport ionomer area,thereby leading to the decrease ofRLocal.Fig.10 displays a schematic diagram of changes in agglomerates in CL after the addition of pore-forming agent.It is proved by the testing results of the electrochemical active surface area with and without PS microspheres,as shown in Fig.S4.The electrochemical active surface area of the CL increased after pore-formed,and this phenomenon was more obvious under low Pt loading conditions. Fig.10.Schematic diagram of changes in agglomerates in CL after a pore-forming agent is added. 1.Adding the pore-forming agent (PS microspheres,300 nm) leads to the pore size distribution of CL moving toward the direction of large pores,and the cumulative pore volume increases.With Pt loading of 0.3 mg cm−2,the cell voltage is increased by 14.8%from 0.473 V to 0.543 V after the pore formed at the current density of 2500 mA cm−2,while the With-PS-0.1 sample shows a higher increase by 39.6% from 0.326 V to 0.455 V with the same current density,indicating that the effect of pore-forming agent is more obvious with low Pt loading.The addition of pore-forming agent better delays the arrival of mass-transport polarization.Moreover,the performance of With-PS-0.1 is 1.18 W cm−2,which can be even up to the performance of Without-PS-0.3 (1.20 W cm−2). 2.Increasing a number of large pores with diameter of 70-100 nm is benefciial to reduceRCL,Fick.Furthermore,the decrease inRCL,Fickis more obvious along with the absolute pressure rising.However,the Pt loading and the addition of pore-forming agent have little effect onRCL,Knudsen.With regard toRLocal,the addition of pore-forming agents can effectively reduceRLocal.Moreover,this phenomenon is moreprominentwiththedecrease ofPtloading.ΔRLocalunder the caseofPtloading of0.1mg cm−2ismore thanthree timesthat of 0.3 mg cm−2. Declaration of competing interest The authors declare that they have no known competing financial interests or personal relationships that could have appeared to influence the work reported in this paper. Acknowledgements This work was financially supported by the National Key Research and Development Program of China (Program No.2016YFB0101200(2016YFB0101205)),National Natural Science Foundation of China(Program No.21875177),Foshan Xianhu Laboratory of the Advanced Energy Science and Technology Guangdong Laboratory”(Program No.XHD2020-002-03 and XHD2020-002-04). Appendix A.Supplementary data Supplementary data to this article can be found online at https://doi.org/10.1016/j.pnsc.2020.08.017.


4.1.The diffusion resistance in gas phase can be expressed as1"4.1 The diffusion resistance in gas phase can be expressed as",this is the main text rather than the title.The serial number of the title needs to be corrected


4.2.ΔR CL,Fickin The catalyst layer
4.3.ΔR CL,Knudsen in The catalyst layer

4.4.ΔR Local in The catalyst layer
5.Conclusion
 Progress in Natural Science:Materials International2020年6期
- Progress in Natural Science:Materials International的其它文章
- Stability of PGM-free fuel cell catalysts:Degradation mechanisms and mitigation strategies
- Understanding of free radical scavengers used in highly durable proton exchange membranes
- Electrolyte membranes for intermediate temperature proton exchange membrane fuel cell
- Key technologies for polymer electrolyte membrane fuel cell systems fueled impure hydrogen
- Electrolyte materials for intermediate-temperature solid oxide fuel cells
- Carbon-free nanoporous gold based membrane electrocatalysts for fuel cells
