YATA:Yet Another Proposal for Traffic Analysis and Anomaly Detection
YuWang,YanCaoLianchengZhangHongtaoZhang,RoxanaOhriniuc,GuodongWangandRuosiCheng
Abstract:Network traffic anomaly detection has gained considerable attention over the years in many areas of great importance.Traditional methods used for detecting anomalies produce quantitative results derived from multi-source information.This makes it difficult for administrators to comprehend and deal with the underlying situations.This study proposes another method to yet determine traffic anomaly (YATA),based on the cloud model.YATA adopts forward and backward cloud transformation algorithms to fuse the quantitative value of acquisitions into the qualitative concept of anomaly degree.This method achieves rapid and direct perspective of network traffic.Experimental results with standard dataset indicate that using the proposed method to detect attacking traffic could meet preferable and expected requirements.
Keywords:Anomaly detection,cloud model,forward cloud transformation,backward cloud transformation,quantitative data to qualitative concept.
1 Introduction
Network traffic analysis is one of the most interesting topics in the research of basic theory of computer network.With the rapid development of Internet services and improvement of network performance,network threats are becoming more and more significant.Many kinds of anomaly events are mixed with normal traffic,especially viruses/Trojans,Botnet,XSS/CSRF,DoS and other attacks emerge in an endlessly stream.In face of the traditional and newborn threats,traffic analysis and anomaly detection technology is facing severe challenges,notably on how to effectively identify and perceive potential unknown attacks [Cheang,Wang,Cai et al.(2018);Gokcesu and Kozat (2017);Zhao,Luo,Gan et al.(2018);Zu,Luo,Liu et al.(2018)].
Anomaly detection has two main components:the model,and the algorithm.Existing detection methods mainly include signal processing and machine learning based technologies.The former includes statistical analysis [Hu,Xiao,Fu et al.(2006)],frequency spectrum analysis [Chen,Wang,Zhao et al.(2011);Ningrinla,Amar and Kumar (2018)],wavelet analysis [Sun and Tian (2014)] and principal component analysis[Xie,Li,Wang et al.(2018)].The latter’s representative methods cover data mining[Sukhanov,Kovalev and Stýskala (2016)],neural network [Naseer,Saleem,Khalid et al.(2018)] and immunology theory [Jiang,Ling,Chan et al.(2012)].With the increase number of network applications,the overall complexity of network traffic characteristics has sharply raised.The key problem is with the subjective judgment differences between collected data and the analyzer perceptions.
Traditionally,the major problem in network traffic analysis [Li,Sun,Hu et al.(2018);Zhou,Wang,Ren et al.(2018)] is the subjectivity of the analyzer when collecting and analyzing data,many and multidisciplinary experts are needed to analyze traffic anomalies and characteristics,and the final network analysis result is created by a team of experts not just individuals.The experts would like to utilize the threat ratings or levels[Treurniet (2011);Yao,Shu,Cheng et al.(2017)] to characterize the degree of potential damage that anomalous network traffic can bring.It is rated according to a fix number ordinal qualitative scale,like 5,or 10.The maximum number is considered to represent the most frequent and severe threat.
Existing models have been considered as suffering from a lot of drawbacks.First,the threat ratings or levels are subjective and linguistic in nature,which could not be determined precisely using a scale from 1 to 5,or 1 to 10.Second,in view of different backgrounds and understanding levels to the identified abnormal traffic,experts usually have different perceptions and interpretations,hence,the same linguistic grade level always has different meanings from different experts.
The Cloud Model [Li,Liu and Gan (2009);Wang,Xu and Li (2014)] proposed by Li Deyi has been proved to achieve bidirectional cognitive transformation between the qualitative concept and quantitative data.Because of its advantages,the Cloud Model has been widely used in unsupervised communities detection [Gao,Jiang,Zhang et al.(2013)],failure mode and effect analysis (FMEA) [Liu,Li,Song et al.(2017)],monocular visual odometry (MVO) [Yang,Jiang,Wang et al.(2017)] and other fields[Liu,Xue,Li et al.(2017);Peng and Wang (2018);Yang,Yan,Peng et al.(2014)].In this paper,we propose an anomaly traffic analysis method based on the cloud model.The cloud model theory is introduced to depict multiple assessment information given by experts who utilize qualitative concepts to describe the key characteristics of network traffic,so as to establish the gauge cloud.Based on that,we generate abnormal membership cloud and abnormal matrix for the traffic to be determined,in order to analyze and judge the underlying situation of network traffic.
2 Cloud model
The Cloud model proposed is based on probability theory and fuzzy mathematics,which can not only reflect the uncertainty of the concept of natural language,but also can depict the event relationship between the randomness and fuzziness.This model is implemented to make transformation between the qualitative concept and quantitative instantiation.
The definition of the cloud is as follows.
2.1 Definitions
Suppose U is a quantitative domain described by numerical values,and C is a qualitative concept with U.Let x be a random instantiation of C,as well as x ∈ U.If µ(x)represents the certainty degree for C,i.e.,µ(x)∈ [0,1],and satisfy:

Define the distribution of x on U to be a cloud,denoted as C(X),in which each x is called a cloud drop.
A cloud drop is one of the instantiation of qualitative concept C in the form of numerical value,and there is no orderly relationship between them.However,the overall status of cloud drops will reflect the characteristics of the e qualitative concept.The certainty degree of cloud drop indicates the extent of characterizing this qualitative concept,the greater occurrence probability of cloud drop,the higher certainty degree.
The cloud model describes the overall qualitative concept by three numerical characteristics including:
·Ex (Expectation).It is the expectation of the cloud drops,which is considered to be the most representative and typical sample of concept C.
·En (Entropy).It is used to represent the uncertainty measurement of concept C.On the one hand,En indicates the dispersing extent of cloud drops which measures the degree of randomness;on the other hand,En reflects the range of the universe that concept C can accept,which measures the degree of fuzziness.
·He (Hyper Entropy).It is the entropy of En,namely the uncertain degree of En,reflecting the degree of condensation of cloud drops,which is expressed as the dispersion and thickness of cloud.
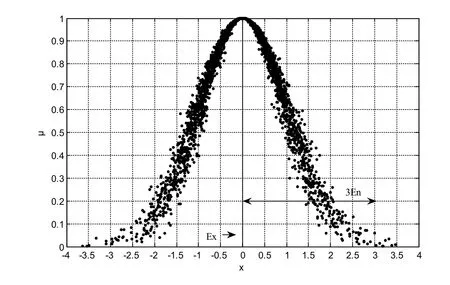
Figure1:The normal cloud model
As shown in Fig.1,the normal cloud is a cloud model that has been frequently used by researchers,in which x is one of the cloud drops which randomly realizes the concept C,and μ is the certaint y degree of x on concept C.The thickness of the e normal cloud is uneven demonstrating the randomness and fuzziness.More than this,each cloud model probably owns different degree of distribution and degree of discreteness,reflecting the randomness and fuzziness features of specific cloud model.This indicates the following:the greater the value of En,the wider the distribution range;the greater the value of He,the larger the degree of discrete.
2.2 Cloud generator algorithms
Algorithm 1:Forward Cloud Transformation (FCT).Transform the qualitative concepts into quantitative representations,that is,to use Ex,En and He to generate cloud drops which satisfy the current network situation.

Figure2:Forward cloud generator
Input:Ex,En,He
Output:Cloud drops
Steps:
1.TakeEnas the expectation,and takeHeas the standard deviation,to produce normal random value |En'|.
2.TakeExas the expectation,and take |En'| as the standard deviation,to produce normal random value x,which is denoted as a cloud drop within this domain.
3.Based onExand |En'|,μ could be calculated as follows:

Here,μis defined as the degree of certainty thatxbelongs to the qualitative concept of C.4.Iterations from Step 1 to Step 3 are preformed to generate n cloud drops,and every drop could be represented asdropi=(xi,μi).
Algorithm 2:Backward Cloud Transformation (BCT).Conduct uncertainty transformation from the quantitative numeric value into qualitative concepts.

Figure3:Backward cloud generator
Input:Set of cloud drops with total amount ofN,namely D={drop1…dropn}.
Output:Ex,EnandHe,which corresponds to the qualitative concepts represented by the cloud.
Steps:
1.Calculate the mean value of the input value based onX:

Also,the first order absolute central moment is:

Besides,the sample variance is:

2.ThereforeEx,EnandHecould be obtained:

By utilizing BCT and FCT,the cloud model could implement reciprocal conversion between qualitative concept and quantitative value based on the interaction between probability theory and fuzzy mathematics.
3 Traffic analysis and anomaly detection model based on cloud model
3.1 Analytical characteristicsoftraffic
Considering the potential differences among the characteristics of network traffic,the anomalies and normal traffic could be identified accordingly.Under usual circumstances,the anomaly traffic characteristics caused by non-human factors are more significant and easy to detect.Oppositely,the abnormal traffic generated by malicious attackers is obvious in termsoftraffic flow rate,average packet length,and the distribution of different protocol packets.
The key characteristics,which mainly reflect the security degree of network traffic,could generally be divided into three levels including strong,weak and neutral according to the given network environment.In the light of above analysis,the characteristicsoftraffic volume,the average packet length of different applications,the average packet arrival interval,the number of connection requests,the number of port pairs in a single flow,are regarded as especially important.According to the division of anomaly levels,7 characteristics are selected to depict the security state of target traffic qualitatively.
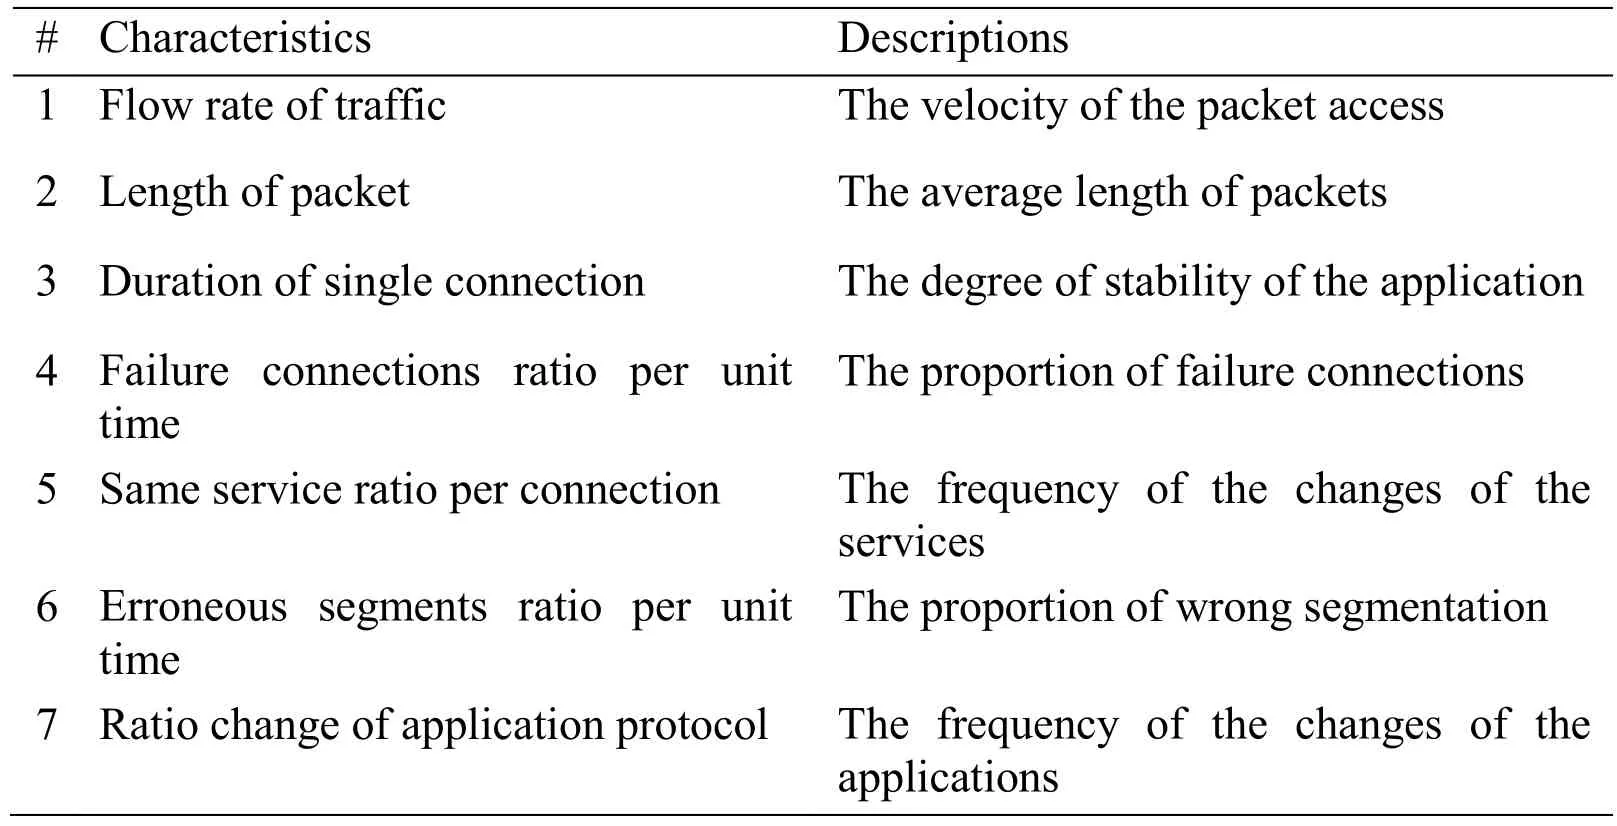
Table1:Characteristicsoftraffic
In this manner,the anomaly state of network traffic could be described and depicted combined with one or multiple characteristics,so as to indicate the traffic qualitatively.For instance,a qualitative description of the characteristics of traffic include:per unit time (assuming 10 minutes,mainly for the TCP) accounted for the rate of change of 5%,the average connection duration is 15 minutes,the failed connection accounted is 2%,the error segment accounted for 0.03%,the same service (assuming WWWis the main access) accounted for 55%,the flow rate is 0.8M Pkt/Min,and the average packet length is 800 Byte.
3.2 Membership degree of traffic characteristics
After characteristic of traffic have been qualitatively described,each characteristic will have three anomaly levels:Low,Medium,and High.These levels are evaluated based on expert evaluations of the e ranges of values of each characteristic.That is,there are three gauge clouds corresponding to each characteristic,and the gauge clouds are taken as the criterion of anomaly determination.In face of given target traffic,the characteristic will be compared with the gauge cloud,and the degree of anomaly membership(High/M iddle/Low) of different characteristics could be obtained.
Anomaly membership cloud for each characteristic is established to describe the distribution of membership values of qualitative concepts,which should also be a normal cloud.Each degree of membership is a random value that follows the normal distribution in order to reflect the uncertainty of the qualitative concept and quantitative values.Suppose the number of experts is n,the expert set is P={ p1,p2,…,pn},expert pievaluates the anomaly membership of one characteristic to be three levels,as hi,mi,lirespectively,and satisfying the condition that 0≤hi,mi,li≤1.Based on this,three membership evaluation results could be processed using the backward cloud generator,to obtain digital features of Ex,En,and He,which reflect the anomaly level(High/Medium/Low) of the qualitative concept.
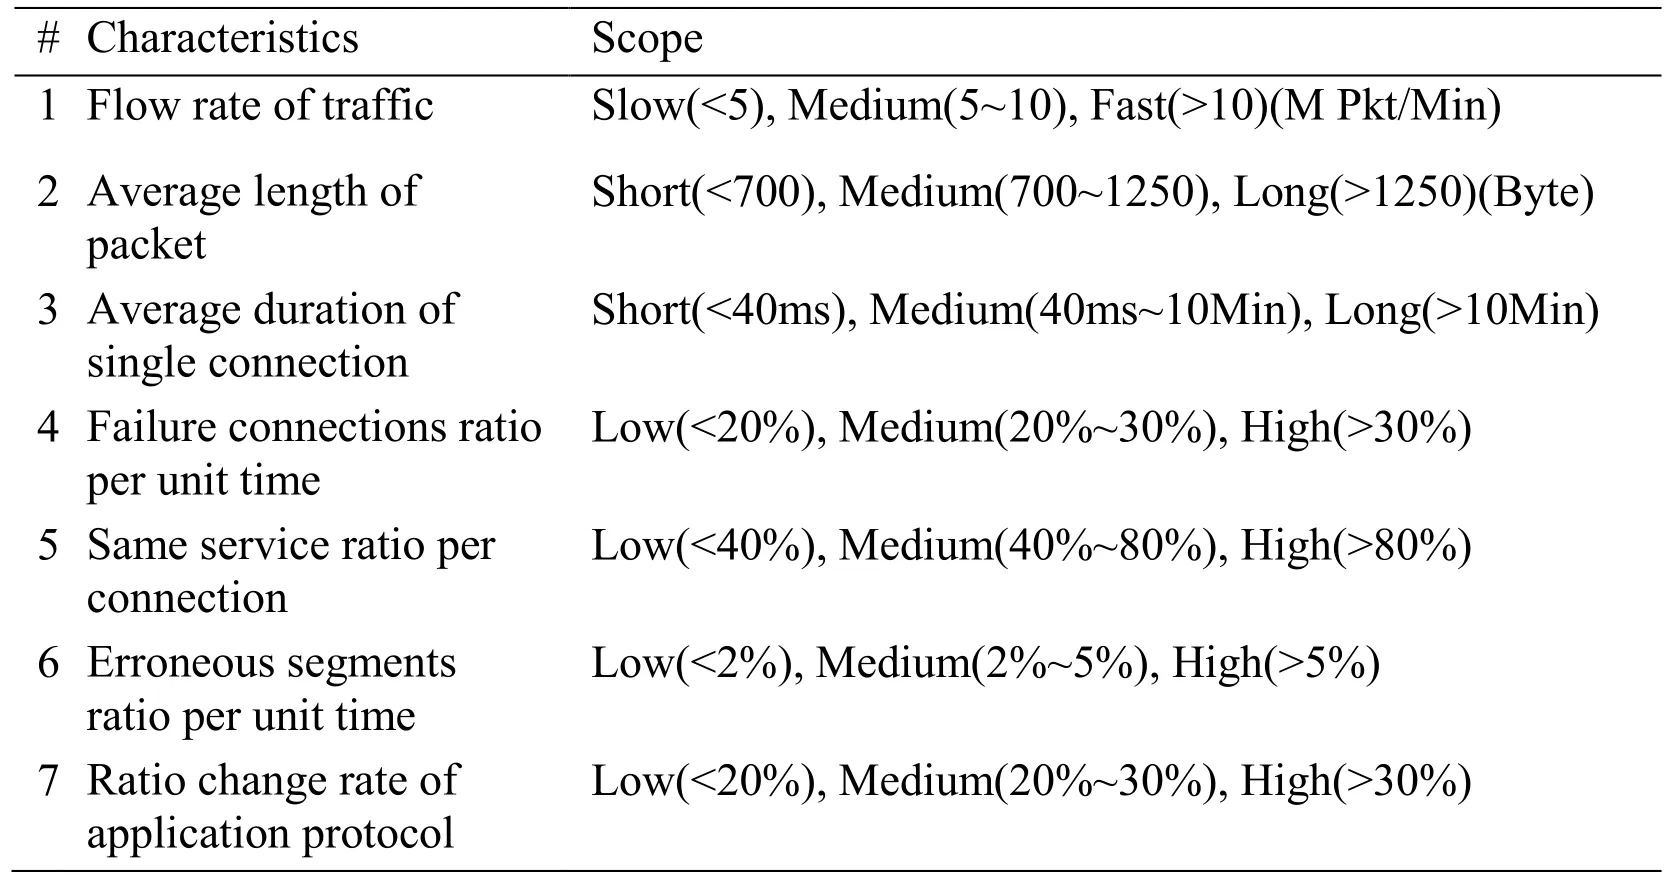
Table2:Scope of characteristics value
It is a great number of cloud drops that could effectively reflect the relationship between the qualitative concept and quantitative numerical value,therefore the digital characteristics obtained from many experts are merged and taken to produce the cloud diagram based on forward cloud generator.The cloud diagram corresponds to the three anomaly levels of qualitative concept,namely High,M iddle and Low.Considering the fair randomness of different opinions from experts,the fused characteristics are good at depicting the fuzziness degree of qualitative concept and the randomness degree of cloud drops.
3.3 Anomaly detection and determ ination
The fundamental process of anomaly detection and determination algorithm based on the cloud model is shown in Fig.4.
Stage 1.Compare a specific characteristic of the traffic with corresponding gauge cloud in order to obtain expectations of the is specific characteristic including three levels as High,M iddle and Low,taken as the membership degrees (md) to depict the anomaly situation.
Stage 2.Calculate all the membership degrees of characteristics within target traffic based on Stage 1 respectively.Suppose the number of traffic characteristics is n,and every characteristic corresponds to three values of membership degrees,thus the Matrix(n×3) could be composed and represented as formula (9).


Stage 3.According to the differences among anomaly levels of High,Medium,Low,different weights are given to mdH,mdM,mdL,and the proportion is α:β:γ.Besides,in view of the difference in mapping and depicting the anomalies,each characteristic is given a different weight,Wmd1:Wmd2:…:Wmdn=κ1:κ2:…:κn,and the WM(Weighted-Matrix,n×3) could be denoted as formula (10).
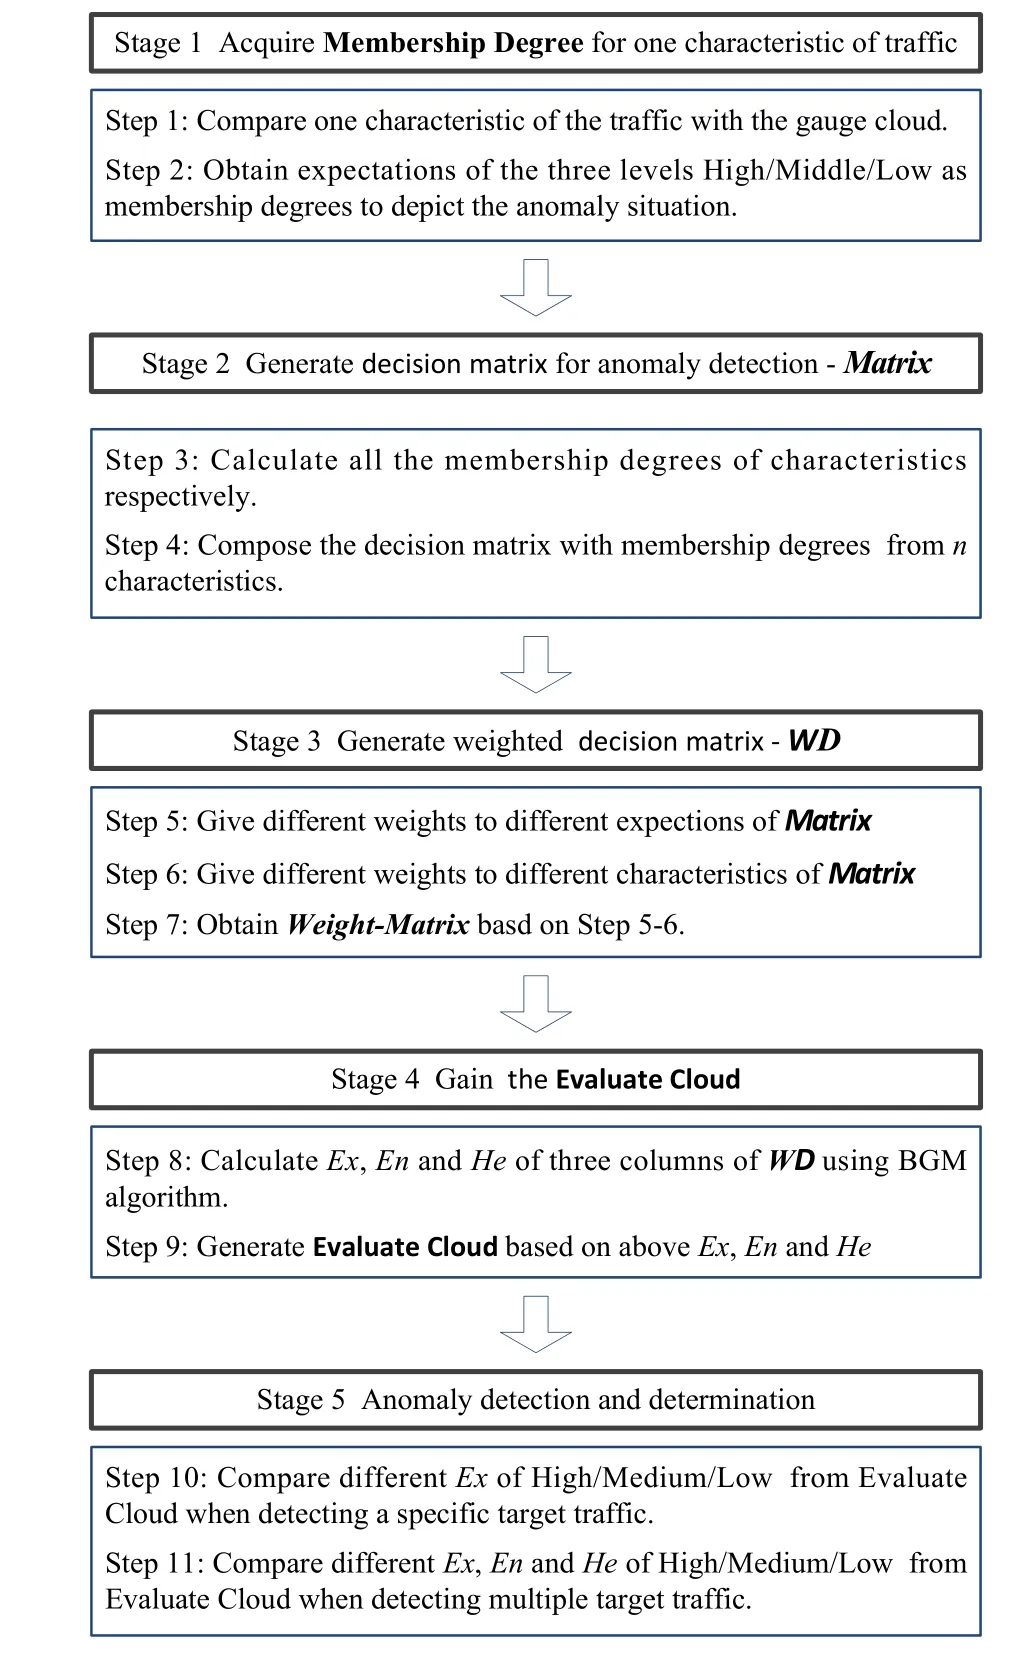
Figure4:Flowchart of anomaly detection and determination algorithm
Stage 4.BCT is utilized to pursue digital features of Ex,En,and He corresponding to the anomaly degree memberships of High/Medium/Low respectively based on WM.Later,the Evaluation Cloud will be created from above Ex,En,and He with FCT algorithm,which covers three sub-clouds referring to the anomaly degrees of High/Medium/Low levels,ensuring that full information originated from traffic characteristics will be fused under these circumstances.
Stage 5.Considering expectation value (Ex) is the most representative indicator of “anomaly”,the determination process abides by the following criterion:(1) when detecting a specific traffic,the expectation values of High,Medium and Low will be compared to select the maximum referring to the maximal membership degree of the qualitative concept.When multiple samplesoftraffic need to be compared,the expectation of High cloud from samples could be directly selected and compared,the larger value means the higher degree of anomaly.When two expectations are the same incidentally,the smaller entropy value (En) of qualitative concept will be decided.In addition,if both the value of expectation pairs and the entropy pairs are the same,the smaller hyper entropy (He) has to be chosen to find the better qualitative concept.
4 Simulation
Experiments to verify the YATA method are carried out by using a standard dataset through two phases:the preparation part is to generate the gauge clouds for follow-up work,and the Implementation part is to demonstrate the proposed method in two logically progressive sections.
4.1 Preparation
In order to verify the effectiveness of proposed method,the simulation process takes advantage of the kddcup_data_10_percent.zip in the benchmark data sets of KDD Cup 1999.Because there are totally 494021 itemsoftraffic records in the kddcup.data_10_percent.txt after decompression,to simplify the simulation,we had selected 6648 items to run experiments,involving normal traffic and three sorts of attacks,including denial of service attack (DoS),scan and sniffing (Probe),unauthorized access from a remote machine (R2L),as the anomaly detection dataset for simulation.Among the 6648 records,almost 2/3 of them are chosen for the generation of gauge cloud,denoted as DB-Gauge,and the remainder 1/3 are kept for the YATA verification,named as DB-VEF.Besides,both of DB-Gauge data set and DB-VEF data set include normal,DoS,Probe and R2L traffic.
It is significant to generate the gauge clouds for all the characteristicsoftraffic,which is prepared for the next stage,namely,anomaly detection and determination.On the basis of classifications towards attack and normal traffic within DB-Gauge,all the numeric selections of 7 traffic characteristics would be estimated by analogue experts,770 for each.In this way,the membership degrees of High/Medium/Low levels of every characteristic could have been obtained.
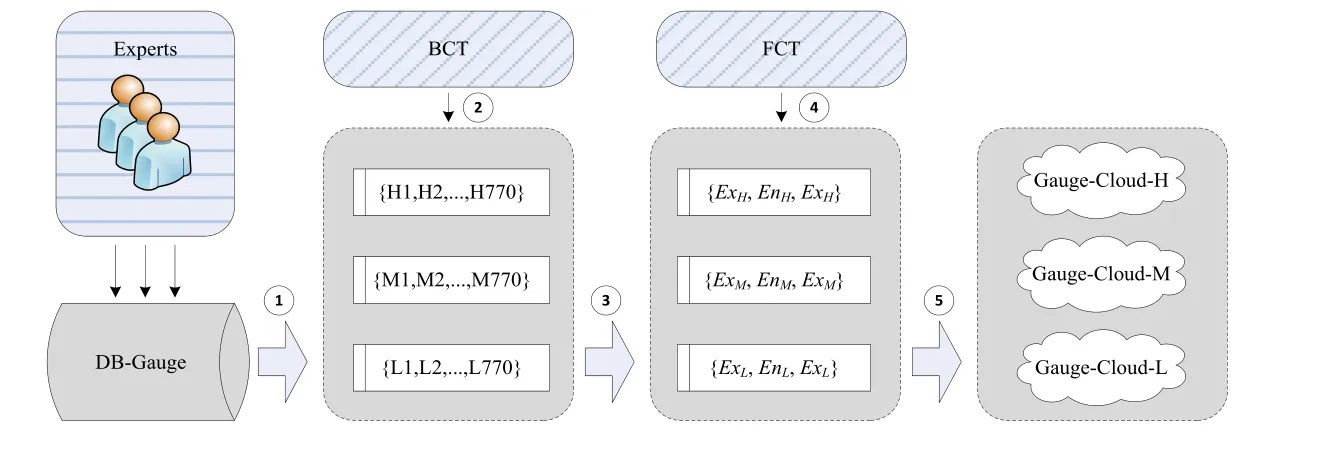
Figure5:Process of gauge cloud generation for one characteristic
Taking the characteristic flow rate of traffic for instance,three sets including{H1,H2,…,H770},{M 1,M 2,…,M 770} and {L1,L2,…,L770} will be acquired by the assessments of analogue experts,which produces numerical values including {ExH,EnH,HeH},{ExM,EnM,HeM},{ExL,EnL,HeL} based on BCT algorithm.Subsequently,FCT is utilized to generate the gauge clouds corresponding to different anomaly levels as High,Medium,and Low for the characteristic of flow rate of traffic.Therefore,the gauge clouds of other six characteristics would be built the same way.
4.2 Implementation
Section 1:Single Traffic Analysis of DoS.
In this section,certain traffic within the DoS category from DB-VEF is selected to demonstrate the YATA method to check it could determine the degree of anomaly for this traffic.
First,gain the Matrix.The sample of DoS traffic extracted from DB-VEF is denoted as F1 and has the following characteristics:average rate is 9.6M Pkt/Min,average duration of single connection lasts for 70.4 ms,failure connections ratio per unit time is up to 25.1%,and average length of packet is 51 Bytes,etc.Next,each of the 7 characteristics is compared with the corresponding gauge cloud respectively,to obtain the decision matrix following the process which is illustrated in Fig.4.Because there are 7 characteristics and 3 levels (H,M,L),the 7×3 Matrix-F1 is calculated as follows.

Secondly,gain the WD-F1 based on Matrix-F1.According to the importance and influence of every characteristic as well as the different levels of anomaly,we have the weight specifications as shown in Tab.3 and Tab.4.

Table3:Weight Specifications for Levels
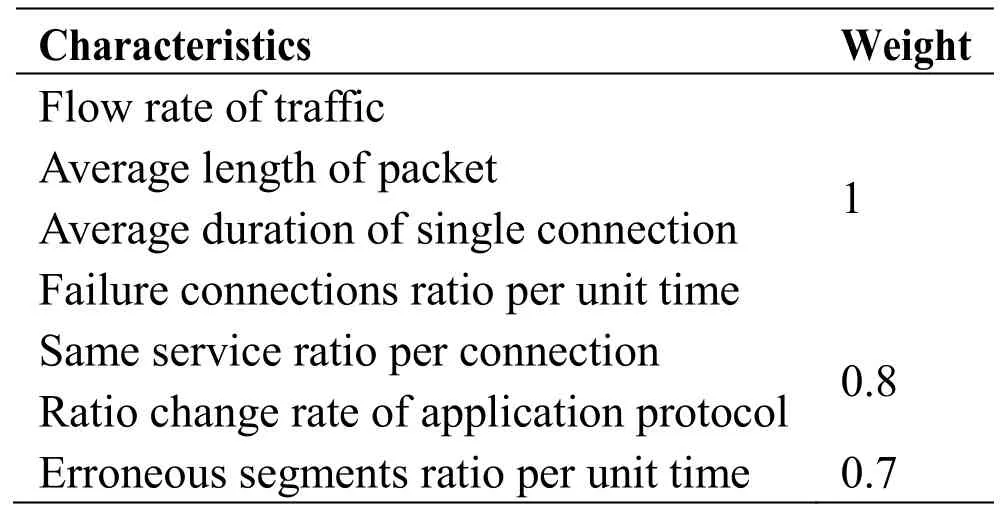
Table4:Weight Specifications for Characteristics
Therefore,the WD-F1 shown below would be obtained through formula (10):

Thirdly,BCT algorithm would be used to calculate Expectation,Entropy and Hyper Entropy according to the different levels of High/Medium/Low based on WD-F1.
·ExH= 0.708,EnH= 0.113,HeH= 0.035
·ExM= 0.336,EnM= 0.056,HeM= 0.026
·ExL= 0.118,EnL= 0.026,HeL= 0.009
Finally,FCT algorithm would be adopted to generate evaluation clouds combined with the above parameters.
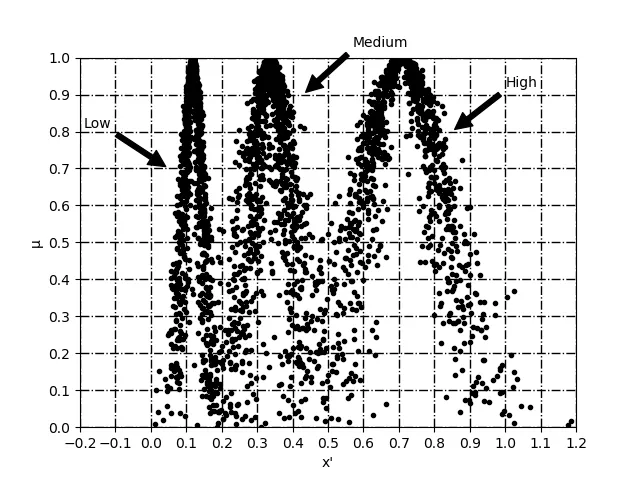
Figure6:Evaluation clouds of F1 including three anomaly levels
As depicted in Fig.6,three peaks correspond to the evaluation clouds of High/Medium/Low levels.In each area every dot represents a cloud drop,namely dropi=(xi,μi) where μiindicates the degree of certainty that xibelongs to the qualitative concept of anomaly traffic.
It can be seen from the diagram that the majority of the cloud evaluations have a level of High which represents the highest degree of membership.Therefore,the evaluation cloud of level High should be focused on to reflect the current situation of traffic,compared with Medium and Low levels.
The sample traffic F1 whose average rate is up to 9.6M Pkt/Min,significantly indicating a DoS attack.Moreover,considering that the failure connections ratio is 25.1% and the single connection average duration lasts for 70.4 ms both fall into the high gauge level estimated by experts.Therefore,the evaluation cloud of High level preferably reflects the anomaly degree of the F1.
Section 2:Single Normal Traffic Analysis.
At this time,certain normal traffic from DB-VEF would be selected to demonstrate the ability of YATA method to distinguish whether the traffic is suspected anomalous or not.The normal traffic marked as F2 covers the following characteristics:average rate is 3.4K Pkt/Min,average duration of single connection lasts for 175.2 s,failure connections ratio per unit time is less than 0.3%,and average length of packet is 684 Bytes,etc.The decision matrix of F2,together with WD-F2 could be obtained as follows.
WD-F2 and evaluation clouds would be calculated based on BCT and FCT algorithms consequently.Therefore,the Ex,En and He values are:
·ExH= 0.082,EnH= 0.022,HeH= 0.008
·ExM= 0.196,EnM= 0.061,HeM= 0.152
·ExL= 0.244,EnL= 0.031,HeL= 0.136
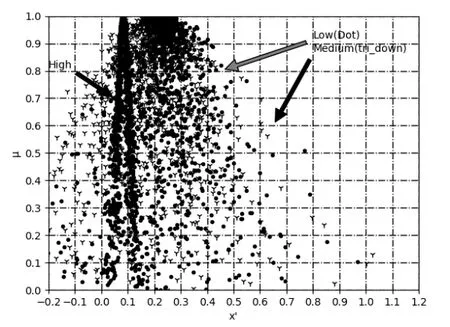
Figure7:Evaluation clouds of F2 including three anomaly levels
In Fig.7,there exist three areas respectively indicating the evaluation clouds of High/Medium/Low levels for traffic F2.It is quite different from Fig.6,because here the Low evaluation cloud and Medium evaluation cloud are partly overlapping.At the same time,they are both cluster to the right of the High evaluation cloud,which means that the F2 sample traffic is very probably normal.
Section 3:Multiple Traffic Analysis.
In order to implement comparisons between different typesoftraffic,a sample of Probe traffic is extracted from DB-VEF denoted as F3,which has the following characteristics:average rate is 0.8K Pkt/Min,average duration of single connection lasts for 89.7 ms,failure connections ratio per unit time is up to 4.1%,and average length of packet is 135 Bytes,etc.The decision matrix of F3,together with WD-F3 could be obtained as follows:
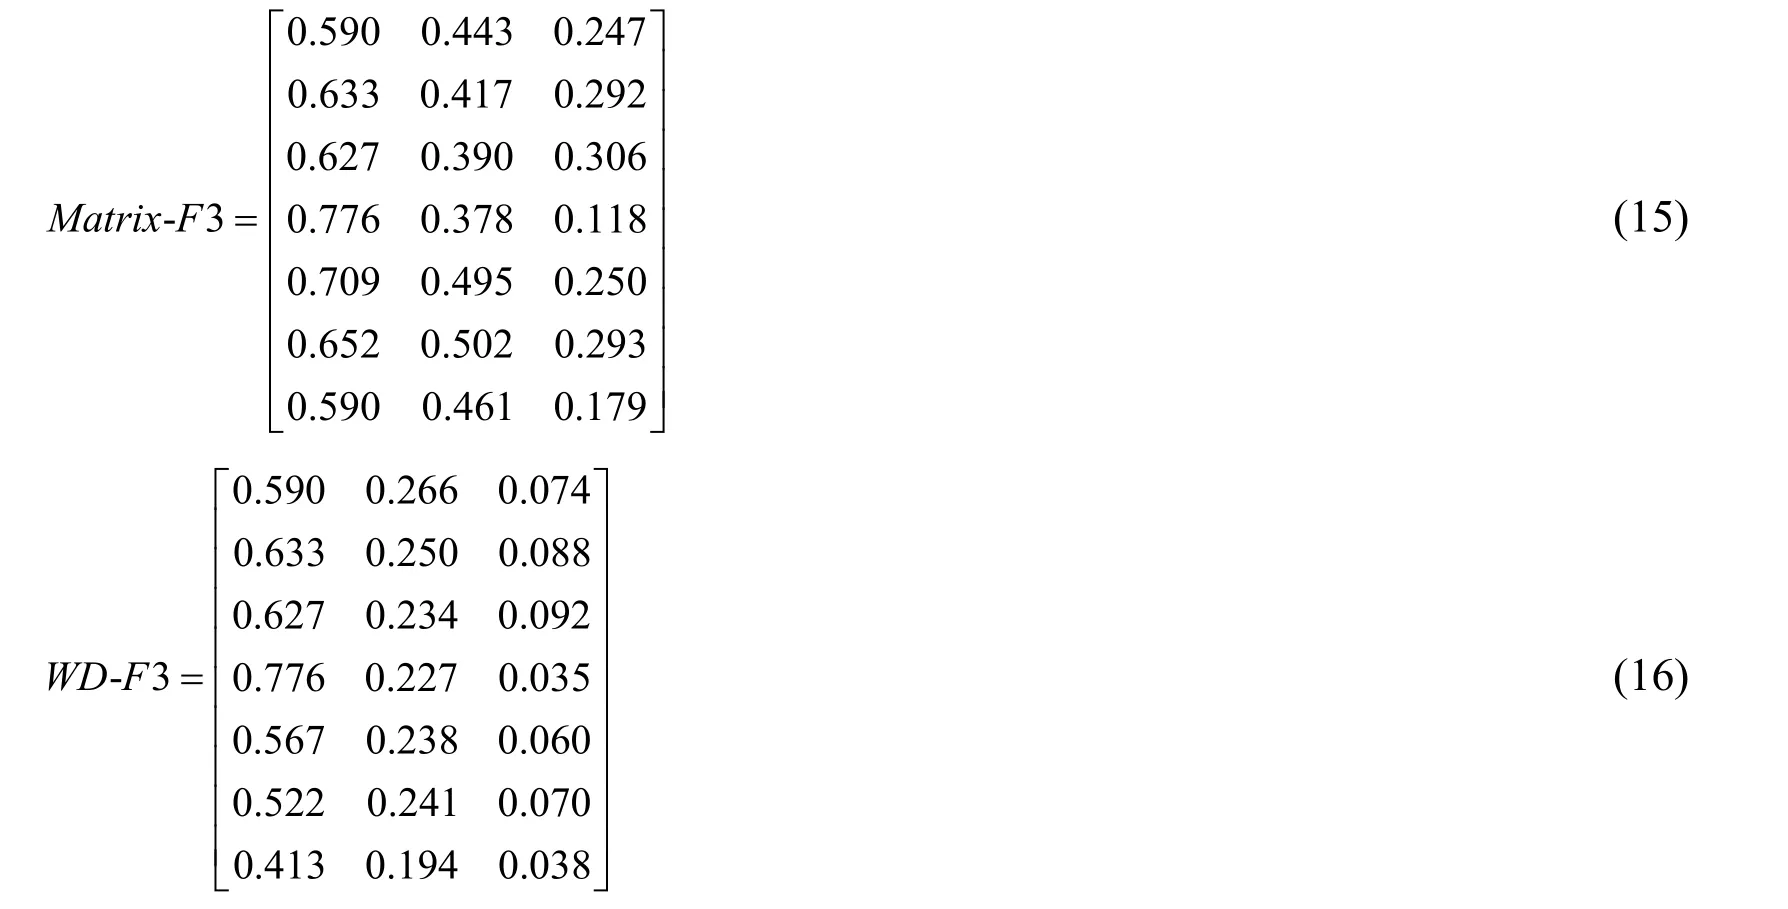
Then,WD-F3 and evaluation clouds would be calculated based on BCT and FCT algorithms consequently.
·ExH= 0.708,EnH= 0.113,HeH= 0.035
·ExM= 0.336,EnM= 0.056,HeM= 0.026
·ExL= 0.118,EnL= 0.026,HeL= 0.009
Similarly in Fig.8,there are three areas describing the evaluation clouds of High/Medium/Low levels for sample F3.Still the evaluation cloud of High level is moved prominently to the right which means it is the most persuasive indicator of underlying situation.Because evaluation cloud of High level locates on the right side of the middle,showing that it is in a slightly invaded situation,and generally in conformity with the situation of Probe attack.
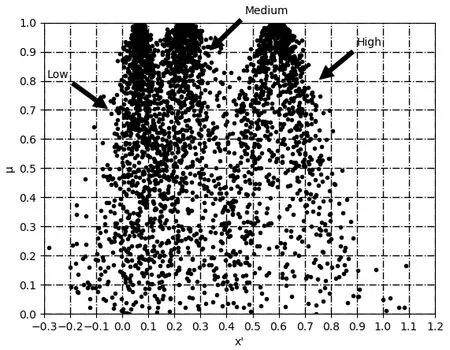
Figure8:Evaluation clouds of F3 including three anomaly levels
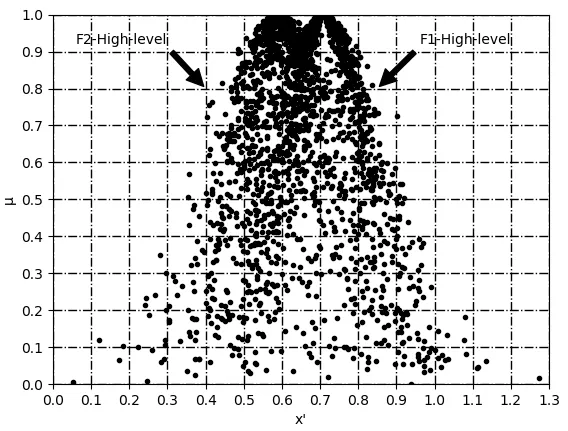
Figure9:Comparison of F1 and F3
In aspect of the High level cloud from Fig.9,it is obvious that F1 is grouped to the right of F3,which means F1 behaves more anomalous than F3.Since F1 comes from DoS traffic part of DB-VEF,while F3 comes from the Probe,the result illustrated in Fig.9 shows good consistency with the varied sortsoftraffic,and verifies the effectiveness of YATA,which could reveal the extent of anomaly from a qualitative point of viewin a convenient and intuitive way.
5 Conclusion
To protect the network from being exploited by malicious traffic,we propose an anomaly traffic detection and determination method named YATA.In virtue of the Cloud Model,this method is capable of transforming quantitative data to the qualitative concept rapidly and directly,which improves the expressivenessoftraffic situation for the security administrators to take further measures.We deploy and demonstrate the feasibility of this method based on KDD Cup 1999.
Acknowledgement:We would like to present our thanks to any anonymous reviewers for their helpful suggestions.This work is supported in part by National Natural Science Foundation of China (No.61802115),Henan province science and technology projects(Nos.182102310925,192102310445),Key Scientific Research projects of Henan Province Education Department (Nos.18A520004,19A520008).
 Computers Materials&Continua2019年9期
- Computers Materials&Continua的其它文章
- Retinal Vessel Extraction Framework Using Modified Adaboost Extreme Learning Machine
- Dynamic Analysis of a Horizontal Oscillatory Cutting Brush
- Localization Based Evolutionary Routing (LOBER) for Efficient Aggregation in Wireless Multimedia Sensor Networks
- Failure Prediction,Lead Time Estimation and Health Degree Assessment for Hard Disk Drives Using Voting Based Decision Trees
- High Precision SAR ADC Using CNTFET for Internet of Things
- An Efficient Greedy Traffic Aware Routing Scheme for Internet of Vehicles
