Retinal Vessel Extraction Framework Using Modified Adaboost Extreme Learning Machine
B.V.SanthoshKrishnaandT.Gnanasekaran
Abstract:An explicit extraction of the retinal vessel is a standout amongst the most significant errands in the field of medical imaging to analyze both the ophthalmological infections,for example,Glaucoma,Diabetic Retinopathy (DR),Retinopathy of Prematurity (ROP),Age-Related Macular Degeneration (AMD) as well as non retinal sickness such as stroke,hypertension and cardiovascular diseases.The state of the retinal vasculature is a significant indicative element in the field of ophthalmology.Retinal vessel extraction in fundus imaging is a difficult task because of varying size vessels,moderately low distinction,and presence of pathologies such as hemorrhages,microaneurysms etc.Manual vessel extraction is a challenging task due to the complicated nature of the retinal vessel structure,which also needs strong skill set and training.In this paper,a supervised technique for blood vessel extraction in retinal images using Modified Adaboost Extreme Learning Machine (MAD-ELM) is proposed.Firstly,the fundus image preprocessing is done for contrast enhancement and inhomogeneity correction.Then,a set of core features is extracted,and the best features are selected using “minimal Redundancy-maximum Relevance (mRmR).” Later,using MAD-ELM method vessels and non vessels are classified.DRIVE and DR-HAGIS datasets are used for the evaluation of the proposed method.The algorithm’s performance is assessed based on accuracy,sensitivity and specificity.The proposed technique attains accuracy of 0.9619 on the DRIVE database and 0.9519 on DR-HAGIS database,which contains pathological images.Our results show that,in addition to healthy retinal images,the proposed method performs well in extracting blood vessels from pathological images and is therefore comparable with state of the art methods.
Keywords:Extreme learning machine,ophthalmology,segmentation,adaboost,feature extraction,supervised,contrast enhancement.
1 Introduction
Typically,retinal vessels are an exclusive part of an individual’s blood circulation system that can be seen instantly without invasion [Resnik of f,Pascolini and Etyaale (2004)].The retinal vasculature examination can diagnose numerous primary pathologies,such as diabetes,hypertension,AMD,and cardiovascular disease.Furthermore,the characteristics of the retinal vessel,such as width,tortuosity,branching pattern,and angles,play a significant role in earlier disease identification.Also,multiple obsessive retinal vessel abnormalities are instant impressions of eye diseases.For example,consider diabetic retinopathy disease,India is set to evolve as the World’s diabetic capital.According to World Health Organization (WHO),in the year 2000,31.7 million people in India were affected by diabetes mellitus (DM).This number is expected to increase to 79.4 million by 2030,the most significant figure in the world in any Nation.About two-thirds of all type-2 diabetes and almost all type-1 diabetes are forced to develop diabetic retinopathy over a period [Gadkari,Maskati and Nayak (2016)].Automatic extraction of retinal vessels with high accuracy and reliability is highly essential to spare medical resources and decrease physicians’ workload [Winder,Morrow,Mcritchie et al.(2009)].2D color fundus image and 3D optical coherence tomography (OCT) images are widely accepted for clinical markers of retinopathy and are usually used for ophthalmic observations.In most clinical analyzes and larger-scale screening,fundus images are used more frequently due to computational simplicity and low-cost attributes.Furthermore,lesions can be evidently noticed in fundus images [Abram of f,Garvin and Sonka (2010)].Color fundus healthy and pathological image with lesions is shown in Fig.1.This article,therefore,focuses on automated segmentation of retinal vessels in 2D fundus image based on feature selection and modified extreme learning machine with Adaboost classifier.

Figure1:Fundus image a.Healthy,b.Glaucoma,c.Diabetic Retinopathy
2 Prior works
During the past decade,the problem of computerized retinal vessel segmentation has brought an enormous amount of interest.Researchers have proposed many algorithms[Fraz,Remagnino,Hoppe et al.(2012)].Comprehensively retinal vasculature segmentation methods might be categorized into two,supervised and unsupervised.In the case of unsupervised methods,the structural attributes of vessels are manually hardcoded,and also learning is bound or sometimes absent.Regarding supervised methods,algorithms are generally trained by learning from patches of images annotated by gold standard images.Some of the predominant categories in unsupervised approaches are matched filtering,morphological transformations,and vessel tracking.In Hoover et al.[Hoover,Kouznetsova and Goldbaum (2000)],a matched filter-based method is projected in which a matched filter is applied by convolving a retinal fundus image with twelve kernels.A 2D linear structuring component is used for vessel enhancement by extracting with their derivatives and Gaussian intensity pr of ile of retinal blood vessels.In Rangayyan et al.[Rangayyan,Oloumi,Eshghzadeh-Zanjani et al.(2007)],Gabor filters are designed for the detection and extraction of blood vessels.But this technique struggles from over detection and extraction of blood vessel pixels due to the implementation of a large number of false edges.In Mendonca et al.[Mendonca and Campilho (2006)],morphological transformations with curvature data and matched centerline detection filtering are shown.In another method [Villalobos-Castadldi,Felipe-Riveron and Sanchez-Fernandez (2010)],a co-occurrence matrix is computed from just an image patch,and a decision has to be made by thresholding a feature estimated from that matrix.Vessels are obtained using a mixture of Gaussian filters with co-linear variations in Azzopardi et al.[Azzopardi,Strisciugli,Vento et al.(2015)].Sophisticated active contour model [Zhao,Rada,Chen et al.(2015)] is employed in which both pixel brightness and features are extracted from and image.In Zhu et al.[Zhu,Zou,Zhao et al.(2017)],39 D features are extracted and classified using an extreme learning machine.
3 Proposed method
Firstly,the fundus image is preprocessed for contrast enhancement and inhomogeneity correction.A set of 40 core features are extracted and the best features are selected using“minimal Redundancy maximal Relavance” algorithm and trained using modified ELM with adaboost classifier as vessel or non vessel.The output of the classifier is the binary retinal vasculature image.Using ground truth image as reference,accuracy,sensitivity and specificity are measured in the testing stage.The flow diagram of the proposed method is shown in Fig.2.
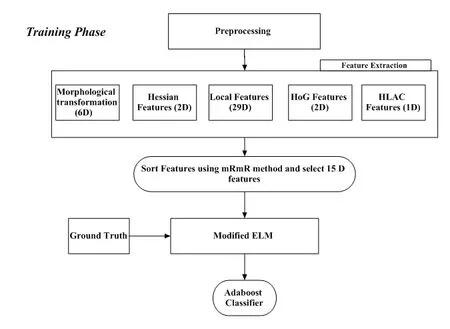
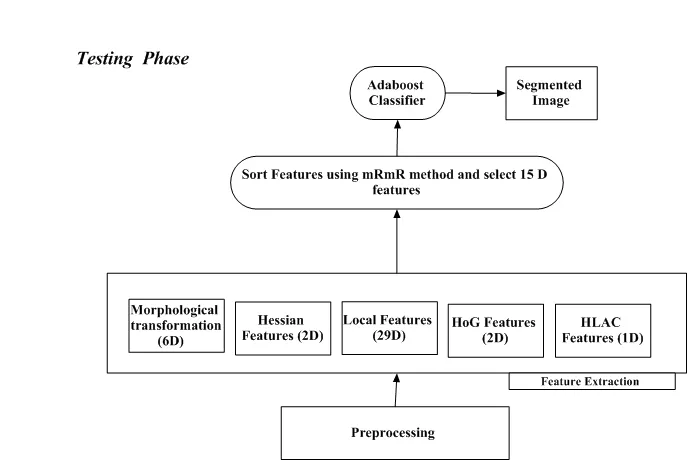
Figure2:Flow diagram of proposed method
3.1 Preprocessing
Color fundus images tend to low contrast,central reflex light,noise,and therefore preprocessing is inevitable.Preprocessing comprises of the e following steps.(i) Central light reflex removal,(ii) background homogenization,and (iii) Boundary extension.
3.1.1 Central light reflex removal
Due to the property of low reflectance of blood vessels,they appear to be darker relative to the background and may contain a light streak (Acknowledged as a light reflex).To remove the light reflex,a green channel of the fundus image is used.A filtering procedure is implemented over the green channel image using a morphological opening as a structuring element with a three-pixel diameter disk to expel the reflex effect.The green channel indicates a gray background level that is higher than the gray vessel level.
3.1.2 Background homogenization
Retinal fundus images are connected with a background intensity variation due to nonuniform illumination.Sometimes the background images’ gray level is higher than the pixels of the e vessels.This variation in the background pixel may impair the segmentation quality of the vessel.Contrast limited adaptive histogram equalization (CLAHE)technique is applied across the central light reflex light removal image to prevent this issue.CLAHE avoids excessive noise amplification and evenly distributes the used gray level value,thus improving the visibility of the image’s concealed characteristics.
3.1.3 Boundary extension
The artifacts produced near the camera aperture boundary are removed using a boundary expansion method suggested in Azzopardi et al.[Azzopardi,Strisciguli,Vento et al.(2015)].Firstly,each black pixel lying only on the Field of View (FOV) mask’s external boundary is identified.The mean value of their neighbors’ pixels within the region of interest (ROI) replaces each of these pixels.Following the primary iteration,the ROI span is increased by 2.To keep away false discovery of lines around the FOV fringe,this procedure is repeated multiple times,so that the ROI radius is ultimately increased by 50.
3.2 Extraction of features
3.2.1 Local features (26)
The first feature (1D) in the green channel image is considered to be the intensity of each pixel.Next,2D Gaussian filtering will provide four features (4D) using four scales.By emphasizing the edges of retinal vessels,eight features are obtained by using first-order derivatives of 2D Gaussian filtering.Similarly,second-order Gaussian filtering derivatives yield 12 features by addressing zero-crossings [Lindeberg (1998);Wang (2013)].
3.2.2 Morphological transform features (6)
Using the Tophat morphological operation,the smallest details in an image is extracted.This tophat function is used on dark background for lighter objects,whereas the bottom hat function is applied to the light background for dark objects.Tophat transform is applied by a closing operation as,

whereTbt(f)is top hat function,(·) is the closing operation,b is the structuring element,f is the filtered image.In this paper tophat transform is used to extract features with a linear structuring element of multiscale and multi orientation.Using six scales,we get six features [Fraz,Remagnino,Hoppe et al.(2012)].
3.2.3 Hessian features (2)
The Hessian matrix can characterize a point on the local shape of the surfaces given by,

whereSxx,Syx,SxyandSyyis the second order partial derivatives of the e imageI(x).By calculating the vesselness measure (V) and Forbenius norm (S),two features are obtained[Frangi,Niessen,Vincken et al.(1998)].
3.2.4 HoG features (2)
Histogram of Gradients (HoG) is a feature descriptor frequently used for retinal vessel segmentation.This method requires the occurance of portions of the e image into consideration.The image is fragmented into tiny connected cells and thus the pixels within each cell are plotted with a histogram of gradients.Here we have considered two features:Energy and Entropy,if X is any value,energy is E=X2and entropy,Ent=-sum(p*log(2)),where ‘p’ is the number of histogram [Zhu,Zou,Zhao et al.(2017)] is entropy.
3.2.5 HLAC feature (1)
The local high order autocorrelation (HLAC) feature is computed from the higher auto correlation of the following order using a reference pixel and its adjacent pixels as given by,

D is the target image region for feature extraction,r is the reference pixel position,I(r) is the brightness value of the reference pixel r and anwhere (n=1,2,3..) is the space between the reference and adjacent pixel.All displacements are measured around a reference pixel in a 3*3 pixel area in our method.Here we can extract one HLAC feature [Thangaraj,Periyasamy and Balaji (2018)].
3.3 Feature Selection using mRmR method
We used the minimal Redundancy maximal Relevance (mRmR) method proposed by Peng et al.[Peng,Long and Ding (2005)] to select the most discriminatory features from the extracted features.Using the maximum relevance criterion based on mutual information,the mRmR technique selects the most informative features while minimizing redundancy between features and has gained significant prominence,particularly in biomedical data analysis.Features chosen according to max relevance are probable to have rich redundancy.If two features are extremely mutually dependent,the dependency between these features could be large.If one of them were removed,the respective class discriminative power would not change.
3.4 Feature selection using mRmR method
An Extreme Learning Machine (ELM) is a single hidden layer feed-forward neural network (SLFN) type containing later hidden node in which the minimum square regression addresses the hidden input weights.The algorithm tends to deliver the best performance in generalization at extremely fast learning speed.The main idea in basic ELMinvolves the weights of the e hidden layer.Besides,biases are the least square solution [Huang,Wang and Lan (2011)].With the impression of the multiclass method[Shen,Jiang and Liu (2014)],the proposed process takes the ELMas primary classifier[Jiuwen,Lin,Huang et al.(2012)] and uses Adaboost as a binary classification problem to resolve the retinal segmentation with the proposed Modified Adaboost Extreme Learning Machine (MAD-ELM).
Given that N training samples,

wherexiis the ithtraining sample,andyiis the corresponding class label,
a.Initially,the weights of each training sample are to be set as per the class frequency
b.For every iteration,q=1- Q,where Q is the total number of weak classifiers.Then,
i.Fit a weighted ELM classifierWELMq(x)to the training samples with sample weightwi
ii.Next the corresponding weighted error ofWELMq(x)is calculated.

iii.Weight of qthclassifier is calculated as

iv.Update the weight of sample data for all i=1,2,3…,N

v.Renormalize the sample weight
Note:The algorithm repeats steps (i) to (v) till for ‘T’ times
c.Finally,the corresponding number of weak classifiers will be developed efficiently after T times,resulting in a powerful classifier being generated.Using the voting system,the weak classifiers are mixed linearly with their respective weight and a powerful classifier is acquired.

4 Evaluation and experimental results
After the above steps.The fundus image pixels are divided into two classifications:vessels and background.To determine whether a proposed algorithm is effective or not,known standard performance measurement is required.The results of the e segmentation of the fundus image vessel are compared with the gold standard image segmented by manually by an expert.Classification results of all the pixels in Tab.1 that belongs to one of the four results.The true positive (TP) is the number of pixels properly categorized as vessels.False Positive (FP) is the number of pixels wrongly classified as vessels.True Negative (TN) is the number of pixels properly categorized as backgrounds,with False Negative (FN) being the number of pixels wrongly classified as backgrounds.
Accuracy (Acc),Sensitivity (Se),and Specificity (Sp) are used to evaluate vessel segmentation quality as shown in Tab.2.

Table1:Pixel based classification

Table2:Performance Measures for vessel segmentation evaluation
We evaluated the proposed algorithm on two publicly available databases DRIVE and DR-HAGIS.All experiments are conducted on Matlab 2015 intel core i5 8 GB DDR4-2400 RAM 3.4 GHz.
4.1 Database
4.1.1 DRIVE
To evaluate our proposed algorithm,we used a publicly available dataset DRIVE (Digital Retinal Images for Vessel Extraction) [Stall,Abram of f,Niemeijr et al.(2004)].DRIVE dataset contains 40 color fundus images.These images have been taken with a Field of View (FOV) and 768*584 pixels CCD camera.The dataset was separated into two sets,namely the training and testing with 20 images in each set.For the images in the test set,there are two manual segmentations of retinal vasculature,whereas for the images in the training set,there is a single manual segmentation result.
4.1.2 DR-HAGIS
DR-HAGIS database [Holm,Russell,Nourrit et al.(2017)] comprises of four subgroups of co-morbidity consisting of glaucoma (1-10),hypertension (11-20),diabetic retinopathy(21-30),age-related macular degeneration (31-40) pathology images.The fundus images are photographed using Topcon TRC-NW 6s,Topcon TRC-NW 8 or a canon CR DGI fundus camera.The images are 4752×1880 pixels.Besides,all images are provided with manually segmented images.
4.2 Experiments using proposed method on DRIVE database
Experiments are performed on DRIVE dataset.20 test images are used for the evaluation of the proposed algorithm.Classifier training took 230 in our experimentation.The DRIVE dataset experimental results are shown in Tab.3.Our method achieved sensitivity,specificity,and accuracy of 0.7432,0.9836,0.9616 respectively.
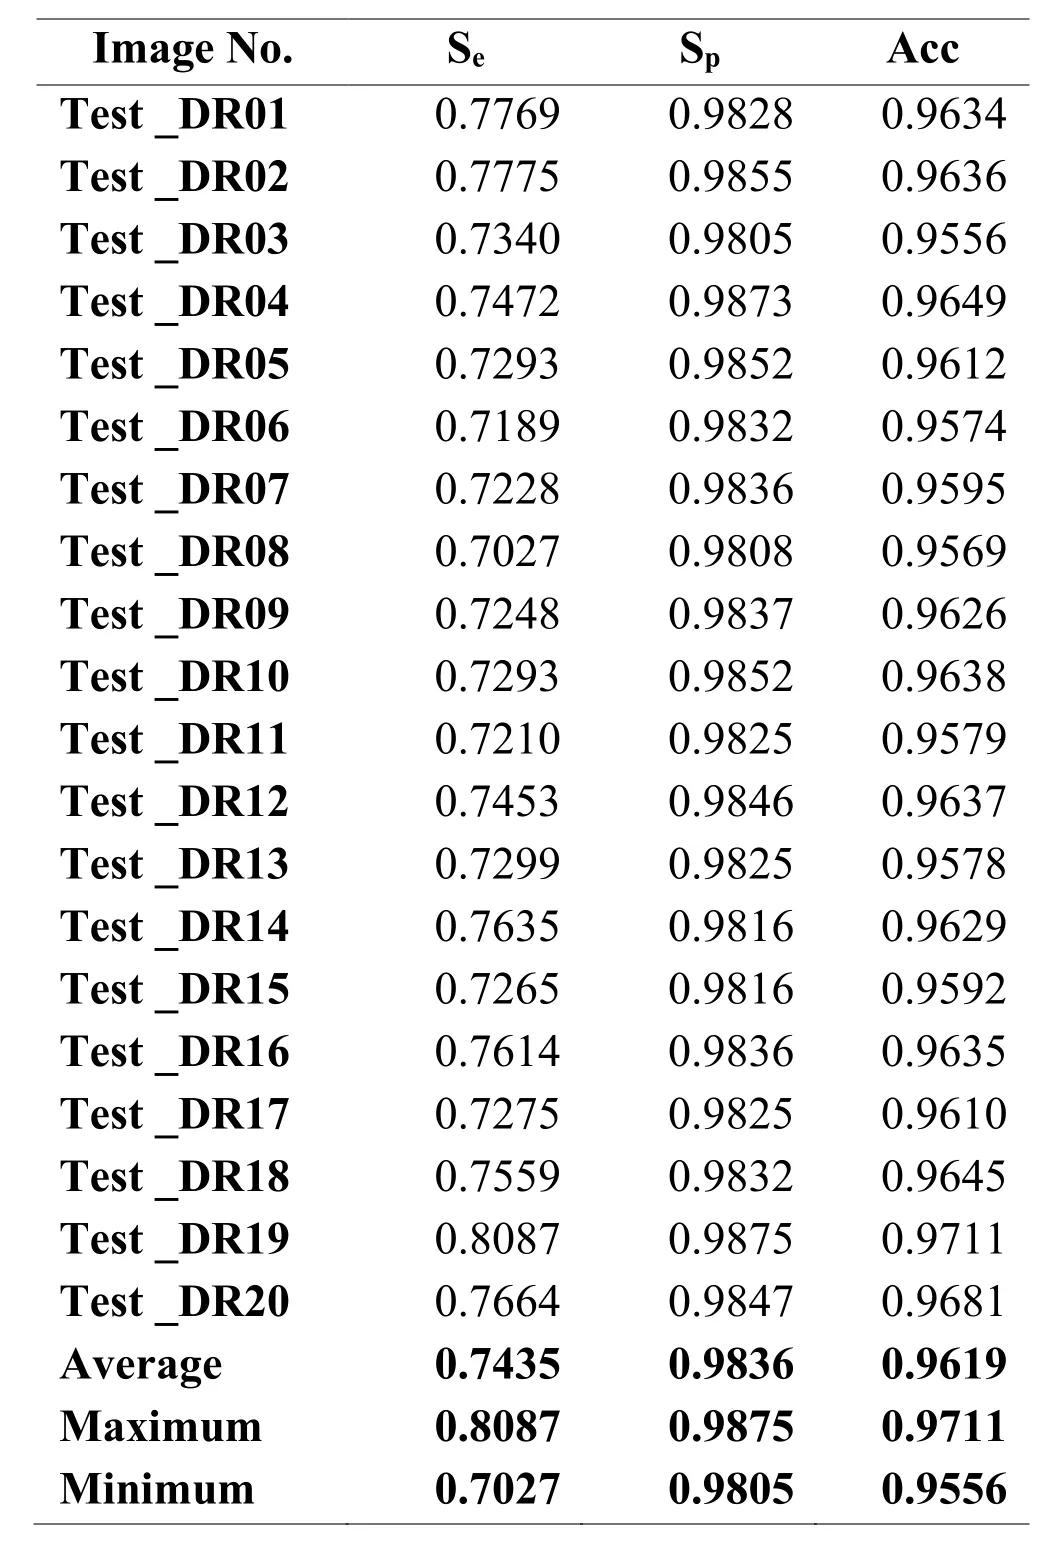
Table3:Segmentation results of our method (DRIVE)
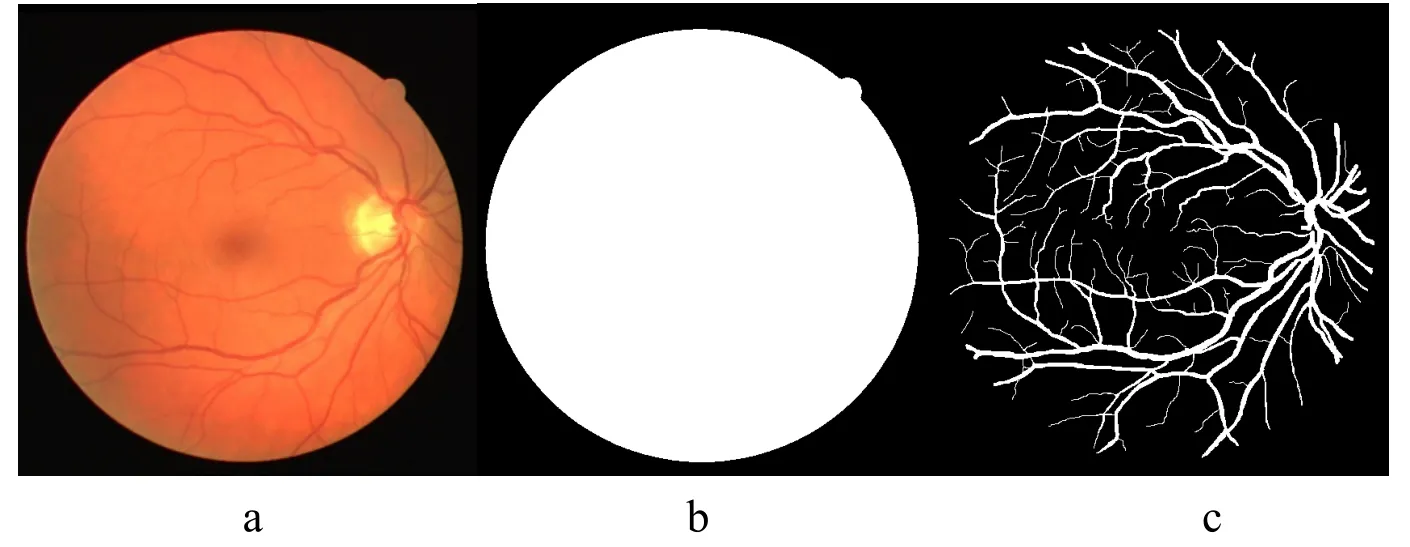

Figure3:a.Fundus image,b.Mask image,c.Ground Truth,d.enhanced image,e.segmented output,f.segmented image overlapped on fundus image
4.3 Experiments using proposed method on DR-HAGIS database
Classifier took around 550 seconds for training on DR-HAGIS database.The DR-HAGIS dataset experimental results are shown in the Tab.4-Tab.8.Our method achieved sensitivity,specificity and accuracy of 0.7331,0.9586 and 0.9519 respectively.
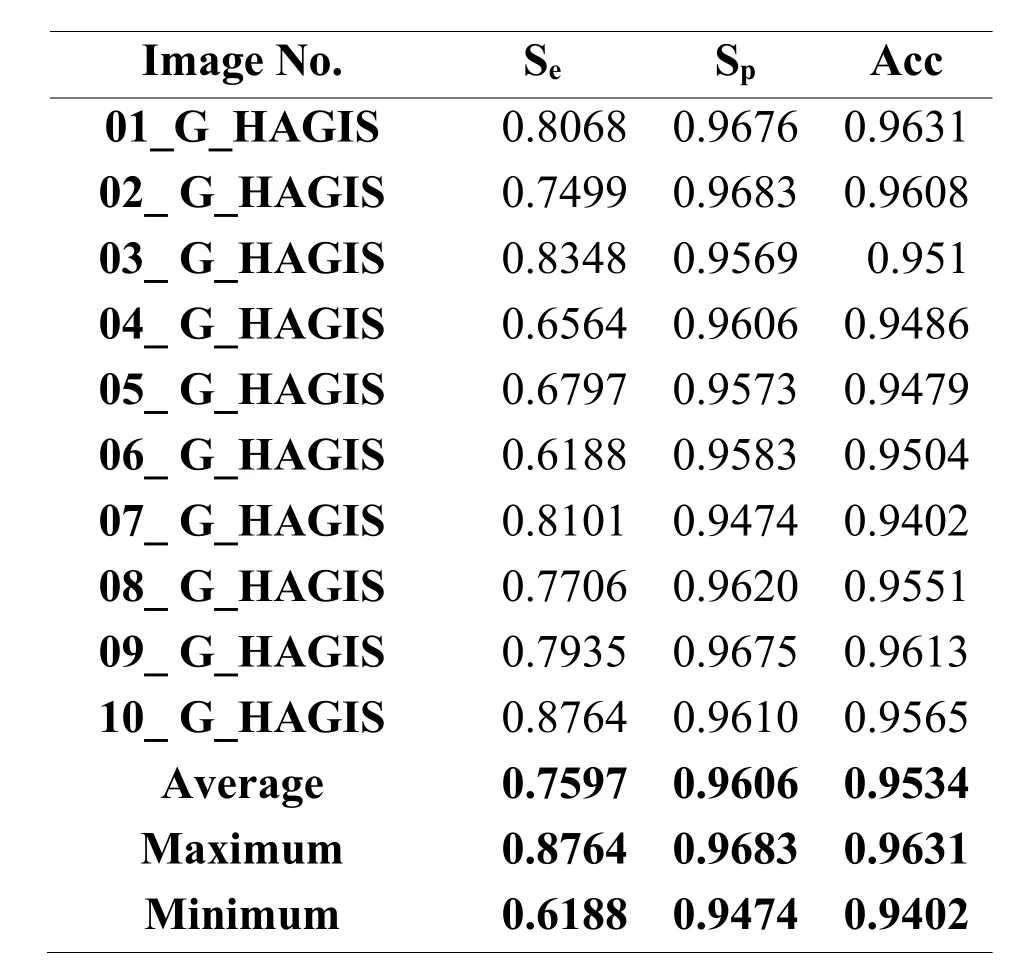
Table4:Segmentation results (HAGIS-Glaucoma group)
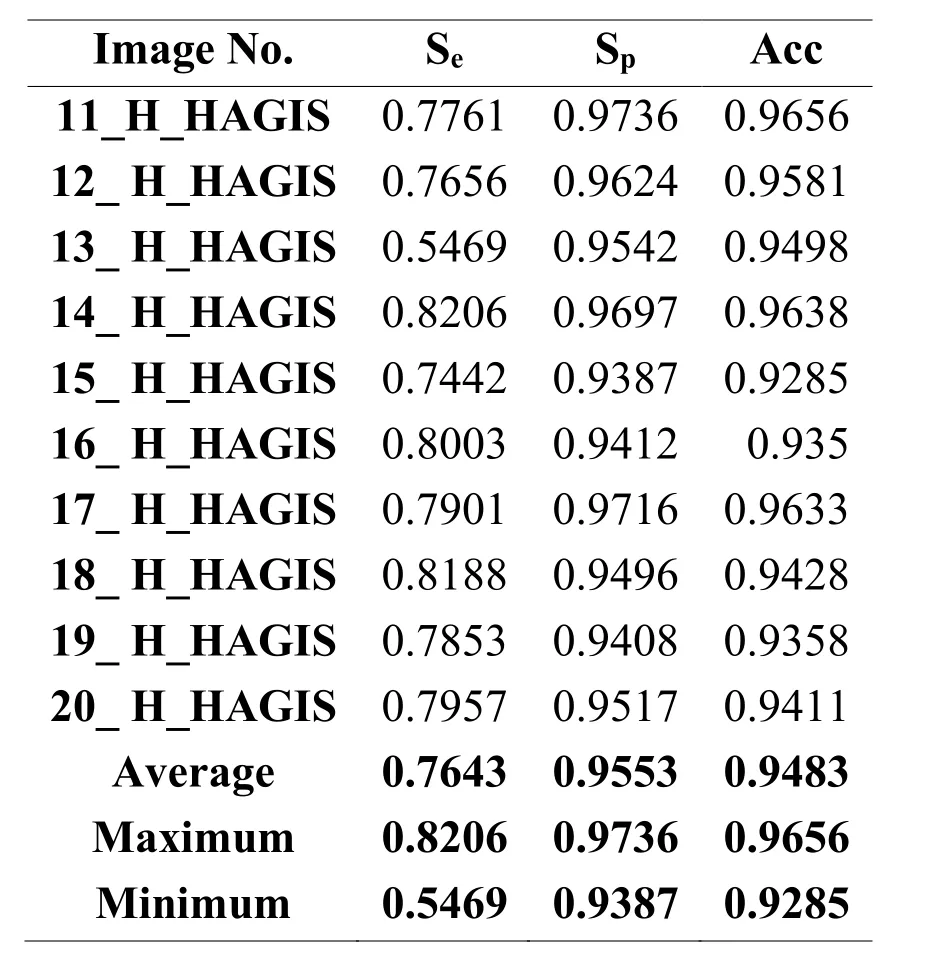
Table5:Segmentation results (HAGIS-Hypertension group)
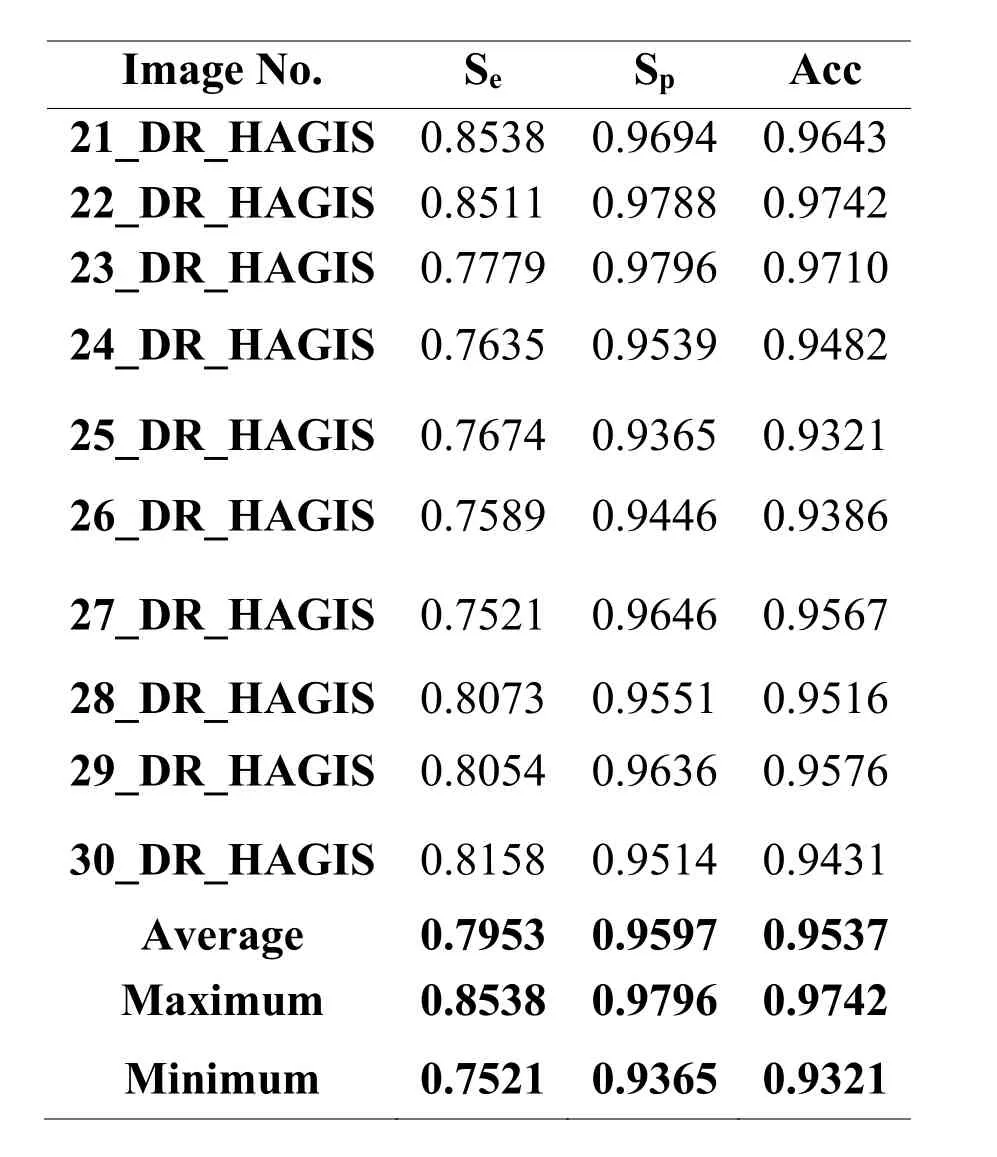
Table6:Segmentation results (HAGIS- Diabetic Retinopathy group)
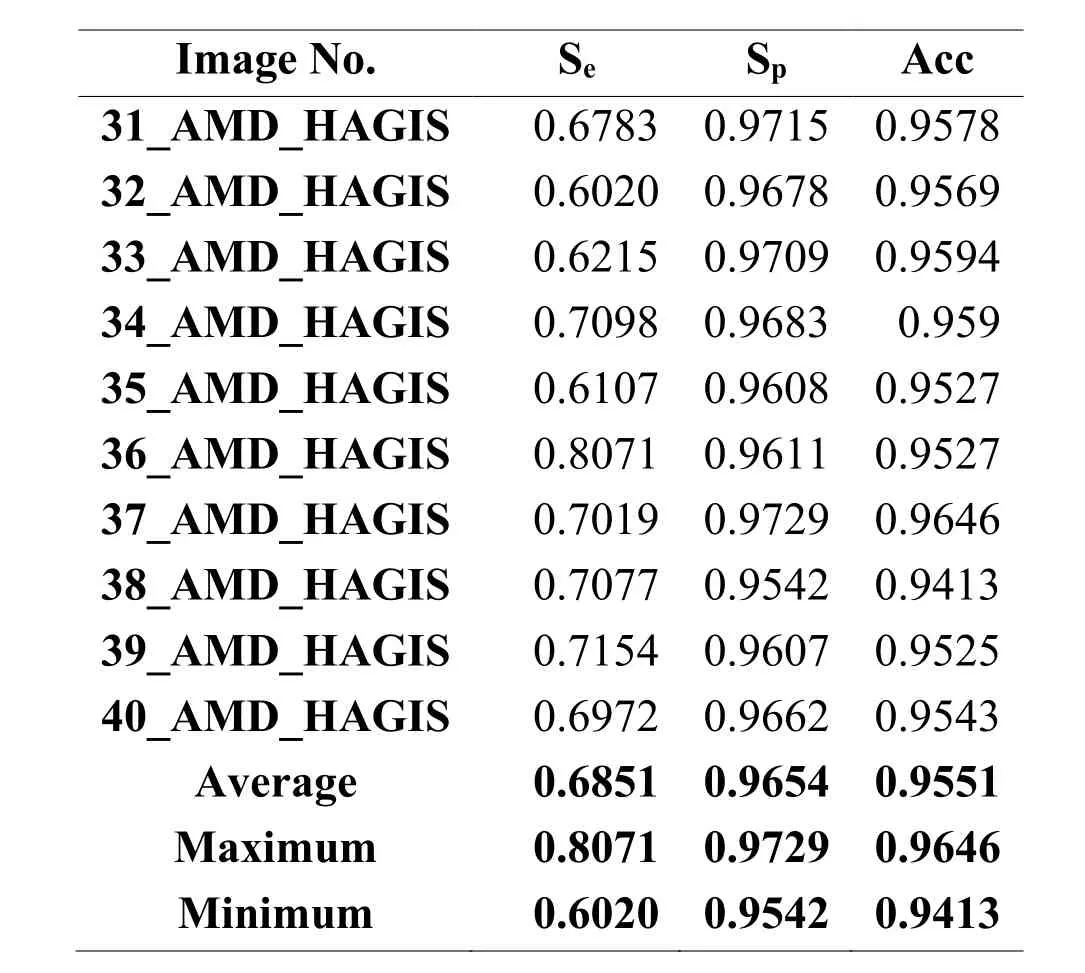
Table7:Segmentation results (HAGIS-AMD group)
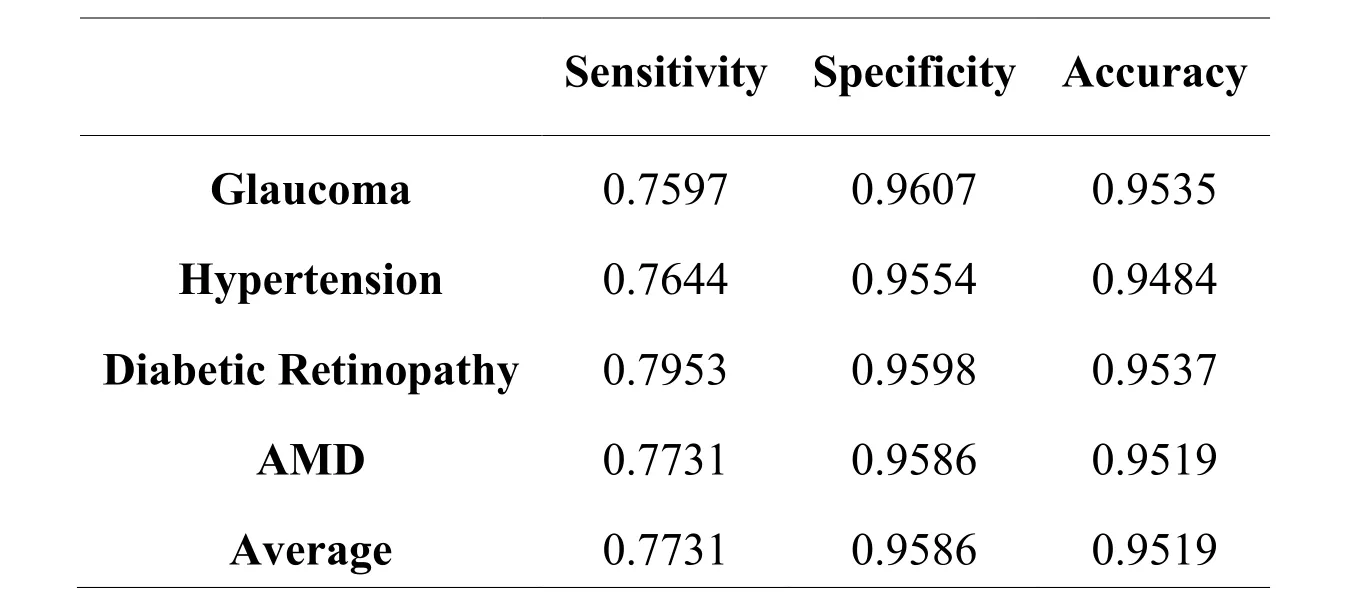
Table8:Performance evaluation on DR-HAGIS
4.4 Comparison with other supervised methods
Tab.9 demonstrates the comparison results on the DRIVE database between the proposed technique and other states of the e art methods.Experimental results show that the proposed approach works better than many other supervised methods.To our know ledge,evaluation on DR-HAGIS database by supervised methods is not available in the literature.Hence,the comparison was not made on DR-HAGIS database,but we believe that the results obtained are better on a pathological database.
5 Conclusion
In this article,we proposed a supervised technique for retinal blood vessel segmentation based on the extraction of features,selection of features,and a modified AdaBoost ELM classification.The supervised method of learning performs better in retinal vessel segmentation than unsupervised methods.Although supervised methods are notoriously expensive in training,they provide better results.Experimental results from the proposed method have shown that they are best suited for automated retinal disease screening and diagnosis.
 Computers Materials&Continua2019年9期
- Computers Materials&Continua的其它文章
- Dynamic Analysis of a Horizontal Oscillatory Cutting Brush
- Localization Based Evolutionary Routing (LOBER) for Efficient Aggregation in Wireless Multimedia Sensor Networks
- Failure Prediction,Lead Time Estimation and Health Degree Assessment for Hard Disk Drives Using Voting Based Decision Trees
- High Precision SAR ADC Using CNTFET for Internet of Things
- An Efficient Greedy Traffic Aware Routing Scheme for Internet of Vehicles
- GaiaWorld:A Novel Blockchain System Based on Competitive PoS Consensus Mechanism
