
Synchronization between frontal eye field and area V4 during free-gaze visual search
2019-10-29 01:14TingYanHuiHuiZhou1ShenzhenInstitutesofAdvancedTechnologyChineseAcademyofSciencesShenzhenGuangdong518055China
Zoological Research 2019年5期
Ting Yan,Hui-Hui Zhou1 Shenzhen Institutes of Advanced Technology,Chinese Academy of Sciences,Shenzhen Guangdong 518055,China
ABSTRACT Information flow between the prefrontal and visual cortices is critical for visual behaviors such as visual search. To investigate its mechanisms, we simultaneously recorded spike and local field potential (LFP) signals in the frontal eye field (FEF)and area V4 while monkeys performed a free-gaze visual search task. During free-gaze search, spike-LFP coherence between FEF and V4 was enhanced in the theta rhythm (4-8 Hz) but suppressed in the alpha rhythm (8-13 Hz). Cross-frequency couplings during the Cue period before the search phase were related to monkey performance, with higher FEF theta-V4 gamma coupling and lower FEF alpha-V4 gamma coupling associated with faster search.Finally, feature-based attention during search enhanced spike-LFP coherence between FEF and V4 in the gamma and beta rhythms, whereas overt spatial attention reduced coherence at frequencies up to 30 Hz. These results suggest that oscillatory coupling may play an important role in mediating interactions between the prefrontal and visual cortices during visual search.
Keywords: Synchronization; Frontal eye field (FEF);V4;Visual search
INTRODUCTION
Visual search, which incorporates active scanning of the visual environment for a particular object (target) among other objects (distracters), is important in our daily life. Its neural mechanisms have been investigated extensively in the visual cortex, including the V1 (Dougherty et al., 2017; Spaak et al.,2012), V2 (Huang et al., 2018), and V4 (Mazer & Gallant,2003; Motter, 2018); inferior temporal cortex (IT) (Mruczek &Sheinberg, 2007); oculomotor areas, including the frontal eye field (FEF) (Mirpour et al., 2018), lateral intraparietal area(LIP) (Ong et al., 2017), supplementary eye field (SEF)(Purcell et al., 2012), and superior colliculus (SC) (Reppert et al., 2018); and other cortical areas such as the dorsal lateral prefrontal cortex (dlPFC) (Katsuki & Constantinidis, 2012).Although many studies have focused on individual brain areas, few studies have investigated the interactions among these areas in visual search (Buschman & Miller, 2007; Ibos et al.,2013;Sapountzis et al.,2018;Zhou&Desimone,2011).
Oscillation coupling is an important mechanism underlying neuronal interactions among brain regions (Salinas &Sejnowski, 2001; Zanos et al., 2018). A number of studies have shown that coherence across brain areas mediates important brain functions, such as selective attention (Das &Ray, 2018; Mock et al., 2018; Zhou et al., 2016), learning and memory (Liebe et al., 2012), decision-making (Amemiya &Redish, 2018; Pesaran et al., 2008), and sensory-motor processes (Yanagisawa et al., 2012). For example, covert spatial attention causes spike and local field potential (LFP)coherence to increase at the gamma band but to decrease at low frequency between the V4 and FEF (Gregoriou et al.,2009, 2012). During visual search, attention enhances spike-LFP coherence at the gamma frequency in V4 (Bichot et al.,2005), and LFP-LFP coherence at beta frequency between the prefrontal and posterior parietal cortices (Buschman &Miller, 2009). To the best of our knowledge, however, the role of coherence between the prefrontal and visual cortices during free-gaze visual search remains unknown.
In addition to phase coherence, cross-frequency phaseamplitude coupling, which measures the coupling of two oscillations with different frequencies, has also been proposed as a mechanism underlying coordination of neural activity across different brain regions (Canolty & Knight, 2010;Sweeney-Reed et al., 2014). Theta-gamma coupling, in which the phase of theta oscillation biases the power of the gamma waves, is the most common pattern found among crossfrequency couplings. Gamma power can also be modulated by alpha (Osipova et al., 2008), beta (Richter et al., 2017),and delta oscillations (Whittingstall & Logothetis, 2009). These cross-frequency couplings observed within brain areas are involved in multi-unit spike firing (Whittingstall & Logothetis,2009) and attentional selection (Lakatos et al., 2008). Thus far, however, the role of cross-frequency coupling among different brain regions, such as the prefrontal and visual cortices, has not been investigated during free-gaze visual search.
In the current study, we recorded multi-unit and LFP signals in the FEF and V4 simultaneously while monkeys performed a free-gaze visual search task. We examined spike-LFP coherence and cross-frequency phase-amplitude coupling in the two brain regions.
MATERIALS AND METHODS
General procedures
This study was carried out in strict accordance with the guidelines for the National Care and Use of Animals (China)as approved by the Institutional Animal Care and Use Committee (IACUC) of the Shenzhen Institutes of Advanced Technology,Chinese Academy of Sciences(approval ID:SIATIRB-160223-NS-ZHH-A0187-003).
Two male rhesus monkeys (Macaca mulatta) weighing 11-15 kg were implanted under aseptic conditions with a post to fix the head and two recording chambers, one over the FEF and one over the V4 area. The location coordinates were obtained based on magnetic resonance imaging (MRI) scans.Visual stimulation and behavioral control were performed using Cortex software.
Visual stimuli and tasks
We used a feature-based attention paradigm (see details in Zhou & Desimone (2011)) in the present study. Briefly, a cell's receptive field (RF) and stimulus selectivity were first mapped using a memory-guided saccade task, with a stimulus flashed in one of 20 positions on the search array used in the visual search task. In the task, the monkeys exhibited fixation on a central spot for 400 ms. A central cue identical to the search target was then presented for 200-2 500 ms randomly,followed by a search array with 20 stimuli. After the onset of the array, the monkeys had 4 s to find the target identical to the central cue. There were 64 stimuli in this experiment,which were combinations of one of eight colors and one of eight shapes.Each stimulus was 1.1°×1.1°.
Recording
Multi-unit spikes and local field potentials (LFPs) were recorded from the FEF and V4 simultaneously using a Multichannel Acquisition Processor system (Plexon Inc,Dallas, USA). Up to four tungsten microelectrodes (FHC Inc.,Bowdoin, USA) were used in each area. Electrodes within an area were spaced 650 or 900 μm apart. Neural signals were filtered between 250 Hz and 8 kHz, amplified and digitized at 40 kHz to obtain spike data, and filtered between 0.7 and 170 Hz to obtain LFP signals. In both monkeys, we electrically(<50 uA) stimulated the FEF and elicited eye movements. Eye movements were recorded by an infrared eye tracking system(Eye Link II, SR Research Ltd. Ontario, Canada) at a sampling rate of 500 Hz.
Data analysis
Recording sites that showed a significant visual response(Wilcoxon rank-sum test, P<0.05) were included for analysis.The interval used for statistical comparisons was 50 to 250 ms after stimulus onset for the post-stimulus period and -200 to 0 ms before stimulus onset for the pre-stimulus period. Firing rates were calculated with 10 ms non-overlapping bins.
The LFP signals were pre-processed for removal of the powerline artifact and phase correction. The powerline artifact was removed as described in our previous study (Fries et al.,2008). For each LFP epoch of interest, we took a 10 s epoch out of the continuous signal with the epoch of interest in the middle and calculated the discrete Fourier transform (DFT) of the 10 s epoch at 60 Hz without any tapering. We then constructed a 60 Hz sine wave with the amplitude and phase as estimated by the DFT and subtracted this sine wave(estimated powerline artifact) from the 10 s epoch. LFP phase shifts through the headstage and preamplifier were corrected as described before (Gregoriou et al., 2009). Briefly,sinusoidal signals of known frequencies (from 0.5 Hz to 400 Hz) were injected into two channels, one through the headstage and preamplifier used in the recordings and one going directly to an A/D channel with no filtering.
The mean phase difference between the two signals was calculated for each frequency using the Hilbert transform and filter response function was determined. The empirically derived digital filter was applied to the recorded data in time reverse order to cancel potential time delays caused by the original filters. We also used the utility program provided by Plexon Inc (USA) to correct for any filter-induced time delays(FPAlign, www.plexoninc.com). Results from the two methods were similar.
We used different tapers for analysis of low and high frequencies as described in earlier research (Fries et al.,2008). For frequencies up to 25 Hz, we used a single Hanning taper and applied fast Fourier transform to the Hanningtapered trials. For frequencies beyond 25 Hz, we used multitaper methods to achieve the optimal spectral concentration(Jarvis & Mitra, 2001; Mitra & Pesaran, 1999; Pesaran et al.,2002). All coherence calculations used data from the two different electrodes to preclude the possibility that spikes contributed to the LFPs recorded on the same electrode.
To investigate how visual search influenced the interactions between the FEF and V4, we calculated coherence during a'Cue' period and 'Search' period. The Cue period was from 150 ms after cue onset to search array onset and the Search period was 150 ms after search onset to 150 ms after fixation on the target. Minimum data length for analysis was 500 ms.The trial number and length of data for the two periods were equalized to eliminate possible bias from differing sample sizes.
To isolate the effects of feature-based attention, we divided fixation during the Search period into 'Target' and 'Distracter'.During the Target-in-RF fixations, a searched-for target with at least one preferred feature of the recorded site was in its RF.During the Distracter-in-RF fixations, no stimulus sharing color or shape with the target was in the RF. To avoid the influence of saccades, only fixations followed by a saccade away from the RF were included for analysis. We also matched the stimuli in the RF across two compared conditions using the method described in our previous study (Zhou & Desimone,2011). If the RF contained only one of the 20 stimuli in the search array, we selected fixation periods in which the stimulus in the RF was the same in the two compared conditions. If the RF contained more than one stimulus, we first selected fixation periods in which the RF contained only one stimulus that shared at least one stimulus feature with the target in the attended conditions, with no other stimuli in the RF sharing any feature with the target. We then selected noshare fixations with the same stimulus as the stimulus with the target feature for the attended trials in the same location in the RF. Only matched trials were included for analysis. Coherence was calculated in a 200 ms time window starting from the onset of the Target-in-RF or Distracter-in-RF fixations. To eliminate the effect of spike number on coherence measures,we first calculated coherence after randomizing the LFPs and spike trains across fixations within the Target-in-RF and Distracter-in-RF fixations. As coherence can include bias caused by spike number, we subtracted coherences from coherences calculated without randomization,respectively.
To isolate the effects of overt spatial attention or saccade selection, we compared coherences during 'Saccade to RF'and 'Saccade out of RF' fixations. During a Saccade to RF fixation, the saccade following fixation was toward the RF.During a Saccade out of RF fixation, the saccade following fixation was away from the RF. We selected fixations and kept the stimulus in the RF, in which the saccade ended following the Saccade to RF fixation, the same as the stimulus in the same location in the RF during the Saccade out of fixation.Coherences were calculated in a 200 ms time window starting from the onset of the two types of fixations. To eliminate the effect of spike number on coherence, we also calculated coherences after randomizing the LFPs and spike trains across fixations within the Saccade to RF and Saccade out of RF fixations and subtracted them from the coherences calculated without randomization,respectively.
To investigate the role of cross-frequency coupling in visual search, we divided trials into 'Fast search' and 'Slow search'.In Fast search trials, monkeys took one saccade to find the target. In Slow search trials, monkeys took at least three saccades to find the target. Theta phase-gamma power and alpha phase-gamma power cross-frequency couplings in the Cue period of Fast and Slow search trials were calculated and compared. In all selected trials, cell RFs were located at the peripheral regions of the screen, therefore the cue was not in the RF. Trial number and length of data for the two conditions were equalized to eliminate possible bias from differing sample sizes.
For theta-gamma cross-frequency couplings, we used a similar method as described previously (Canolty et al., 2006).Using a two-way least-squares FIR filter (eegfilt.m from the EEGLAB toolbox), the raw LFP signal was separated into bands with center frequencies ranging from 30 Hz to 50 Hz, in 2 Hz steps with 4 Hz bandwidths. This created a set of bandpass filtered signals. Each of these signals was normalized by subtracting the temporal mean and dividing by the temporal standard deviation to create a set of normalized band-passed signals. This normalization was used to facilitate comparison between different frequency bands. Hilbert transform was applied to calculate the instantaneous amplitude and power of each normalized band-pass signal. Epochs (500 ms) centered on the time points of theta troughs were extracted from the power time series and averaged within each band across trials to produce the theta trough-triggered mean instantaneous power across gamma frequencies. To detect the theta trough, the raw LFP signals were 4-8 Hz band-pass filtered by the FIR filter. Hilbert transform was applied to calculate the instantaneous phases of the theta band. The theta trough was identified as the time point where the phase value was larger by more than five radians than the phase value of its following time point.
To quantify amplitude modulation by phase, we calculated a modulation index (MI) using a similar method as Tort et al.(2008). Instantaneous gamma power across 30-50 Hz was averaged and binned into 18 groups based on its associated theta phase (0-360 deg, 20 deg/bin). Gamma power within each bin was averaged. We denoted P(j) as the mean gamma power at bin j. We then applied the entropy measure H,defined by:

where,N=18(number of bins)and f(j)is given by:

MI is finally obtained by normalizing H by the maximum possible entropy value (Hmax) obtained for uniform distribution f(j)=1/N(hence Hmax is logN):

A MI value of 0 indicates a lack of phase-to-amplitude modulation and larger MI values represent stronger phase-toamplitude couplings. To assess the statistical significance of the MI values, we calculated 200 surrogate MI values after shuffling gamma power and theta phase time series across trials. We subsequently calculated the MI value and permutation distribution to determine what percentage of data points in the permutation distribution was equal to or greater than the observed MI value(P).
To compare couplings between Fast and Slow conditions,we first calculated MI based on the data of population averages. Hilbert transform was applied to the population average of the theta trough-triggered LFPs to calculate the instantaneous theta phase. The population average of gamma power was averaged across 30-50 Hz and binned into 18 groups based on the theta phase. We calculated the differences between MI values in the two conditions (ΔMIreal=MIFast-MISlow). We then repeated the resampling process 1 000 times and obtained the generated distribution of 1 000 values of ΔMI. Finally, we determined the percent of ΔMIs that are equal to or larger than the MI difference we actually observed(ΔMIreal) in the 1 000 generated ΔMIs (P). The absolute values of the MI differences were used in the above comparison.
We also calculated the alpha-gamma cross-frequency couplings. Hilbert transform was applied to the alpha (8-13 Hz) band of the LFP signals to calculate the instantaneous phases of this band.All other analyses, including alpha trough identification, data averaging, MI calculation, and statistics,were the same as those used for theta-gamma couplings.
RESULTS
Spike-LFP coherences during Cue and Search periods
Spike-LFP coherence is considered an important mechanism underlying neuronal interactions across brain regions (Zanos et al., 2018). The influence of brain functions on neuronal interactions can be reflected by changes in spike-LFP coherence (Das & Ray, 2018; Zhou et al., 2016). To investigate how visual search influenced the interactions between FEF and V4, we used multi-taper spectral methods to calculate spike-LFP coherences between the two areas and during Cue and Search periods in the visual search task.During the Cue period, V4 spikes and FEF LFPs showed peak coherence in the alpha rhythm (8-13 Hz; Figure 2A). In contrast, during the Search period, V4 spikes and FEF LFPs showed peak coherence in the theta rhythm (4-8 Hz) (Figure 2A). Furthermore, the FEF spike-V4 LFP coherences showed similar changes to the V4 spike-FEF LFP coherences during the two periods (Figure 2B). These data illustrated distinct patterns of oscillation coupling during the Cue and Search periods in the FEF and V4. In the Cue period, coherence dominated in the alpha rhythm, whereas, in the Search period,coherence dominated in the theta rhythm.

Figure 1 Task and recording sites
Spike-LFP coherences within brain regions were also calculated. In the V4, the spike-LFP coherence during the Cue period was significantly stronger than the coherence during the Search period in the alpha rhythm, but significantly weaker in the theta rhythm (Figure 2C; Wilcoxon signed rank test, P<0.05). Furthermore, in the FEF, coherence during the Cue period was significantly stronger than coherence during the Search period in the alpha band (Figure 2D; P<0.05), but not significantly different in the theta band(Figure 2D;P>0.05).
Cross frequency couplings during Cue period and search behaviors
Cross-frequency coupling has been implicated as a mechanism for coordinating local activities in different areas in cortical operations (Canolty & Knight, 2010). To examine the functional role of cross-frequency couplings in visual search,we calculated and compared the cross-frequency couplings(theta phase-gamma power and alpha phase-gamma power)in the Cue period during Fast search and Slow search trials.Figure 3A and B show the population averages of FEF theta-V4 gamma couplings in the Fast and Slow search trials,respectively. The population average was significantly stronger in the Fast search trials than in the Slow search trials(Figure 3C, two-sided permutation test, P<0.05). The population averages of the theta trough-triggered FEF LFPs were the same in the Fast and Slow search trials (Figure 3C),indicating that coupling changes could not be explained by FEF theta power changes in the two trials. MI was used to quantify amplitude modulation by phase. Figure 3D shows the MI values from the two types of trials. There were no significant differences between MI values in the Fast and Slow search trials (Wilcoxon signed rank test, P>0.05), suggesting that the increased population average of coupling in the Fast search trials may be due to a more consistent temporal relationship between V4 gamma powers and the FEF theta phase in these trials across LFP pairs. In contrast to the FEF theta-V4 gamma couplings, the FEF alpha-V4 gamma couplings were weaker in the Fast search trials than in the Slow search trials (Figure 4). Together, the cross-frequency couplings in the Cue period were related to the monkeys'search behaviors, with the higher FEF theta-V4 gamma coupling and lower FEF alpha-V4 gamma coupling associated with faster search.
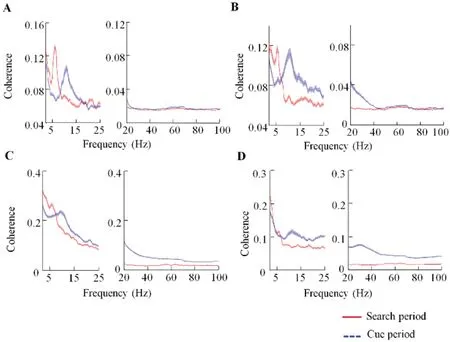
Figure 2 Spike-LFP coherences during Cue and Search periods

Figure 3 FEF theta-V4 gamma couplings during Cue period
Effects of attention on coherence between FEF and V4
Feature-based attention enhances spike-LFP coherence in the V4 for the attended preferred stimulus (Bichot et al.,2005). To investigate the mechanisms underlying the interaction between FEF and V4 during feature-based attention, we calculated spike-LFP coherences during fixation periods when a stimulus in the RF was the searched-for target with at least one good feature (Target-in-RF fixation) and when the same stimulus was in the RF, but shared nothing with the target (Distracter-in-RF fixation). All saccades following the Target-in-RF and Distracter-in-RF fixations were moved away from the RF to exclude the influence of spatial attention. The population averages of V4 spike-FEF LFP coherences are shown in Figure 5A. During the Target-in-RF fixations, the V4 spike-FEF LFP coherences were enhanced in the beta (~20 Hz) and gamma (~60 Hz) rhythms (Wilcoxon signed rank test, P<0.05), but were suppressed at low frequencies (<15 Hz). Similar coherence changes were also observed in the FEF spike-V4 LFP (Figure 5B) and V4 spike-V4 LFP coherences (Figure 5C). No coherence enhancement at the beta and gamma frequencies was observed within the FEF (Figure 5D). These results suggest that gamma, beta,and low frequency (<15 Hz) oscillation coupling changes were involved in the interaction between FEF and V4 during featurebased attention.
To investigate the effect of the overt spatial attention, we sorted the fixations based on the following saccade direction.Spike-LFP coherences during fixations followed by a saccade to the RF ('Saccade to RF') and fixations followed by a saccade outside of the RF ('Saccade out of RF') were calculated and compared. As shown in Figure 6, the main effect was de-synchronization at frequencies up to 30 Hz(Wilcoxon signed rank test, P<0.05) under the Saccade to RF condition compared to the Saccade out of RF condition,suggesting that overt spatial attention desynchronized the oscillation coupling between FEF and V4 at low frequencies(<30 Hz).
DISCUSSION
Although neural mechanisms in the visual cortex, including the V4, IT, and prefrontal cortex, have been investigated extensively, the interactions among brain regions in visual search remain unclear. In this study, we simultaneously recorded neuronal activities in lower (V4) and higher cortical areas (FEF) while monkeys performed a visual search task.We showed that oscillation couplings between the two regions were selectively enhanced in the theta, beta, and gamma bands,but suppressed in the alpha band during the task.

Figure 4 FEF alpha-V4 gamma couplings during Cue period

Figure 5 Spike-LFP coherences and feature-based attention

Figure 6 Spike-LFP coherences and saccade selection
Our results also showed that the dominant spike-LFP coherence between the FEF and V4 changed from the alpha rhythm during the Cue period to the theta rhythm during the Search period, suggesting that visual search enhanced spike-LFP coherence between the two regions in the theta band, but suppressed it in the alpha band.As saccades occurred during the Search period, they may also facilitate the dominantcoherence change. Neurophysiological studies suggest that changes in oscillation couplings occur to attain specific functional roles. For example, desynchronized alpha band oscillations (O'Connell et al., 2009) are considered as possible mechanisms to promote top-down attention, and gamma-band synchronization (Fries, 2015) is generally associated with bottom-up stimulus salience. These neural activities can be used to predict behavior. By recording the activities of V4 neurons when monkeys performed a change-detection task,Womelsdorf et al. (2006) found a positive relationship between the degree of gamma-band synchronization and monkey reaction time to stimulus change. Moreover, Dezfouli et al. (2018) found reaction time to be positively correlated with the amplitude of the LFPs long before (>2 s) a behavioral response. In addition, in multi-region electrophysiological studies, visual attention is reportedly related to reduced alpha oscillations between V1 and LGN (Bollimunta et al., 2011;Mock et al., 2018) and enhanced theta rhythm between V4 and TEO (Spyropoulos et al., 2018). In the present study, we extend previous findings by showing suppressed alpha and enhanced theta rhythms between FEF and V4 during the Search period, which thus promote our understanding of corticocortical communication.
In addition to spike-LFP phase coupling, we found that cross-frequency couplings during the Cue period play a key role in regulating monkey search behaviors, with the higher FEF theta-V4 gamma coupling and lower FEF alpha-V4 gamma coupling associated with faster search. In the visual system, oscillations in the gamma-frequency are thought to subserve between-area coordination (Bollimunta et al., 2011).Several cross-frequency studies have reported gamma power to be modulated with theta phase. For example, in an electrophysiological experiment, successful attention shift was accompanied by robust increases in theta-gamma phaseamplitude correlation between the anterior cingulate and prefrontal cortex (Voloh et al., 2015). Increased theta-gamma coupling during spatial attention was also observed within the frontoparietal network (Fiebelkorn et al., 2018). As with these studies, previously described theta-gamma increase in the human visual cortex during spatial attention is related to improved behavioral performance (Landau et al., 2015).Similar to these results, the present data suggest that an increase in theta-gamma coupling is associated with enhanced visual search. Recently, however, selective attention related to theta-gamma coupling in the visual cortex has been reported (Spyropoulos et al., 2018). By recording neural activities in the MT area, Esghaei et al. (2015) reported a spatial attentional suppression of couplings between lowfrequencies oscillation (1-8 Hz) and gamma (30-120 Hz)power. This spatial attention-related decrease in coupling contrasts with our present results. This discrepancy may be due to the different tasks used in the two papers (Esghaei et al., 2015; Spyropoulos et al., 2018) and the present study.The previous studies on spatial attention applied two or three moving stimuli around the moving cue, and one stimulus overlap neuron receptive field. In the present study, however,there was no stimulus around the cue. Furthermore, the location of the target was unknown before the appearance of the search array containing 20 stimuli and monkeys had to focus on the feature property of the cue to find the target(feature-based attention). In addition, the above studies differed from our research in regard to the theta-gamma coupling relationship. The previous studies described a relationship between spatial attention and decreased thetagamma coupling in the visual cortex, whereas we described a relationship between visual search behavior and increased theta-gamma couplings between the FEF and V4.Thus, future research is needed to clarify the above differences. Overall,we reported that gamma modulated with theta and alpha phases during the Cue period facilitated monkey search behavior. Thus, cross-frequency coupling occurred between the FEF and V4 for transmission of sensory inputs to motor responses.
Feature-based attention is a process of focusing on a specific attribute of an object. Studies examining the neural mechanisms of feature-based selection signals have found that attention to target features enhances responses to stimuli that share the target features in the ventral pre-arcuate (VPA)region of the prefrontal cortex, FEF, LIP, and V4 (Bichot et al.,2005, 2015; Ruff & Born, 2015). Moreover, when monkeys performed a task allocating attention to a color or motion signal of a moving stimulus, Katzner et al. (2009) reported a clear modulation of feature-based attention on the activities of MT neurons, which initially showed poor tuning for the object feature (color). This feature enhancement is actually used to select stimuli, or find a target, during visual search (Zhou &Desimone, 2011). In the FEF and V4, neurons synchronize their activity in the gamma frequency range during spatial attention (Gregoriou et al., 2009). In the present study, we demonstrated that these areas play similar roles during feature-based attention, as enhanced spike-LFP coherences in the gamma and beta bands and suppressed spike-LFP coherences at lower frequencies were observed between the FEF and V4.
By investigating the interactions between the FEF and V4,we demonstrated that selectively enhanced and suppressed oscillation couplings in different bands between the two regions were important for visual search. Moreover, we showed that feature-based attention modulated these couplings, thus providing insight into how visual and cognitive signals are communicated between neuronal populations.
COMPETING INTERESTS
The authors declare that they have no competing interests.
AUTHORS'CONTRIBUTIONS
H.H.Z. and T.Y. designed the study. T.Y. conducted the experiments. T.Y.drafted the manuscript with assistance from H.H.Z. All authors read and approved the final version of the manuscript.

- Zoological Research的其它文章
- Progress in in vitro culture and gene editing of porcine spermatogonial stem cells
- Counting stripes:revision of the Lipinia vittigera complex(Reptilia,Squamata,Scincidae)with description of two new species from Indochina
- A soluble FcγR homolog inhibits IgM antibody production in ayu spleen cells
- Immunodetection of ephrin receptors in the regenerating tail of the lizard Podarcis muralis suggests stimulation of differentiation and muscle segmentation
- Genetic diversity and temporal changes of an endemic cyprinid fish species,Ancherythroculter nigrocauda,from the upper reaches of Yangtze River
- Non-invasive genetic analysis indicates low population connectivity in vulnerable Chinese gorals:concerns for segregated population management