
Climate change in the twenty-first century over China:projections by an RCM and the driving GCM
2019-10-16 14:09:02CHENNanandGAOXuejie
CHEN Nan and GAO Xuejie
aCollege of Atmospheric Sciences,Chengdu University of Information Technology,Chengdu,China;bClimate Change Research Center,Institute of Atmospheric Physics,Chinese Academy of Sciences,Beijing,China;cCollege of Earth and Planetary Sciences,University of Chinese Academy of Sciences,Beijing,China
ABSTRACT A regional climate model(RegCM4)is used to project climate change over China in the twentyfirst century under the RCP4.5 and RCP8.5 pathways.The driving GCM is CSIRO Mk3.6.0(hereafter referred to simply as CSIRO),and the simulation(hereafter referred to as CdR)is run at a grid spacing of 25 km.The focus of the present paper is on the changes in mean surface air temperature and precipitation in December-January-February (DJF) and June-July-August(JJA) over China. Validation of the model performances is provided first, followed by a comparison of future changes projected by CSIRO and CdR.Substantial warming in the future is simulated by both models,being more pronounced in DJF compared to JJA,and under RCP8.5 compared to RCP4.5.The warming shows different spatial patterns and,to a less extent,magnitude between CSIRO and CdR.Precipitation change shows a general increase in DJF and a mixture of increase and decrease in JJA.Substantial differences between the two models are found in for precipitation change in JJA.The paper further emphasizes the uncertainties in climate change projection over the region.
KEYWORDS Climate change;RegCM;China;temperature;precipitation
1.Introduction
Climate change information at regional and local scales is of great concern in climate studies and provides a basis for impact assessments and formulating adaptation strategies at national and local governmental levels.China is a country vulnerable to climate change because of its large population,imbalanced socio-economic development, and complex ecosystems within its vast territory.
Much effort has been devoted to projecting future changes in climate over the region,based on either global or regional climate models(GCMs and RCMs,respectively).As found in previous studies,the coarse resolution of GCMs usually leads to poor performance when reproducing the monsoon climate, whereas nested high-resolution RCMs can produce greatly improved simulations by comparison(e.g.,Gao et al.2006;Yu,Wang,and Sun 2010;Zou and Zhou 2013;Niu et al.2015;Shi,Wang,and Gao 2017).Different RCMs have been applied over the region,as summarized by Gao and Giorgi(2017),and multi-RCM intercomparisons have been employed in recent years to reveal the uncertainties involved in projections(e.g.,Gao et al.2012;Wu et al.2015;Yu and Xiang 2015;Li et al.2016;Tang et al. 2016;Kim et al.2016).
However,the number of RCM simulations carried out to better address and reduce the uncertainties based on ensembles of projections thus far remains limited,particularly under the CORDEX(Coordinated Regional Climate Downscaling Experiment)framework(Giorgi,Jones,and Asrar 2009).As found in previous studies,whilst RCMs can introduce different climate change signals compared with the driving GCM,due to their stronger and more realistic topographic forcing(Gao et al.2008),the signals simulated by the RCM show differences when driven by different GCMs(Gao et al.2012).In addition,the levels of agreement and disagreement between RCM projections and the driving GCM have also not been studied thoroughly.
The present paper report upon recently completed RCM climate change simulations over East Asia driven by a CMIP5 model under the RCP4.5 and RCP8.5 emission pathways.It is noted that the RCP4.5 run was briefly discussed by Zhang,Han,and Shi(2017)with a focus on annual mean changes in temperature and precipitation over China.In this paper,further analysis is provided on the seasonal scale,in the boreal winter of December-January-February (DJF) and summer of June-July-August (JJA), as well as intercomparison between the RCP8.5 and RCP4.5 pathways.
2.Model and methods
The RCM employed in this study is RegCM4,developed at the Abdus Salam International Center for Theoretical Physics(Giorgi et al.2012).The RegCM series has been widely used in East Asia and China,and its model versions have shown good performance in reproducing the present-day climate over the region(e.g.,Gao and Giorgi 2017).
In this study,the RegCM4 domain used is the CORDEX Phase II East Asia domain,covering the whole of China and its surrounding East Asian areas.The model is run at 25-km gird spacing,with its standard configuration of 18 vertical sigma layers and a model top at 10 hPa.Based on the experiments by Gao,Shi,and Giorgi(2016),and Gao et al.(2017),the model physics is configured as follows:CLM(Oleson et al.2008)for land surface processes;the convective precipitation scheme of Emanuel(1991);the NCAR CCM3 radiation scheme(Kiehl et al.1996);the planetary boundary layer computations of Holtslag,De Bruijn,and Pan(1990);and the sub-grid explicit moisture scheme of Pal, Small, and Eltahir(2000).In addition,the land cover data over China were updated to represent the vegetation more realistically,as reported by Han et al.(2015).
Climate change simulations from CSIRO Mk3.6.0(hereafter referred to simply as CSIRO)(Gordon et al.2010)are used to derive the initial and lateral boundary conditions needed to drive RegCM4.The horizontal resolution of the atmospheric component of CSIRO is T63(~1.875°longitude×1.875°latitude).The simulation(hereafter referred to as CdR) covers the period 1968-2005 for the present day with observed greenhouse gas concentrations,and 2006-99 for the future under the mid-level RCP4.5 and high-end RCP8.5 pathways,respectively(Vuuren et al.2011).Note that CdR is one of the multi-GCM driving RegCM4 simulations over East Asia,with the ensemble having been used to investigate future changes of effective temperature over China(Gao et al.2018).The reference(present-day)period used in this study is 1986-2005,and the term‘change’is considered to encompass the differences between values for the future and the present day.To facilitate the comparisons,the CSIRO and CdR outputs are interpolated bilinearly(without topography correction)to 0.25°×0.25°grids.
3.Results
3.1 Model validation
Figure 1 shows the observed temperature and model biases in DJF and JJA over China for the present day.A general cold bias is found in CSIRO in DJF,except in the northern part of the Northeast and over the mountain ranges in the Northwest(Figure 1(c)).The cold bias is larger,in excess of 7°C,over the Northeast Plains,Sichuan and Qaidam Basins,and source region of the Yangtze and Yellow Rivers,mostly due to its coarse resolution being unable to describe these small-scale landforms.The cold bias is also large in the southwestern part of the Tibetan Plateau.CdR greatly improves the simulation by reducing the cold bias to-3°C to 3°C in the eastern part of China.Warm biases are found in the northern part of the Northeast,consistent with CSIRO,and over the deserts in the Northwest.The spatial correlation coefficients between CSIRO or CdR and observation in DJF are both large,at 0.95 and 0.96,respectively.
The bias of CSIRO in JJA is characterized by large biases over places with complex topographic distributions (Figure 1(d)). This is more significant in the Northwest,with the simulated temperatures being generally too warm over the mountain ranges and too cold over the basins nearby.Again,improvements are evident in CdR,except for the large warm bias in the Northwestern deserts(Figure 1(f)).The spatial correlation coefficients between CSIRO or CdR and observation in JJA are 0.93 and 0.97,respectively.
For precipitation in DJF,both CSIRO and CdR capture the general pattern in China,with decreasing values from the south towards the north and northwest(Figure 2(a,c,e)).However,both models fail to reproduce the precipitation centre in the Southeast.The models also overestimate the precipitation in the north,particularly CdR.Furthermore,a large overestimation is found in southwestern China in CdR,ultimately leading to a lower correlation of 0.34 for CdR compared to 0.54 for CSIRO.However,more spatial details can be found in CdR,e.g.,the larger/lower values over the mountains/basins in the Northwest.
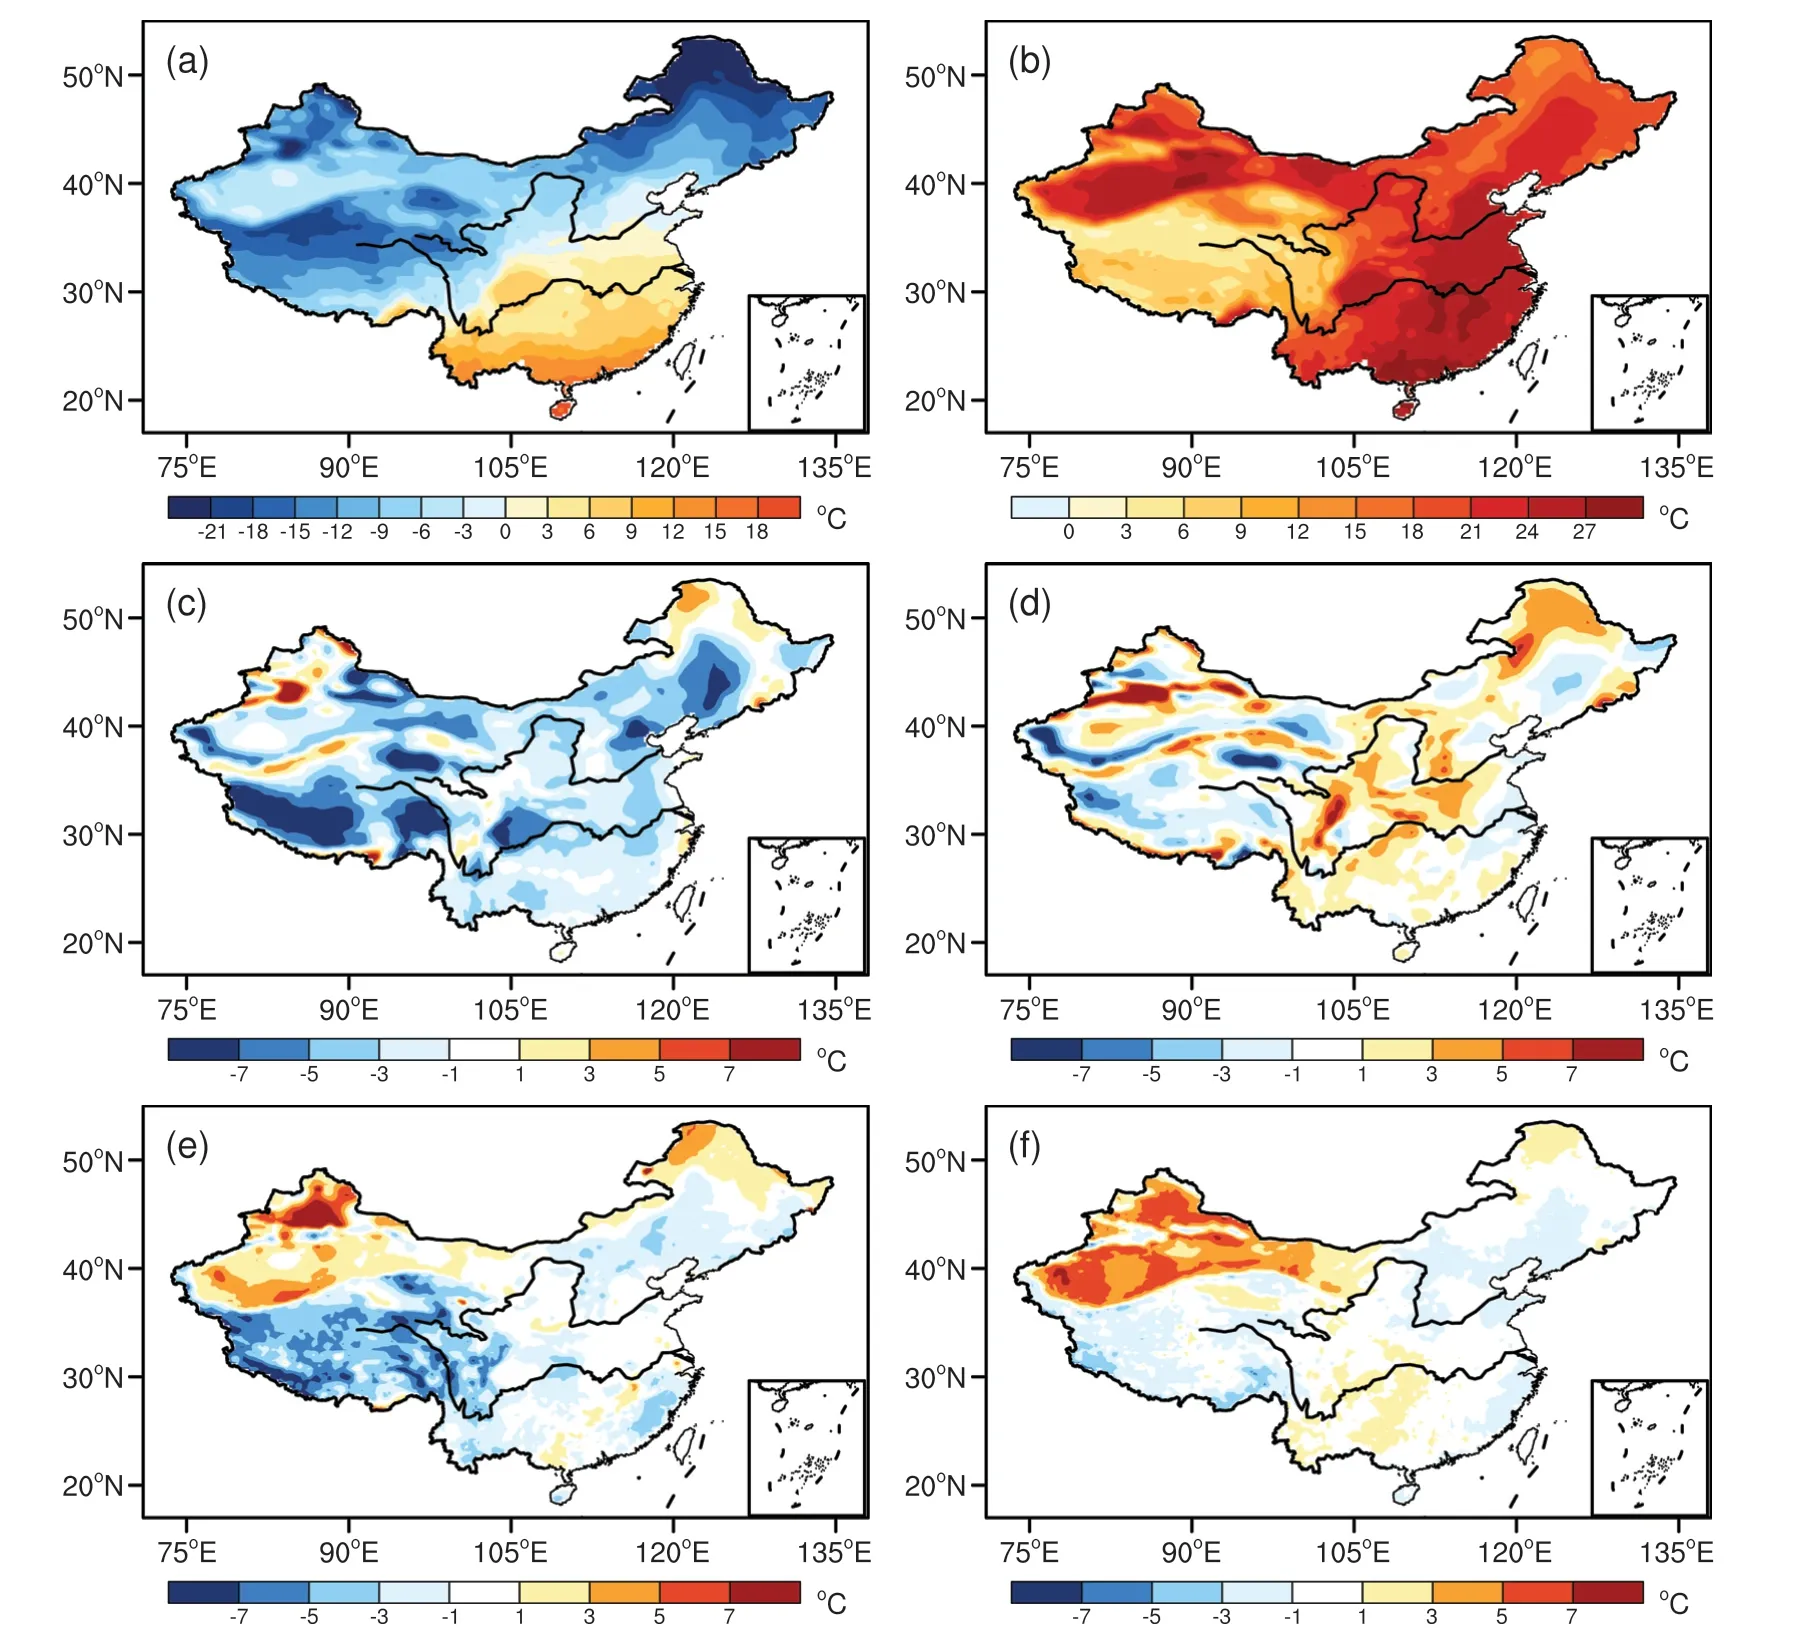
Figure 1.Observation and model bias of mean temperature in 1986-2005 over China:(a,b)observation in(a)DJF and(b)JJA;(c,d)biases of CSIRO in(c)DJF and(d)JJA;(e,f)biases of CdR in(e)DJF and(f)JJA(units:°C).
Similar to DJF,the improvement of the spatial details of precipitation in CdR can also be observed in JJA(Figure 2(b,d,f)).The topographic effect is too strong in CdR,with large overestimations found over the Taihang and Yanshan Mountains in North China and the mountains around the Sichuan Basin.The spatial correlation coeffi-cients for CSIRO and CdR are 0.81 and 0.60,respectively.
3.2 Future changes
3.2.1 Temperature
Figure 3 shows the spatial distribution of the projected temperature changes over China by CSIRO and CdR by the end of twenty-first century(2080-99)in DJF and JJA under the RCP4.5 and RCP8.5 scenarios,respectively.Substantial warming is found in both seasons and from both models,as expected.The warming is more pronounced in DJF compared to JJA,and under RCP8.5 compared to RCP4.5.The spatial pattern of the warming shows consistencies between the scenarios for the individual models in either DJF or JJA.
For CSIRO in DJF,the greatest warming(>7°C)is found under RCP8.5 in Northwest China,Inner Mongolia,the Tibetan Plateau,and Southwest China(Figure 3(c)),while the least warming(<1.5°C)is found in Northeast China under RCP4.5(Figure 3(a)).It is noted that the pattern shows differences with most other GCMs characterized by maximum warming over high latitudes and highelevation areas(e.g.,Xu and Xu 2012;Collins et al.2013;Sui,Lang,and Jiang 2015).In JJA,larger warming is found in eastern China under both RCP4.5 and RCP8.5(Figure 3(e,g)).The regional mean changes in DJF and JJA for RCP4.5/RCP8.5 over China are 3.4°C/5.9°C and 3.1°C/5.6°C,respectively.
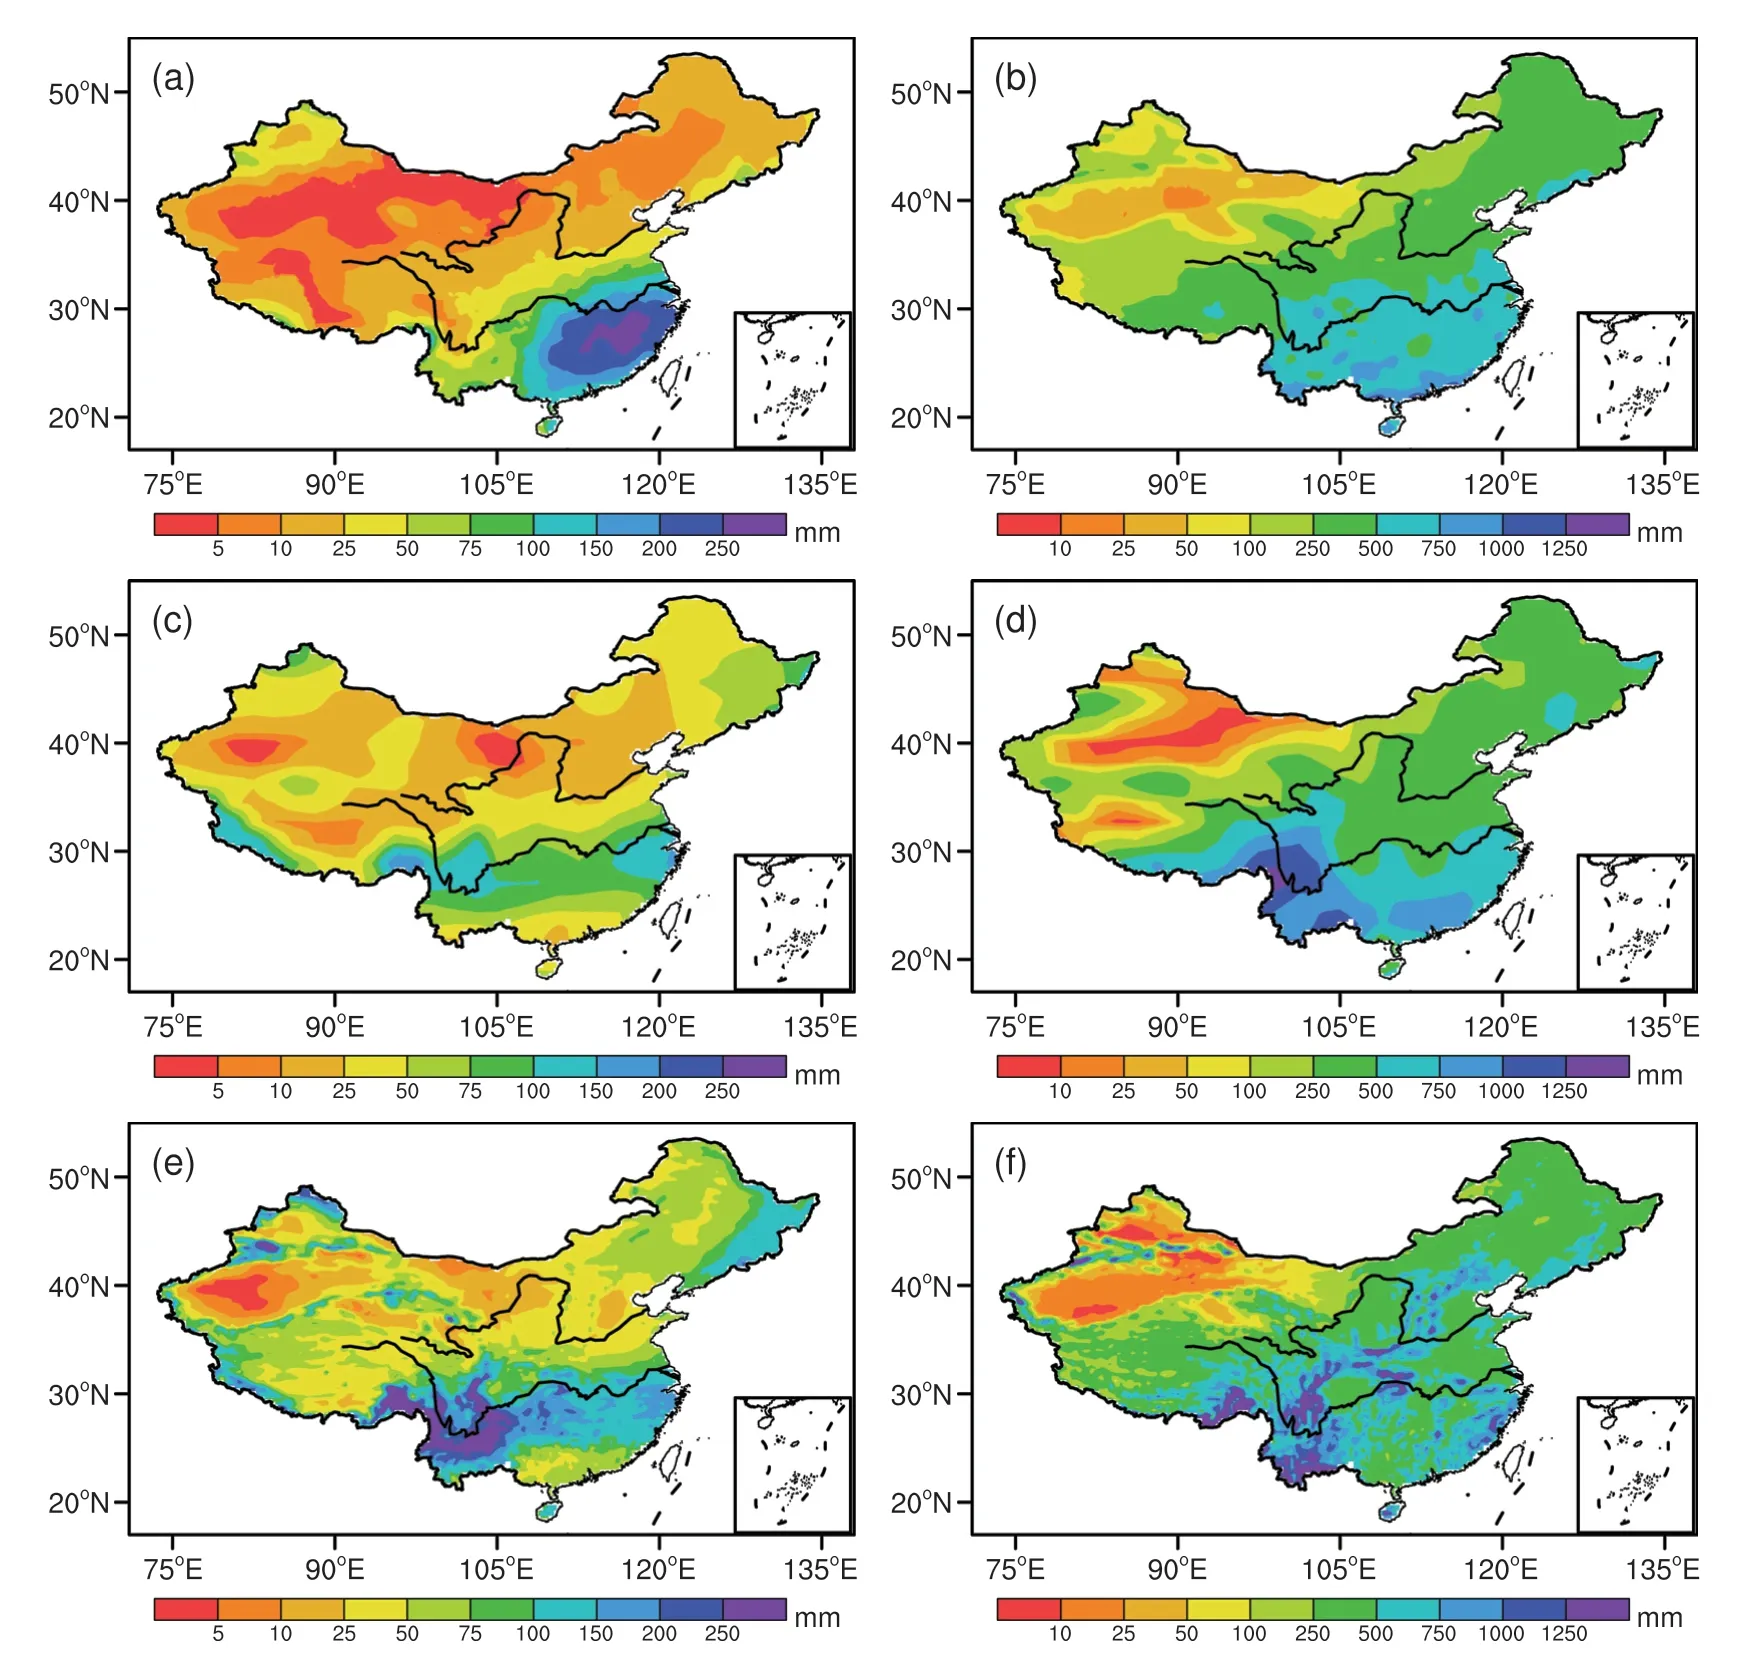
Figure 2.Observation and model simulation of mean precipitation in 1986-2005 over China:(a,b)observation in(a)DJF and(b)JJA;(c,d)simulation of CSIRO in(c)DJF and(d)JJA;(e,f)simulation of CdR in(e)DJF and(f)JJA(units:mm).
Moving to CdR(Figure 3(b,d,f,h)),a weaker warming is projected than by CSIRO,with regional mean changes in DJF and JJA for RCP4.5/RCP8.5 of 3.1°C/5.6°C and 2.5°C/4.7°C,respectively.The largest difference is found in JJA under RCP8.5,with the warming projected by CdR to be 0.9°C lower.
Concerning the spatial distribution of the change,firstly,CdR provides more spatial detail,as expected.Furthermore,substantial differences are found in the large-scale pattern in CdR compared to CSIRO,in both DJF and JJA.In DJF,whilst the least warming in Northeast China is consistent between the two models,the temperature increase over the Tibetan Plateau is much more pronounced in CdR.In JJA,the large warming in CSIRO over eastern China is not simulated by CdR,with the greatest warming found in the Northwest under RCP8.5.
3.2.2 Precipitation
Figure 4 presents the projected precipitation changes at the end of the twenty-first century.Immediately apparent is that the changes are characterized by a prevailing increase in DJF,a mixture of positive and negative changes in JJA,and a greater change under RCP8.5 compared to RCP4.5,for both models.In DJF,the spatial pattern and magnitude of the changes from CdR show good agreement with CSIRO,as well as many other GCMs(Collins et al.2013;Sui,Lang,and Jiang 2015),with a predominant increase over most of the country except the southern part of the Tibetan Plateau and Southwest China(Figure 4(a-d)).The change in CdR shows more spatial detail and topographic effects compared to CSIRO.For example,a larger increase,in excess of 100%,in the Tarim Basin in the northwest is found in CdR,but not in CSIRO.
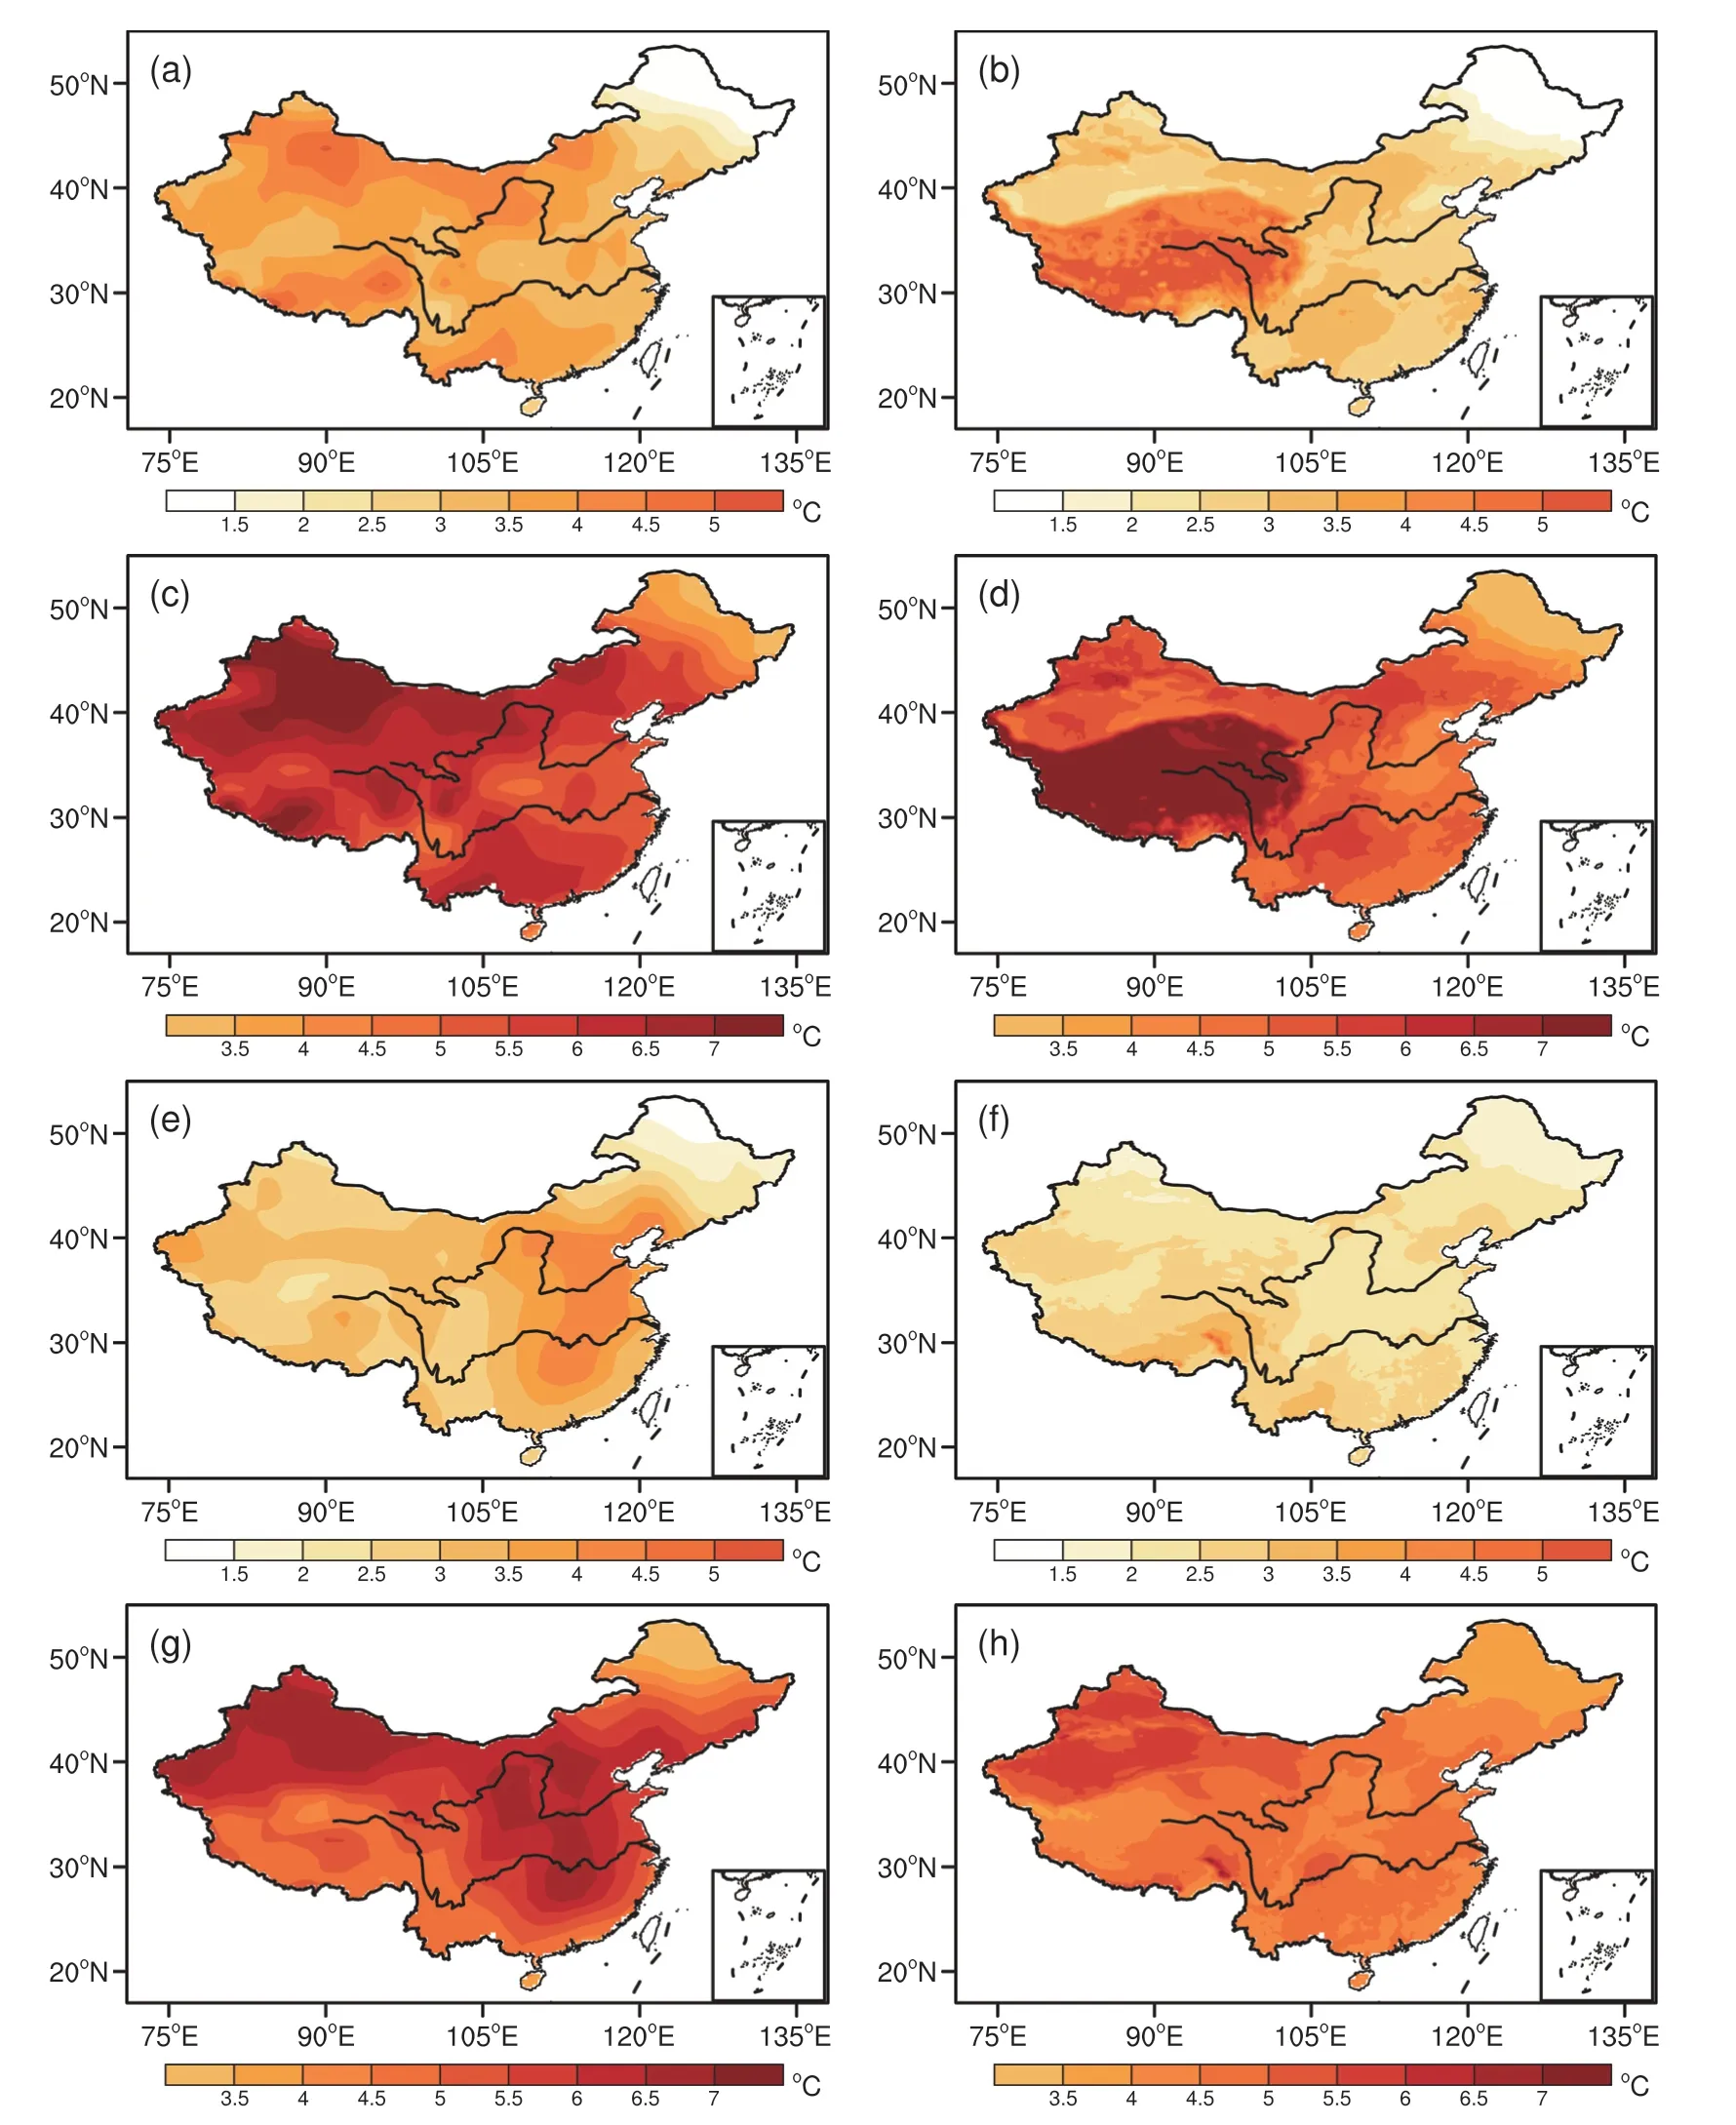
Figure 3.Mean temperature changes in 2080-99 relative to 1986-2005:(a-d)DJF of(a)CSIRO under RCP4.5,(b)CdR under RCP4.5,(c)CSIRO under RCP8.5,and(d)CdR under RCP8.5;(e-h)JJA of(e)CSIRO under RCP4.5,(f)CdR under RCP4.5,(g)CSIRO under RCP8.5,and(h)CdR under RCP8.5(units:°C).
Circulation changes in DJF in CdR are generally consistent with CSIRO. At high latitudes, a prevailing increase in westerly flow delivering more moisture leads to the general increase in precipitation.In eastern China,meanwhile,more precipitation is also projected,because of the increased southeasterly flow from the ocean.The pattern of changes between RCP 4.5 and RCP8.5 also shows agreement,but with greater values for the latter.The regional mean changes for CSIRO and CdR over China under RCP4.5/RCP8.5 are 28%/46%and 32%/52%,respectively.

Figure 4.Mean precipitation changes(shaded)and mean 700-hPa wind changes(vectors)in 2080-99 relative to 1986-2005:(a-d)DJF of(a)CSIRO under RCP4.5,(b)CdR under RCP4.5,(c)CSIRO under RCP8.5,and(d)CdR under RCP8.5;(e-h)JJA of(e)CSIRO under RCP4.5,(f)CdR under RCP4.5,(g)CSIRO under RCP8.5,and(h)CdR under RCP8.5(units:%and m s-1).
The change of CdR shows substantial differences with CSIRO in JJA-the season dominated by monsoon climate and smaller-scale climate systems (Figure 4(e-h)).As reported by Gao et al.(2008),this can be largely attributed to the stronger topographic forcing and the resulting circulation changes in the RCM.As shown in Figure 4(e),a dominant anticyclonic circulation centred on(35°N,110°E)is found in CSIRO,which causes the general reduction of precipitation in eastern China.In CdR(Figure 4(f)),the anticyclonic circulation is not so strong and moves to the west mostly,due to its larger topographic forcings.Ultimately,this leads to the precipitation reduction being not as significant as in CSIRO;in fact,a decrease-increase pattern from north to south is simulated.
The differences between the two scenarios in CdR in JJA are large in eastern China,indicating a great natural variability over the region.For example,in the Huanghuai-Jianghuai region(south of the Yellow and north of the Yangtze River lower reaches),the change is a decrease in RCP4.5 but an increase in RCP8.5.The regional mean changes for CSIRO and CdR over China under RCP4.5/RCP8.5 in JJA are 3.2%/5.3%and 5.4%/9.6%,respectively.
4.Conclusions and discussion
Climate change simulations of the twenty-first century are conducted in this study using RegCM4 under the RCP4.5 and RCP8.5 scenarios over East Asia,driven by the GCM CSIRO.Validation of the models in simulating present-day temperature and precipitation,and their future changes, are presented and intercompared between the two models over China.
CdR improves the temperature simulation in both DJF and JJA compared to CSIRO,with reduced biases over most parts of the region.Whilst CdR reproduces more spatial details for precipitation,the general pattern of precipitation is not well simulated.It is noted that the performance of CdR is not as good compared to other simulations driven by reanalysis or different GCMs(Gao et al.2012,2017),which calls for better selection of the driving fields for the RCM.
Some agreement is found in the projected changes compared to previous studies using either GCMs or RCMs.For temperature,this includes the substantial warming,which is more pronounced in DJF compared to JJA,and greater under the high-end emission scenario(RCP8.5)than the medium one(RCP4.5).For precipitation,meanwhile,the level of agreement includes a decrease in the Southwest and eastern part of the Tibetan Plateau and a general increase over most of the other regions in DJF.
In the meantime,large differences are found when comparing CdR with CSIRO,and when comparing with other RCM simulations(e.g.,Gao et al.2012;Niu et al.2015;Shi,Wang,and Gao 2017).
CdR projects a significantly different regional-scale pattern of temperature change in both DJF and JJA.The regional mean warming projected by CdR is weaker than that of CSIRO,particularly in JJA.The differences for summer precipitation change are even larger across the models and scenarios,either in their spatial pattern or magnitude of change.Whilst at least some of the differences can be attributed to the greater topographic forcing in CdR and the large natural variabilities, further in-depth analysis and more numerical experiments are needed to better understand the underlying physical mechanisms.
In summary,as found in the present study and previous studies,large uncertainties still exist in projecting future climate changes in China-a region with complex topography and unique weather and climate systems.This further emphasizes the importance of in-depth analyses of model simulations and large ensembles of highresolution RCM simulations to build more robust and reliable climate change scenarios over the region.
Disclosure statement
No potential conflict of interest was reported by the authors.
Funding
This research was jointly supported by the National Key Research and Development Program[grant number 2016YFA0600704],and the National Natural Science Foundation of China[grant number 41375104].
 Atmospheric and Oceanic Science Letters2019年4期
- Atmospheric and Oceanic Science Letters的其它文章
- Interdecadal change in the lagged relationship between the Victoria mode and ENSO
- Synoptic-scale potential vorticity intrusion over northeastern China during winter and its influence on surface air temperature
- Recognition of two dominant modes of EASM and its thermal driving factors based on 25 monsoon indexes
- A case study of environmental characteristics on urban road-surface and air temperatures during heat-wave days in Seoul
- Large-scale circulation features associated with the heat wave over Northeast China in summer 2018
- Unprecedented East Asian warming in spring 2018 linked to the North Atlantic tripole SST mode