
Large-scale circulation features associated with the heat wave over Northeast China in summer 2018
2019-10-16 14:09:00TAOPanhongandZHANGYaocun
TAO Panhong and ZHANG Yaocun
School of Atmospheric Sciences,Nanjing University,Nanjing,China
ABSTRACT In late July and early August 2018,Northeast China suffered from extremely high temperatures,with the maxium temperature anomaly exceeding 6°C.In this study,the large-scale circulation features associated with this heat wave over Northeast China are analyzed using station temperature data and NCEP-NCAR reanalysis data.The results indicate that strong anomalous positive geopotential height centers existed from the lower to upper levels over Northeast China,and the related downward motions were directly responsible for the extreme high-temperature anomalies.The northwestward shift of the western Pacific subtropical high(WPSH)and the northeastward shift of the South Asian high concurrently reinforced the geopotential height anomalies and descending flow over Northeast China.In addition,an anomalous Pacific-Japan pattern in the lower troposphere led to the northwestward shift of the WPSH,jointly favoring the anomalous geopotential height over Northeast China.Two wave trains emanating from the Atlantic region propagated eastwards along high latitudes and midlatitudes,respectively,and converged over Northeast China,leading to the enhancement of the geopotential height anomalies.
KEYWORDS Large-scale circulation anomalies;heat wave in 2018 summer;Northeast China;wave activity flux
1.Introduction
Northeast China is located in the middle-and high-latitude region,and is affected by the East Asian summer monsoon system(Ding,Wang,and Sun 2008).In recent years,the temperature trend and the frequency of heat waves in summer in Northeast China have increased significantly(Qin,Sun,and Ni 2012).Extreme heat waves can impact human life and economic activities(Peng et al.2004;Na et al.2019).Therefore,it is necessary to understand the reasons that cause heat waves in Northeast China.
Large-scale circulation anomalies are thought to be an important factor leading to the occurrence of extreme heat waves(Xu et al.2005;Gao et al.2014;Na et al.2019).In general,accompanying heat-wave occurrence,the geopotential height field at 500 hPa features strong positive anomalies and the western Pacific subtropical high(WPSH)strengthens and shifts northwards,dynamically producing descending flows and continuous warm conditions near the surface(Meehl and Tebaldi 2004;Shen et al.2011).During extreme heat-wave events from 1960 to 2010 in Northeast China,the zonal circulation pattern at 500 hPa prevailed,accompanied by positive anomalies at 500 hPa over Northeast China(Qin,Sun,and Ni 2012).Another study also showed that the WPSH is significantly correlated with the frequencies of heat waves in Northeast China(Zhang et al.2016).Aside from local effects,remote factors may also be important for the summer climate over Northeast China(Gao et al.2014),among which ENSO is one of the leading factors.Specifically,the temperature in summer in Northeast China appears to be much higher than normal during La Niña(Wu et al.2010).The convection over the western Pacific,which can excite the Pacific-Japan(PJ)pattern(Nitta 1987;Huang and Sun 1992),is another crucial factor affecting the climate in East Asia.The PJ pattern leads to a strengthening and westward shift of the WPSH(Sun et al.2018),which can also contribute to extreme high temperatures in Northeast China.
In late July and early August,Northeast China was hit by a heat wave that broke the record of the previous 67 years in terms of the magnitude of high temperature.This extreme heat event occurred in Northeast China from 29 July to 4 August.In this study,we examine the characteristics of the large-scale circulation anomalies and the possible reasons for the heat-wave period in summer 2018 in Northeast China.
2.Data
Observed daily surface air temperature records at 2479 stations in China from 1951 to 2018 are used in this study.The air temperature records in 2018 are only available from January to September.The zonal wind,meridional wind, vertical velocity, and geopotential height from 1951 to 2018 are from the NCEP-NCAR reanalysis products at 6-h intervals(Kalnay et al.1996).The horizontal resolution is 2.5°×2.5°on 17 pressure levels from 1000 hPa to 100 hPa.According to the daily temperature anomalies,we define the heat wave period to be 29 July to 4 August 2018.
3.Circulation anomalies associated with the heat wave
Figure 1(a)shows the observed temperature anomalies relative to the climatological mean, averaged over 67 years from 1951 to 2017 during the heat-wave period.Almost all the stations in the north of North China and south of Northeast China exhibit positive anomalies.In the following,we focus on the temperature anomalies in the region(40°-45°N,105°-125°E).The daily observed surface airtemperature(SAT)of single stationswashigherthan 35°C,and the maxium anomalous temperature over this region exceeded 6°C during this heat-wave period.Figure 1(b)shows the evolution of SAT averaged over the region mentioned above.In late July and early August 2018,the daily mean SAT in Northeast China was 2°C-6°C higher than normal.In particular,the regional average SAT from 29 July to 4 August reached 28°C.
To understand the mechanisms responsible for the occurrence of the heat wave in 2018 over Northeast China,we first analyze the large-scale circulation anomalies.In general,the center of the geopotential height in summer at 500 hPa is located over the western Pacific(Figure 2(a)).However,during the heat-wave period,a significant anomalous positive geopotential height center existed over Northeast China in the middle troposphere,consistent with the distribution of the strong positive temperature anomalies shown in Figure 1(a).The time series of geopotential height at 500 hPa also shows that the WPSH reached its northernmost point(50°N)during the heat-wave period(Figure 2(b)),contributing to the positive anomalies of the geopotential height fields.
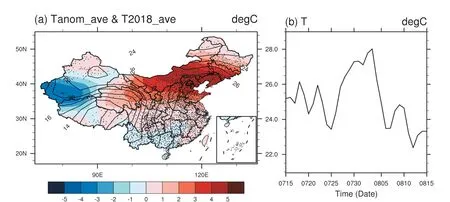
Figure 1.(a)Spatial distribution of the observational stations(dots),observed SAT(contours)and its anomalies(shading)during 29 July to 4 August 2018 relative to the 67-yr climatological mean(1951-2017)over China(units:°C).(b)Time series of areaaveraged SAT over Northeast China(40°-45°N,105°-125°E)from 15 July to 15 August 2018(units:°C).
In the upper troposphere,the ridge of the South Asian high(SAH)at 100 hPa is located near 30°N climatologically(Figure 3(a)).However,during the heat-wave period,the SAH extended northeastwards over Northeast China.The time-longitude cross section of geopotential height(Figure 3(b))shows that the westward shift of the WPSH was concurrent with the northeastward shift of the SAH,leading to significant positive geopotential height anomalies from lower to upper levels.Associated with this anomalous geopotential height, strong descending flows(Figure 4)over the region were observed throughout the whole troposphere,resulting in warming from 850 hPa to 200 hPa.Overall,during the heat-wave period in 2018 over Northeast China,the strengthened and westward shift of the WPSH and the northeastward shift of the SAH jointly reinforced the descending flows.In addition to adiabatic heating,descending motion can also affect the temperature via diabatic processes.The anomalous descending flow can lead to a reduction in precipitation and less cloud cover,further leading to an increase in downward solar radiation,in this case resulting in the heat wave over Northeast China.
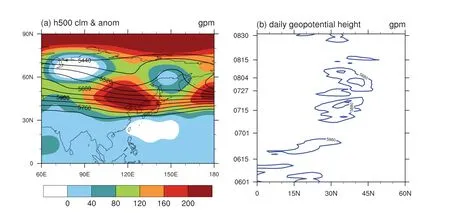
Figure 2.(a)Anomalies(shading;units:gpm)and 67-yr climatological average(1951-2017)of geopotential height(contours;units:gpm)during the heat wave at 500 hPa.(b)Time-latitude cross section of geopotential height averaged over 120°E at 500 hPa(contours;units:gpm)(contours above 5880 gpm are drawn).
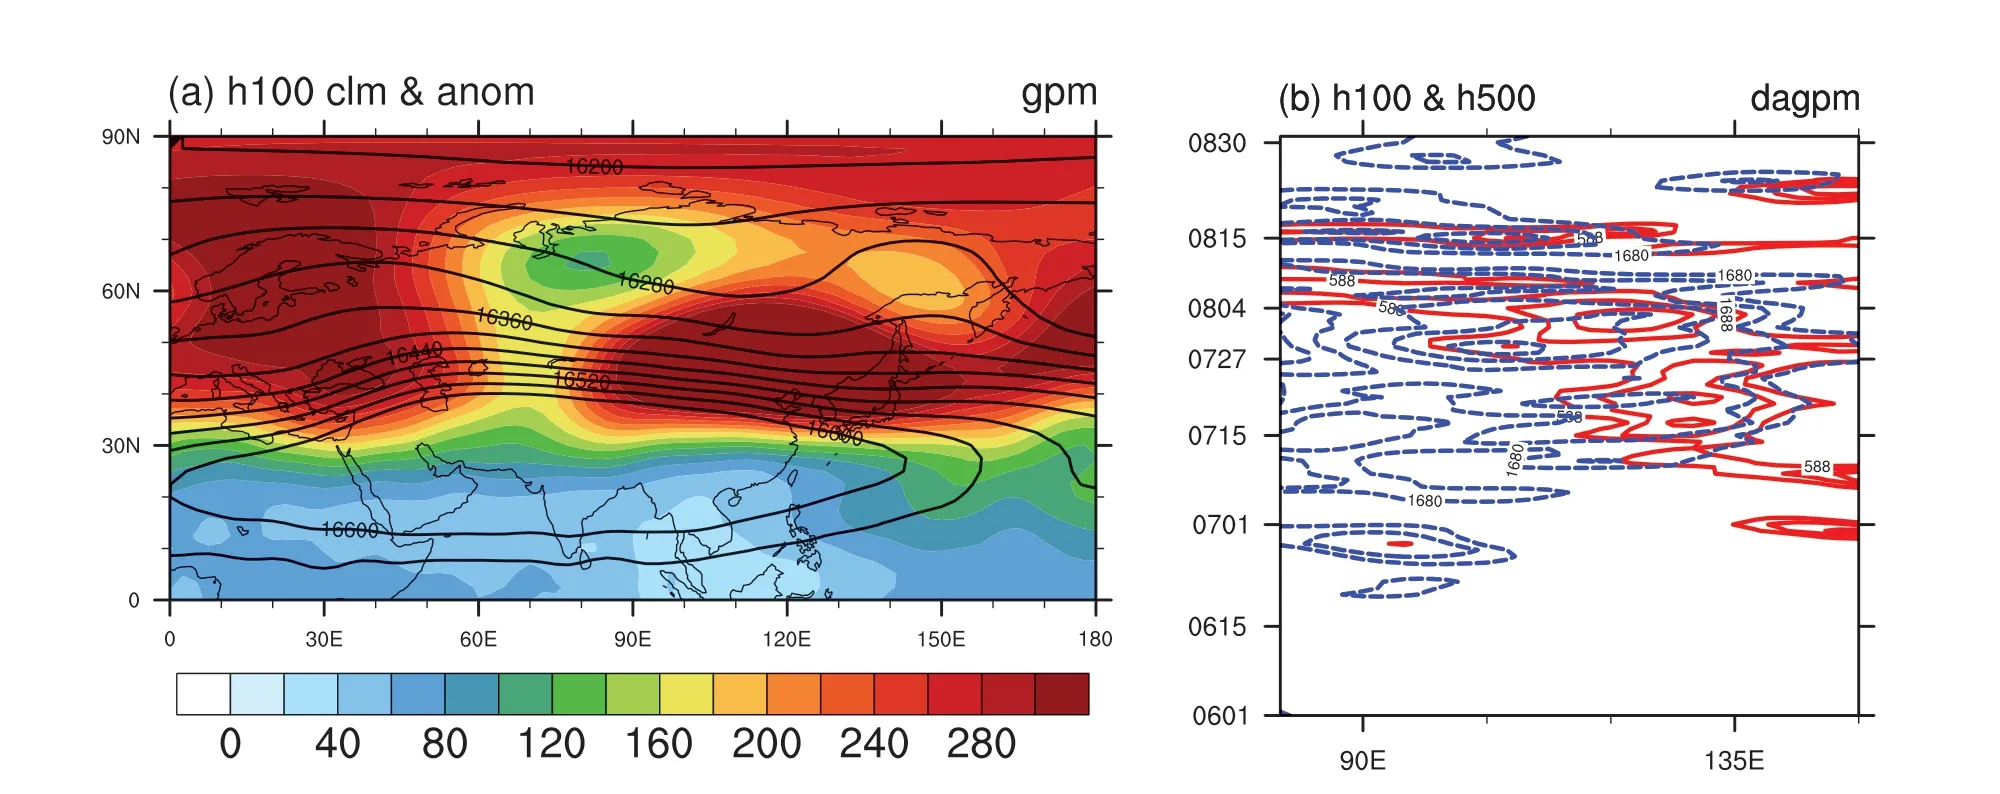
Figure 3.(a)Anomalous(shading;units:gpm)and 67-yr climatological mean(1951-2017)geopotential height(contours,units:gpm)during the heat wave at 100 hPa.(b)Time-longitude cross section of geopotential height averaged over 40°N at 100 hPa(contours in blue;units:dagpm)and 500 hPa(contours in red;units:dagpm).
Figure 5(a)presents the anomalous horizontal winds and the related circulation anomalies in the lower troposphere during the heat-wave period.There was a meridional tripole pattern over East Asia,with two anomalous cyclones over the South China Sea and Bering Strait along with an anomalous anticyclone between these two regions.Such a teleconnection is called the PJ pattern.Meanwhile,there was also a zonal wave train in the mid-to high latitudes,with two anomalous anticyclones over North Europe and Northeast China,as well as an anomalous cyclone over Siberia,coupling well with the PJ pattern.Besides the zonal wave train in the lower troposphere,there was a similar wave train in the middle and upper troposphere.
Besides,the East Asian jet stream is also linked with high temperature extremes(Wang et al.2013).Figure 5(b)shows the zonal wind at 200 hPa during the heatwave period in 2018 and its climatological location.Relative to the climatology,the poleward displacement of the subtropical jet stream associated with the eastward shift of the SAH may also have given rise to the extreme high temperatures over Northeast China.
The signals and propogation of the zonal wave train are clear at upper levels(Ding and Wang 2005).In order to examine the possible reasons for the heat-wave event,the anomalous geopotential height and the horizontal component of wave activity flux(W)(Takaya and Nakamura 2001)and its divergence(▽W)at 300 hPa during the heat-wave period were calculated. The results are shown in Figure 6,with ▽W<0 denoting convergence and ▽W>0 denoting divergence.
The wave activity flux can clearly illustrate the wave propagation(Takaya and Nakamura 2001).There are two wave trains that emanate from the Atlantic region:one that propagates eastwards to the Ural Mountains and then migrates southeastwards to East Asia,and another other that propagates directly southwards to the Mediterranean Sea and then eastwards along midlatitudes.These wave trains can also converge over Northeast China before the heat wave(figure not shown).Along with the propagation of these wave trains,there are also other convergence centers in the mid-to-high latitudes,in accordance with the anomalous geopotential height center at various pressure levels from 850 hPa to 100 hPa.Previous studies have shown that the dissipation of Rossby wave energy is able to reinforce disturbances downstream(Tao et al.2010).During the heat-wave period,the wave activity flux diverging out of the Atlantic region mainly converged over Northeast China,indicating that the Rossby wave was blocked and then led to the enhancement of the geopotential height anomalies over Northeast China.The westerlies to the north of the SAH were further strengthened,resulting in the poleward movement of the subtropical jet stream.However,after the heat wave,the wave activity flux was not obvious and the convergence was weakened.
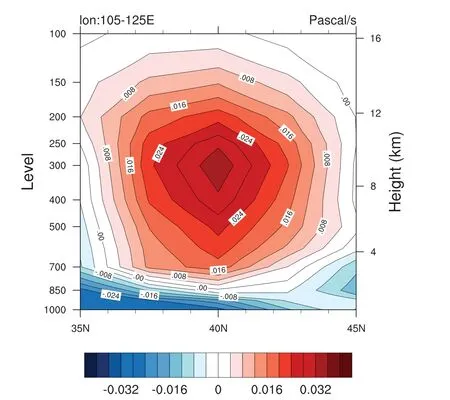
Figure 4.Vertical velocity averaged between 105°E and 125°E at various pressure levels(units:Pa s-1).
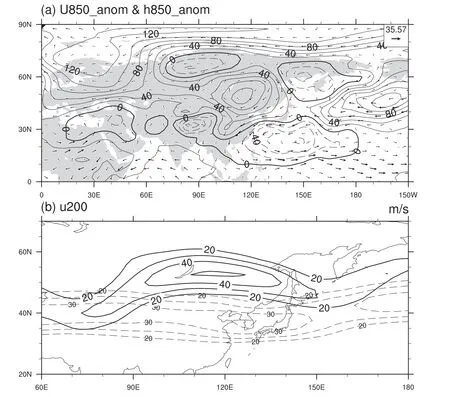
Figure 5.(a)Anomalous horizontal winds(vectors)and geopotential height anomaly(contours;units:gpm)at 850 hPa,with solid lines denoting positive anomalies and dashed lines negative anomalies.(b)200-hPa zonal wind during the heat wave in 2018(solid lines)and the climatology(dashed lines)with velocity above 20 m s-1.
4.Conclusions
In this study,the temperature anomalies and large-scale circulation features during the heat-wave period over Northeast China from 29 July to 4 August 2018 were examined.The focus was mainly on the temperature anomalies within the region(40°-45°N,105°-125°E).The observed daily temperature was higher than 35°C,and daily maximum temperature anomaly over this region exceeded 6°C during the heat-wave period in summer 2018.
This extreme high temperature event can be explained by the large-scale circulation features.The results indicate that anomalous positive geopotential height anomalies over Northeast China and the related downward motions played a crucial role in the extreme high temperature anomalies.The northwestward shift of the WPSH was concurrent with the northeastward shift of SAH,and the PJ pattern in the lower troposphere further led to the westward shift of the WPSH.Both of these factors jointly favored the geopotential height anomalies and descending flows over Northeast China.In addition,there are two wave trains that emenate downstream from the North Atlantic region:one that migrates southeastwards via the Ural Mountains,and another that propagates eastwards along low latitudes. The wave activity flux diverging out of the Atlantic region mainly converged over Northeast China,leading to the anomalous geopotential height anomalies.After the heat wave,the wave activity flux and its convergence were gradually weakened.
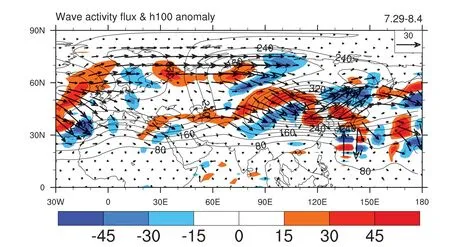
Figure 6.Anomalous geopotential height at 100 hPa(contours;units:gpm)and the wave activity flux(vectors;units:m2 s-2)and its divergence(shading;units:10-6 m s-2)averaged from 29 July to 4 August 2018.
Acknowledgments
We thank the editors and reviewers for their helpful suggestions for improving the manuscript.This work is supported by the National Natural Science Foundation of China under Grant 41775073.
Disclosure statement
No potential conflict of interest was reported by the authors.
 Atmospheric and Oceanic Science Letters2019年4期
- Atmospheric and Oceanic Science Letters的其它文章
- Interdecadal change in the lagged relationship between the Victoria mode and ENSO
- Synoptic-scale potential vorticity intrusion over northeastern China during winter and its influence on surface air temperature
- Recognition of two dominant modes of EASM and its thermal driving factors based on 25 monsoon indexes
- Climate change in the twenty-first century over China:projections by an RCM and the driving GCM
- A case study of environmental characteristics on urban road-surface and air temperatures during heat-wave days in Seoul
- Unprecedented East Asian warming in spring 2018 linked to the North Atlantic tripole SST mode