
Analysis of the Current Situation of Active Pharmaceutical Ingredient (API) Export in China
2019-09-16 01:50:10CorrespondingauthorDongLiassociateprofessorMajorresearchareapharmaceuticalintellectualpropertypharmaceuticalinternationaltraderesearchTel02423986543mailsydongli163com
亚洲社会药学杂志 2019年3期
* Corresponding author: Dong Li, associate professor. Major research area: pharmaceutical intellectual property, pharmaceutical international trade research. Tel: 024-23986543, E-mail: sydongli@163.com.
Abstract Objective To analyze the problems of API export in China and to study the current international and domestic trading environment. Methods Data statistical analysis was used to study the export situation of APIs, and PEST was applied to analyze the current export problems. Results and Conclusion API export in China is now experiencing a growth period and the international trading environment is constantly improving.
Keywords: active pharmaceutical ingredient (API); export trade; environmental analysis
Under the background of global economic recession, China’s import and export trade in the past few years was also affected to a certain extent.In 2017, the global economy recovered significantly.Therefore, the import and export trade of APIs grew rapidly, reaching a new record of 37.84 billion US dollars, up 13.84% year on year. China has been a major importer and exporter of APIs, and the proportion of western pharmaceutical preparations and biochemical products with high added value is increasing fast[1].
1 Current situation of API export in China
1.1 The total export volume of APIs in China is increasing year by year
With the development of China’s pharmaceutical industry, its API production and participation in the global pharmaceutical industry attract international attention. At present, more than 1500 APIs and intermediates can be produced in China. With the continuous improvement of production technology and quality level, China becomes a world-renowned producer and exporter of APIs. According to the statistics of 2017, China’s production and export of APIs leaped to the top in the world. The total amount of APIs exported to the international market is increasing year by year, accounting for 27.7% of the global market of generic APIs[2](See Fig. 1and Fig. 2).
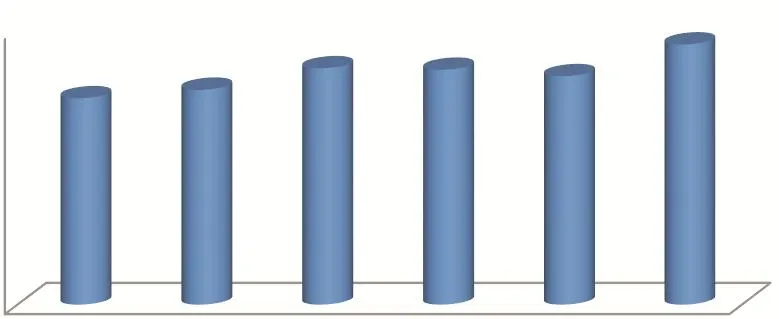
Fig. 1 Change of the total import and export volume of APIs from 2012 to 2017 (Unit: US$100 million)

Fig. 2 Changes in the volume and amount of API export between 2012 and 2017 (Unit: 10,000 tons, US dollars)
After years of efforts and technical innovation,China has made breakthroughs in the production stage of low-end bulk APIs. For example, in the past, only low-end APIs such as vitamins could participate in the international market competition. Now there are a large number of characteristic APIs that participate in the international market competition, even including some high-end APIs. Some scholars predict that the competitiveness of China’s API industry will increase.On the one hand, through the continuous accumulation of technology and talents, the production and R&D capabilities will be improved. On the other hand, the cost advantages can be maintained in international trade.
1.2 China’s API export market structure
For a long time, Asia, Europe and North America have been the major export regions of China’s APIs.This pattern has remained basically stable. The demands for APIs in the top three markets maintain a steady growth rate every year. In 2017, the proportions of APIs import were 46% in Asia, 27.9% in Europe and 14.5% in North America.
China’s export of APIs to the Asian market is dominated by low-price products. Low-price is the main competitive advantage in the region. China’s export price of APIs is about 12% lower than the average price in other markets. Exports to Asia reached 46.822 million tons in 2017, amounting to $13.384 billion, an increase of 11.59% over the previous year. However, the prices of APIs exported to European and North American markets are generally higher. In 2017, the export volumes to these two regions were 1868,900 and 836,200 tons, respectively,with an export value of 8.127 and 4.222 billion US dollars. The average export price to EU countries and regions is 49% higher than the average export prices of other markets, while the price of raw materials exported to North America is 55% higher than the average export price of other markets[3]. It can be seen that the exports of APIs to these two regions are products with higher quality and higher added value. In addition, it also shows a growing trend of certain requirements and stimulating effects on the improvement of the production capacity and quality of China’s APIs (See Fig. 3, Fig. 4 and Table 1).
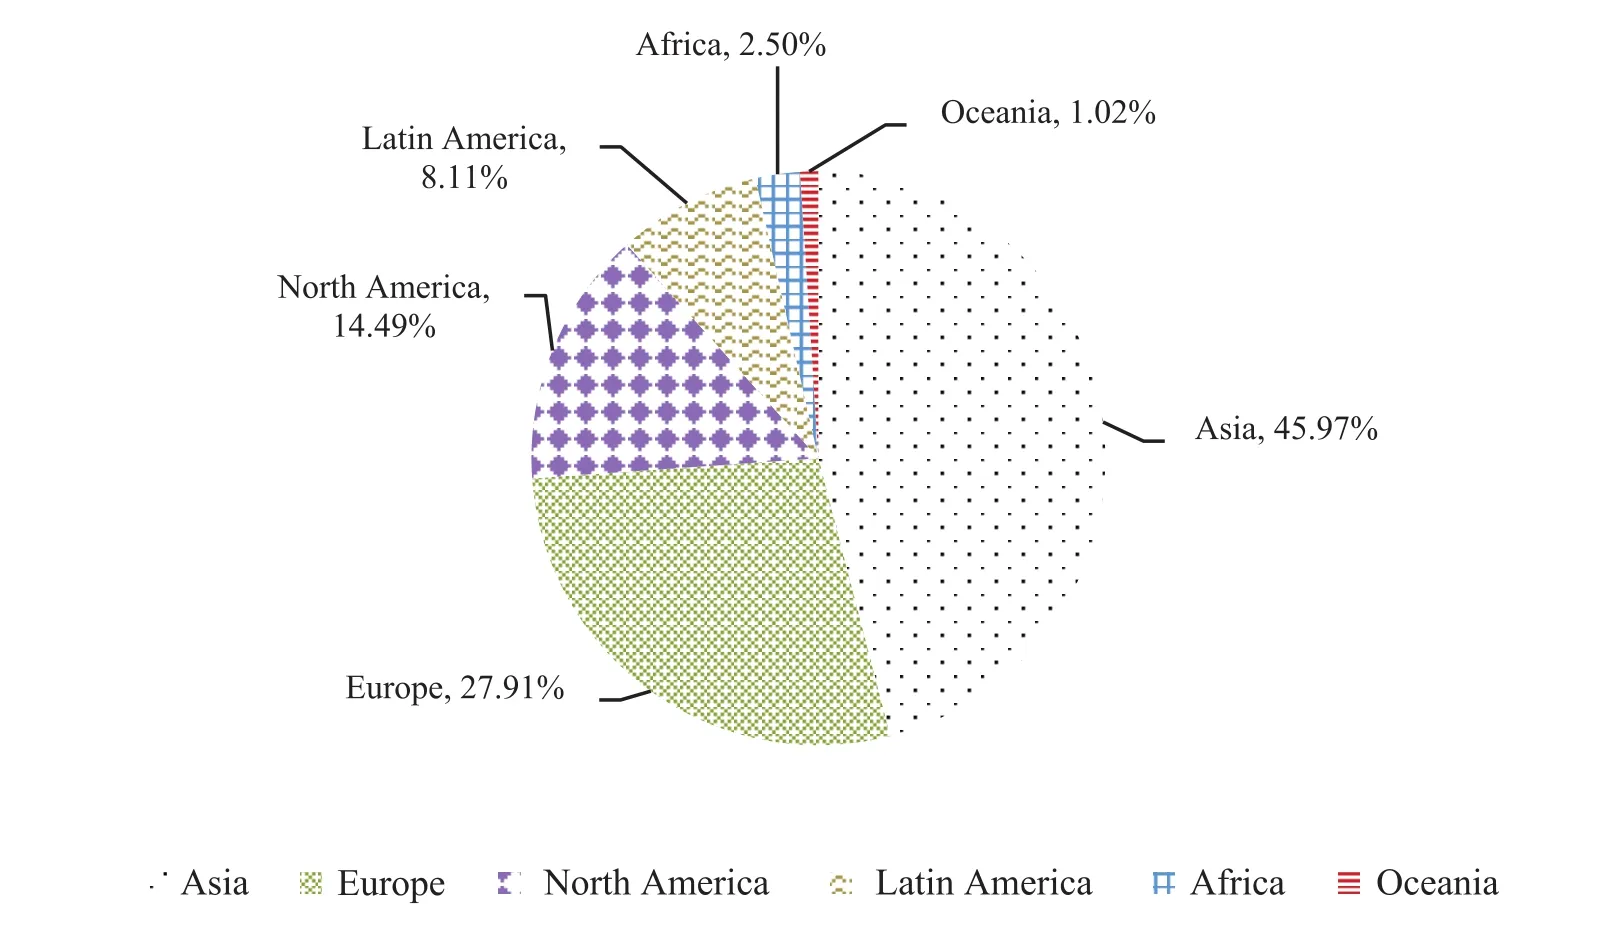
Fig. 3 Distribution of China’s API export market in 2017
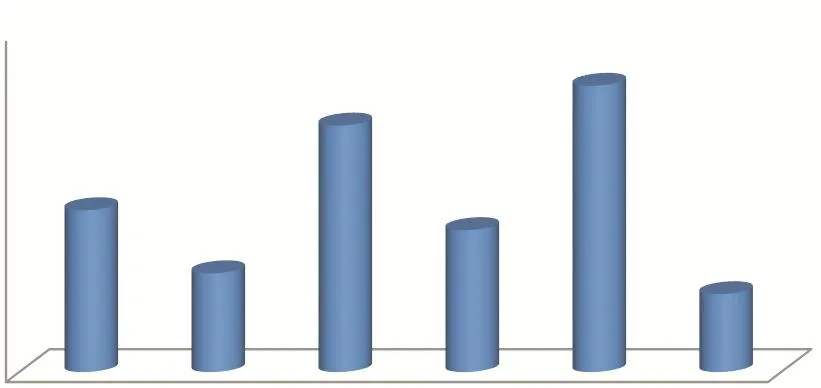
Fig. 4 Average price of API export market in 2017

Table 1 Top 10 countries or regions on the list of China’s API export in 2017
According to the subdivided data of exporting countries, China’s APIs were exported to 195 countries and regions in 2017. Since 2016, some importing countries and regions in the international market have frequently initiated trade disputes on China’s APIs. At the same time, on-site inspection of China’s APIs enterprises has been intensified. All these bring pressure and challenge to China’s export of APIs. India is the largest export destination for China’s APIs. In 2017, India imported 4.427 billion US dollars of APIs from China, an increase of 13.52%over the same period of last year, and the volume and price of APIs increased simultaneously. After India,the United States is the second largest export target country for China. In 2017, it imported 3.92 billion US dollars of APIs from China, an increase of 23.84%over the same period of last year. The data show that the growth rate of APIs exported to the United States is the highest in the same year. Experts believed it was due to the lifting of the import ban for some APIs enterprises in China by the United States in 2017.Japan, South Korea, Germany and the Netherlands are the next four countries, and Italy and Spain continue to rank among the top ten. It is worth mentioning that Brazil’s import quota of APIs from China increased by 23.11% in 2017, making it the seventh largest importer of APIs from China.
From the overall export pattern, the top ten import countries and regions for China’s APIs accounted for 61% of the total in 2017, which shows that the concentration of China’s APIs export is relatively high.
1.3 China’s API export enterprises
According to statistical data, 11,000 enterprises were engaged in API export business in China in 2017. Private enterprises are the main ones under the situation of four years’ continuous growth. The number of API export enterprises increased by 707 in 2017 compared with 2016, 698 of which were private enterprises. Moreover, as the main force of API export in China, these private enterprises have strong export vitality. The total export value of private API export enterprises in 2017 was 18.036 billion US dollars,accounting for 62%. In recent years, the export volume of raw material drugs from state-owned enterprises has been decreasing continuously. In 2017, the export value of API from state-owned enterprises was 3.76 billion US dollars, a drop of 13%. The performance of joint ventures increased in 2017, but their share shrank to 25%.
2 Analysis of the export climate of APIs in China
2.1 International business climate
The World Bank’s Doing Business 2019:Training for Reform, published on October 31, 2018,showed the current ranking of business climate in 190 economies.
The ranking data indicated that the global business environment is improving. The business environment testing project was founded by the World Bank in 2003. It mainly deals with the business of 190 economies by 11 first-level indicators: starting a business, getting electricity, dealing with construction permits, getting credit, labor market regulation,registering property, paying taxes, protecting minority investors, enforcing contract, trading across borders and resolving insolvency. The environment is tested.According to statistics, 186 out of 190 economies have implemented more than 3500 business reforms since 2003[4](See Fig. 5).
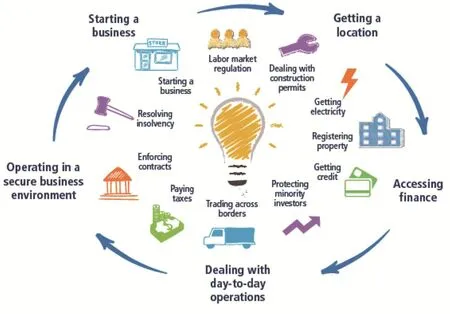
Fig. 5 The main contents of the business situation need to be examined
China’s business climate has improved rapidly.According to the World Bank report in 2017, China ranked 78th in 2018. While the report of 2018 showed that China’s business regulatory environment advanced 32 places in 2019, ranking 46th and entered the top 50 in the world for the first time. This will lay a very good competitive advantage for China’s economic position in the international market.
According to the statistics of the Chamber of Commerce for Import and Export of Chinese Medical and Health Products in 2017, the business environment of the top 10 target countries for China’s APIs export is among the best in the world (See Table 2).

Table 2 Top 10 countries of API export and their business environment ranking
As can be seen from the table above, the business climate of several major target countries and regions for China’s export of APIs is very good, except for Brazil whose ranking is after 100th. Other countries and regions have very good business environment as well.
The degree of trade facilitation in various countries and regions is also an important indicator of their trade development and prosperity. The Global Enabling Trade Report is the authoritative data information issued by the World Economic Forum and the Global Trade Facilitation Alliance.
The report measures trade facilitation from seven specific indicators: domestic market entry, foreign market entry, availability and quality of transport infrastructure, efficiency and transparency of border management, information and communication technology, availability and quality of transport services, and business environment, which is published every two years. According to the data released in 2016, Singapore, Hong Kong and many European economies ranked the top among 136 monitored economies, while China ranked 61st in terms of trade facilitation, 2 places up from the 63rd in 2014[5].
The ranks of the Trade Facilitation Index of the main economics in the regions where API export are relatively high, which will bring greater benefits to China's API trade. From the ranking table of trade facilitation index, we can see that among the top ten import countries of API from China, except for India and Brazil whose ranks of the Trade Facilitation Index are lower, the other countries and regions are developed ones, which offers a good market environment for China’s API export (See Table 3).
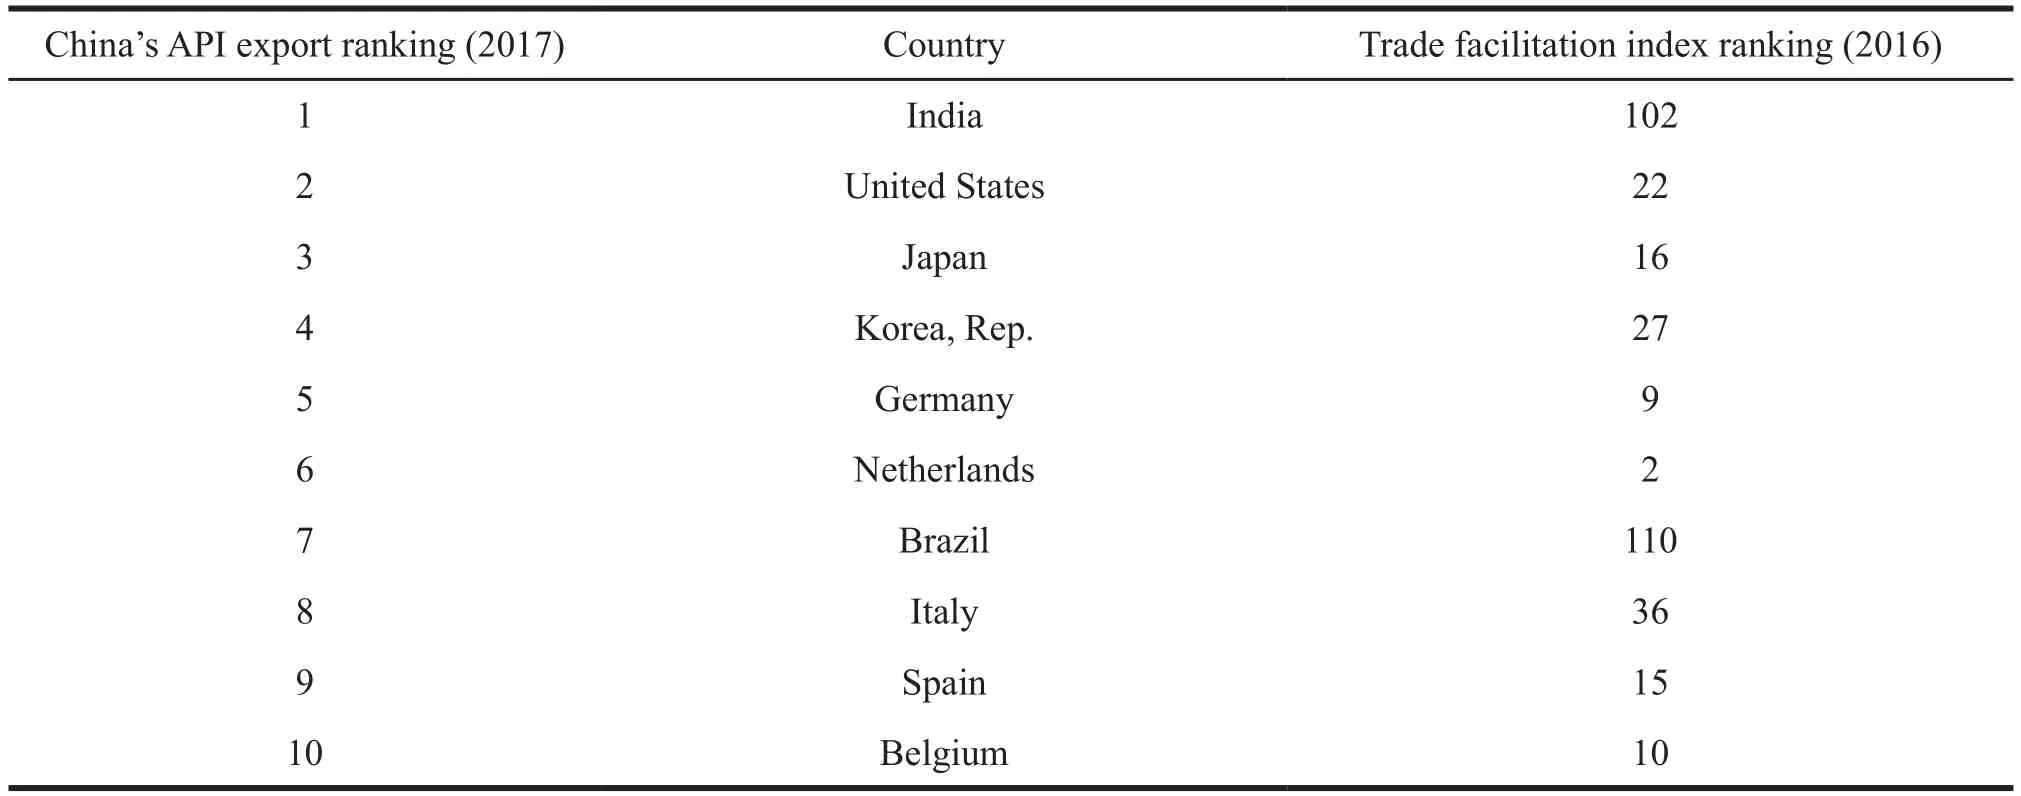
Table 3 Top 10 API import countries and their trade facilitation index ranking
2.2 Analysis of global trade climate for APIs
The rapid growth of global drug sales and better development trend will bring good expectations to API industry. As the upstream industry of pharmaceutical industry, API industry will certainly keep pace with the development of pharmaceutical industry. The value of global API market was $13.8 billion in 2015 and $155 billion in 2017, with a very rapid growth rate. The market of exclusive use of APIs accounts for 61.3%of the global APIs market, while the other 38.7% of APIs market share is achieved through outsourcing.Among them, 59% are produced by pharmaceutical manufacturers themselves, and the remaining 41% are produced and sold by third parties to pharmaceutical manufacturers, of which 70% are APIs and 30% are intermediates.
From the use and sales of APIs, North America accounts for 35% of the global APIs market share,which is the largest region where APIs are used.If data are collected from the Asia-Pacific region(including the United States and Canada), the API sales market in this region accounts for nearly 60% of the global API market, and it becomes the largest API sales market. The growth of traditional API market in Europe is slow, and due to the constraints of industrial development, the growth of pharmaceutical market in South America and Africa is not fast as well.
From a global perspective, the major production areas of APIs are China, India, Japan, North America and Western Europe. The main export area of APIs is Western Europe and the main import area is North America. Meanwhile, Japan is basically self-sufficient.The major production countries of APIs are China and India, two developing countries.
2.2.1 The United States
The United States is the largest purchaser of Chinese APIs. According to the statistical data, 317 Drug Master File (DMF) numbers have been obtained by Chinese pharmaceutical manufacturers from the US FDA, of which about 200 are the approval numbers of APIs produced by Chinese manufacturers. According to the number of varieties, it can be seen that China exported most of the APIs, such as antibiotics,antineoplastic drugs, and antipyretic and analgesic to the United States.
2.2.2 Western Europe
High value-added and patent-protected largecontract APIs are the main types of APIs produced by Western European pharmaceutical manufacturers.However, Chinese APIs are still very competitive in this region because of the low prices. Therefore, in recent years, more and more European pharmaceutical manufacturers purchase pharmaceutical materials for the production of pharmaceutical preparations from Asia (mainly China and India) and the variety and quantity of pharmaceutical preparations are increasing. Europe is the main market for the import of pharmaceutical materials from China. According to the statistical data, more than 800 kinds of APIs have been imported from China and India by European pharmaceutical enterprises. With the expansion of exports, many Chinese APIs have received COS/CEP certificates issued by the European Drug Quality Administration (EDQM), most of which are APIs.
However, from the perspective of Western Europe as a whole, its total output value of APIs is close to 6 billion US dollars, accounting for 50%of the global total. Therefore, it is the largest API production base in the world, and its export volume is also very considerable, accounting for more than 80%of its total output.
2.2.3 Japan
The output and consumption of APIs in Japan are basically the same. The market size of APIs in Japan is smaller than that in the United States and Western Europe. APIs in Japan are basically selfsufficient. In recent years, with the rising cost and the pressure of environmental protection, some domestic pharmaceutical manufacturers gradually abandon the production of some low-end APIs and purchase them from the international market. Therefore, we can foresee that Japan has a promising API market in the future. Japan is expected to become one of the major importers of APIs, which will bring an opportunity for China’s API export. The MF certification in Japan is a necessary condition for other countries to enter the Japanese APIs market. It means that the qualifications of foreign manufacturers should be approved by Japanese authorities.
2.2.4 India
About 90% of India's total output of APIs is for international sales, and it is the major producer of APIs in the international market. Because of the strong R&D and imitation capability of its pharmaceutical enterprises, these well-known pharmaceutical manufacturers have been implementing the product development strategies in the markets of Europe,America and Japan. Exports of generic drugs in these areas are increasing day by day, and there will greater exports growth in the next few years. In addition, the patent protection period of a large number of products is about to expire in these countries and regions,India has planned to shift the sales of APIs from non-regulatory market to the regulatory market. From the statistical data, we can see that the regulatory markets of Europe, America and Japan are also the major import targets for some Indian leading APIs manufacturers.
In the international APIs market, China and India are both competitors and trading partners. According to statistics, about 25% of APIs used by Indian pharmaceutical industry was imported from China. In recent years, the quantity of APIs imported from China has increased. On the one hand, Indian pharmaceutical enterprises are committed to the overseas market with higher profits. On the other hand, the prices of Chinese APIs sold in Asia are lower than those in other regions, which make it easy for Chinese APIs to occupy India's less profitable market share.
3 Development trend of global API industry
3.1 Global API market will continue to expand
From the point of view of the existing global pharmaceutical market, patent drugs in developed countries are still the main profit growth point. The mode of innovation protection relying on patent system will continue. This is the characteristics of the pharmaceutical industry. The huge market profits brought by patent drugs make multinational pharmaceutical groups form a virtuous circle of R&D and innovation. However, with time passing by, new listing of patented drugs slow down and drug varieties become fewer. Global drug patents will expire on a large scale in the next 20 years, generic drugs will inevitably be developed vigorously. On the one hand, many governments will strive to promote the development of generic drug market to control medical expenditure. On the other hand, generic drug manufacturers urgently need to put their products on the market to earn the market share as soon as possible. This will promote the development of generic drugs in the global drug market, thus driving the rapid growth of global demand for generic APIs.
According to the current international API market scale, generic APIs account for 43.5% of the total APIs in the world. Meanwhile, brand or innovative APIs account for 56.5%. The global market demand for human APIs reached about US $143 billion in 2016 and US $155 billion in 2017, it is expected to reach US $225 billion by 2021 at a compound annual growth rate of 6.5%.
3.2 Characteristic APIs face unprecedented opportunities for development
According to statistics, 631 patented drugs expired in 2016 globally, and many patent protections would expire in the following years. According to the report of Evaluate Pharma World Preview, global brand sales are expected to reach $194 billion between 2017 and 2022. In 2018, about $31 billion of patented drugs expired, and the top five of the most famous prescription drugs were Pradaxa (dabigatran), Xolair(omalizumab), Namzaric (memantine/donepezil),Revlimid (lenalidomide) and Astepro (azelastine). In fact, the golden age of generic medicine came when the protection period of a large number of patented drugs expired in 2012. After a large number of generic drugs enter the market, the consumption of these drugs will increase substantially because of their low prices.At present, according to the statistics of global drug consumption, generic drugs account for a large share of all drug prescriptions. Due to the unprecedented development of generic drugs in the international market, there will be an increase in demand for characteristic APIs. According to the data, the proportion of APIs for generic drugs is about 48.7%,which will bring good opportunities for manufacturers of characteristic APIs.
Conclusion: Through the analysis of China’s API export, we can have a better understanding of the overall situation of API export so as to grasp the development trend of API export in the future. At present, with the improvement of technology, the production cost of APIs in China decreases gradually and we still can maintain the cost advantage. Due to the low per capita wage, complete supporting facilities, large production scale, adequate supply of raw materials and the continuous accumulation of technology and talents, the competitiveness of China’s API industry is expected to continue to increase.
- 亚洲社会药学杂志的其它文章
- Information for Authors
- Regulation of Drug Clinical Trials in China: Course and Development Trend
- Pharmacy Service in Private Hospitals: Problems and Countermeasures
- Licensed Pharmacists in Pharmaceutical Retail Enterprises in China:Problems and Countermeasures
- Empirical Study of the Relations between Executive Compensation Gap and R&D Investment in Pharmaceutical Manufacturing Enterprises
- Risk Control Strategy in the Research and Development of Pediatric Drugs