
Study on Infrared Fingerprint of Cryptolepis buchananii Roem. et Schult.
2019-09-10 07:22:44ChenyanLIANGLuZHANGLiWANGYunliTANGHanshenZHEN
农业生物技术(英文版) 2019年6期
Chenyan LIANG Lu ZHANG Li WANG Yunli TANG Hanshen ZHEN
Abstract [Objectives] This study was conducted to establish the infrared fingerprint of Cryptolepis buchananii Roem. et Schult.
[Methods] Ten batches of C. buchananii from different habitats were determined by Fourier transform infrared spectroscopy. The experimental data were clustered by Omic software and Ward method.
[Results] The infrared fingerprints of C. buchananii were obtained, and the similarity was all greater than 0.9.
[Conclusions] The established method has good stability and controllability and can be used for the identification of C. buchananii.
Key words Cryptolepis buchananii Roem. et Schult.; Infrared fingerprint; Similarity; Cluster analysis
Received: July 23, 2019Accepted: October 27, 2019
Supported by The Basic Ability Improving Project of Young and Middleaged Teachers in Guangxi (2019KY0324); Graduate Program of Guangxi University of Chinese Medicine (xjyb019);Collaborative Innovation Center for Zhuang and Yao Medicines (zyx[2015]01); General Project of Guangxi University of Chinese Medicine (P2010016); Subproject of Key Laboratory of Pharmacology of Traditional Chinese Medicine (J16072).
Chenyan LIANG (1979-), female, P. R. China, associate professor, devoted to research about Chinese medicine effective components and quality control method.
*Corresponding author. Email: 214998680@qq.com.
Gugouteng refers to the rhizome of Cryptolepis buchananii Roem. et Schult. in Cryptolepis of Asclepiadaceae[1]. C. buchananii is also known as Baiyeteng, Baimalianan, Niujiaomo, Duanchangcao[2], Daanxiao Banjianiu, Baiduzong and Baijiangteng[3]. It is mainly distributed in Guangdong, Guangxi, Yunnan and other places in China, and is also distributed in India, Myanmar, Sri Lanka and Vietnam[4]. C. buchananii has the functions of relaxing tendons and activating collaterals, relieving swelling and pain, relieving internal heat or fever, and is used to treat lumbago, abdominal pain, bruises, fractures, hemorrhoids, convulsions and other diseases[5]. C. buchananii is also used in the treatment of cancer, asthma, cough and rheumatoid arthritis in the folk[6]. In recent years, there has been no domestic and international analysis of the quality of C. buchananii, while the infrared "fingerprint" can quickly identify the chemical composition of traditional Chinese medicine, with many characteristics and advantages of real, overall, comprehensive and macroscopic[7]. In this study, Fourier transform infrared spectroscopy was applied to systematically study the infrared spectrum of C. buchananii, and a C. buchananii infrared spectrum library was established, which can be used for the identification of C. buchananii. This study will provide an important experimental basis for the quality analysis of C. buchananii.
Experimental Materials
Instruments
IS10 infrared spectrometer (Thermo Nicolet); FW4A powder compressing machine (Tianjin Tuopu Instrument Co., Ltd.); electric thermostat blast drying oven (Model: DHG9203A, manufacturer: Shanghai Qixin Scientific Instrument Co., Ltd.).
Materials
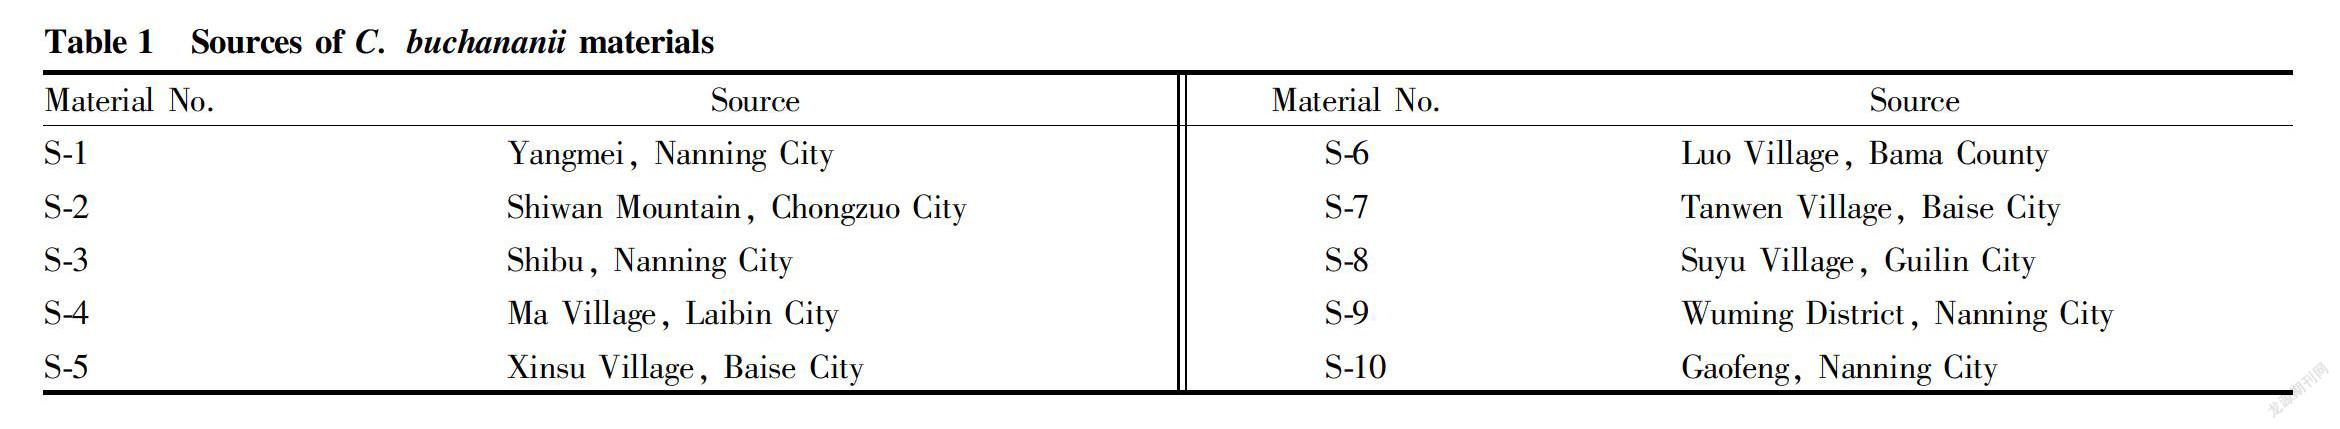
Potassium bromide (spectrum pure) was purchased from Sinopharm Chemical Reagent Co., Ltd.), and other experimental reagents were analytically pure. C. buchananii materials were collected from Guangxi, and were identified as the stems and leaves of C. buchananii Roem. et Schult by pharmacist Ma from Guangxi Yixin Medical Co., Ltd. The sources are shown in Table 1. The medicinal materials were treated for later use.
Methods and Results
Sample preparation
The C. buchananii was placed in an oven at a constant temperature of 60 ℃ to dryness, crushed through a 200 mesh sieve, and set aside. Then, 1 mg of sample powder was mixed with potassium bromide at a ratio of 1∶200, obtaining a mixture which was ground evenly in an agate mortar under an infrared lamp and dried for 30 min. Finally, the mixture was manually compressed into a transparent sheet.
Sample determination
The measurement was performed by Fourier spectrophotometer (FTIR) with a scanning resolution of 8 and a scanning frequency of 16. The interference of H2O and CO2 was deducted, and the spectral scanning range was 4 000-400 cm-1. The infrared spectra of C. buchananii were recorded.
Methodological study
Precision test
The S1 medicinal material was taken and measured continuously for 6 times according to the method under "Sample determination", and the infrared spectra were recorded. The experimental results showed that the spectra were consistent, and the correlation coefficients were 0.999 8, 0.999 8, 0.999 9, 0.999 9, 0.999 8 and 0.999 7, respectively, with a RSD value of 1.05% (n=6). It indicated that the instrument used was of good precision.
Stability test
The S1 medicinal material was taken and measured according to the method under "Sample determination" once every 2 h for 6 times in total, and the infrared spectra were recorded. The experimental results showed that the spectra were consistent, and the correlation coefficients were 0.999 8, 0.999 8, 0.999 9, 0.999 8, 0.9998 and 0.999 7, respectively, with a RSD value of 1.03% (n=6). It indicated that the sample was stable within 12 h.
Reproducibility test
Six parts of the medicinal material were taken and measured according to the method under "Sample determination", respectively, and the infrared spectra were recorded. The experimental results showed that the spectra were consistent, and the correlation coefficients were 0.999 8, 0.999 8, 0.999 8, 0.999 9, 0.999 7 and 0.999 6, respectively, with a RSD value of 1.41% (n=6). It indicated that the method had good reproducibility.
Fingerprint establishment
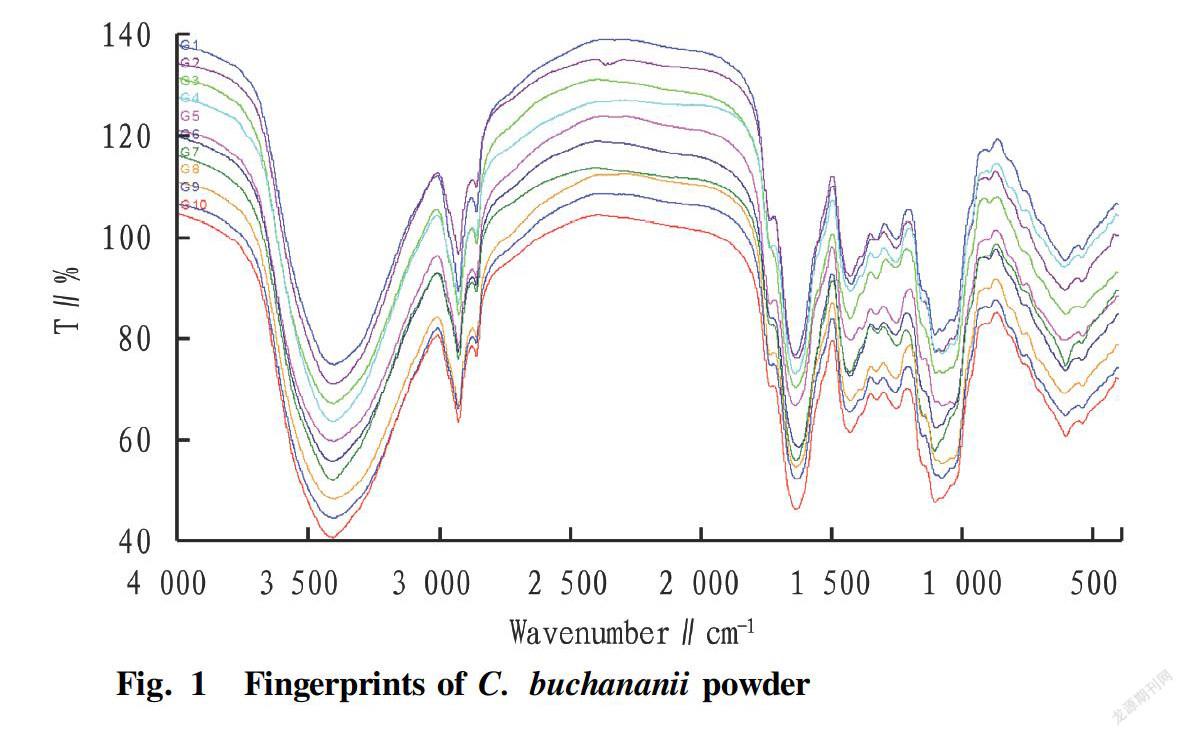
Ten batches of C. buchananii from different producing areas in Guangxi were taken and measured according to the method under "Sample determination", obtaining the infrared spectra of the 10 batches of C. buchananii, which were recorded (Fig. 1).
Analysis and Discussion
Fingerprints
In the analysis test, the scan number (4, 8, 16, 32) and the resolution (4, 8, 16, 32) were investigated. According to different conditions, the smoothness and peak shape of each spectrum were determined, and the scan times and the resolution were determined to be 16 and 8, respectively.
It can be seen from Fig. 1 that the infrared spectra of C. buchananii from different producing areas had a large similarity and showed common characteristic peaks, but there were also some differences, which were mainly manifested by the difference in the relative absorption intensity of each characteristic peak and the small differences of the small peaks in fingerprint regions, which might be related to differences in habitat condition. However, the main chemical components were similar in the position of the absorption peak in the infrared spectrum. The absorption peak intensity and spectral bandwidth at 3 400 cm-1 attributed to the stretching vibration peak of OH; the saturated CH stretching vibration peaks were at 2 920 and 2 850 cm-1; the peak at 1 650 cm-1 was the C=O stretching vibration peak of C. buchananii alkaloid affected by the transannular effect; and those at 1 419 and 1 246 cm-1 were the stretching vibration peaks of CO in C. buchananii glycosides; and the peak at 1 050 cm-1 was the bending vibration peak of OH.
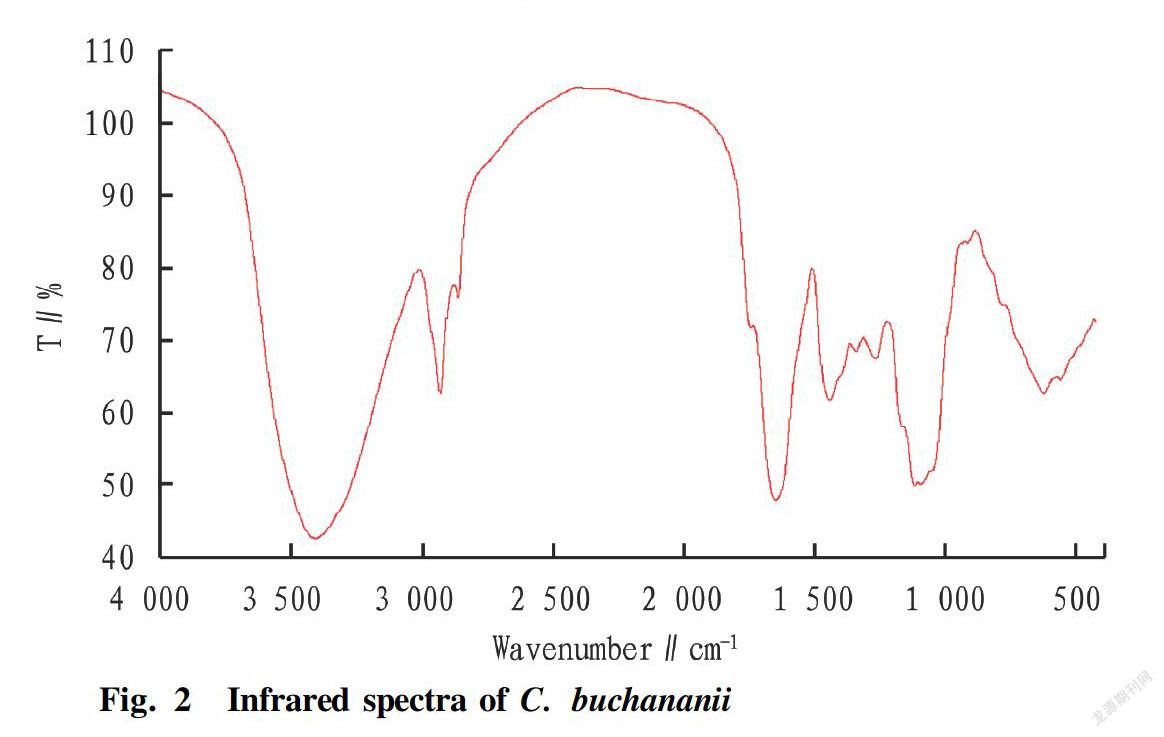
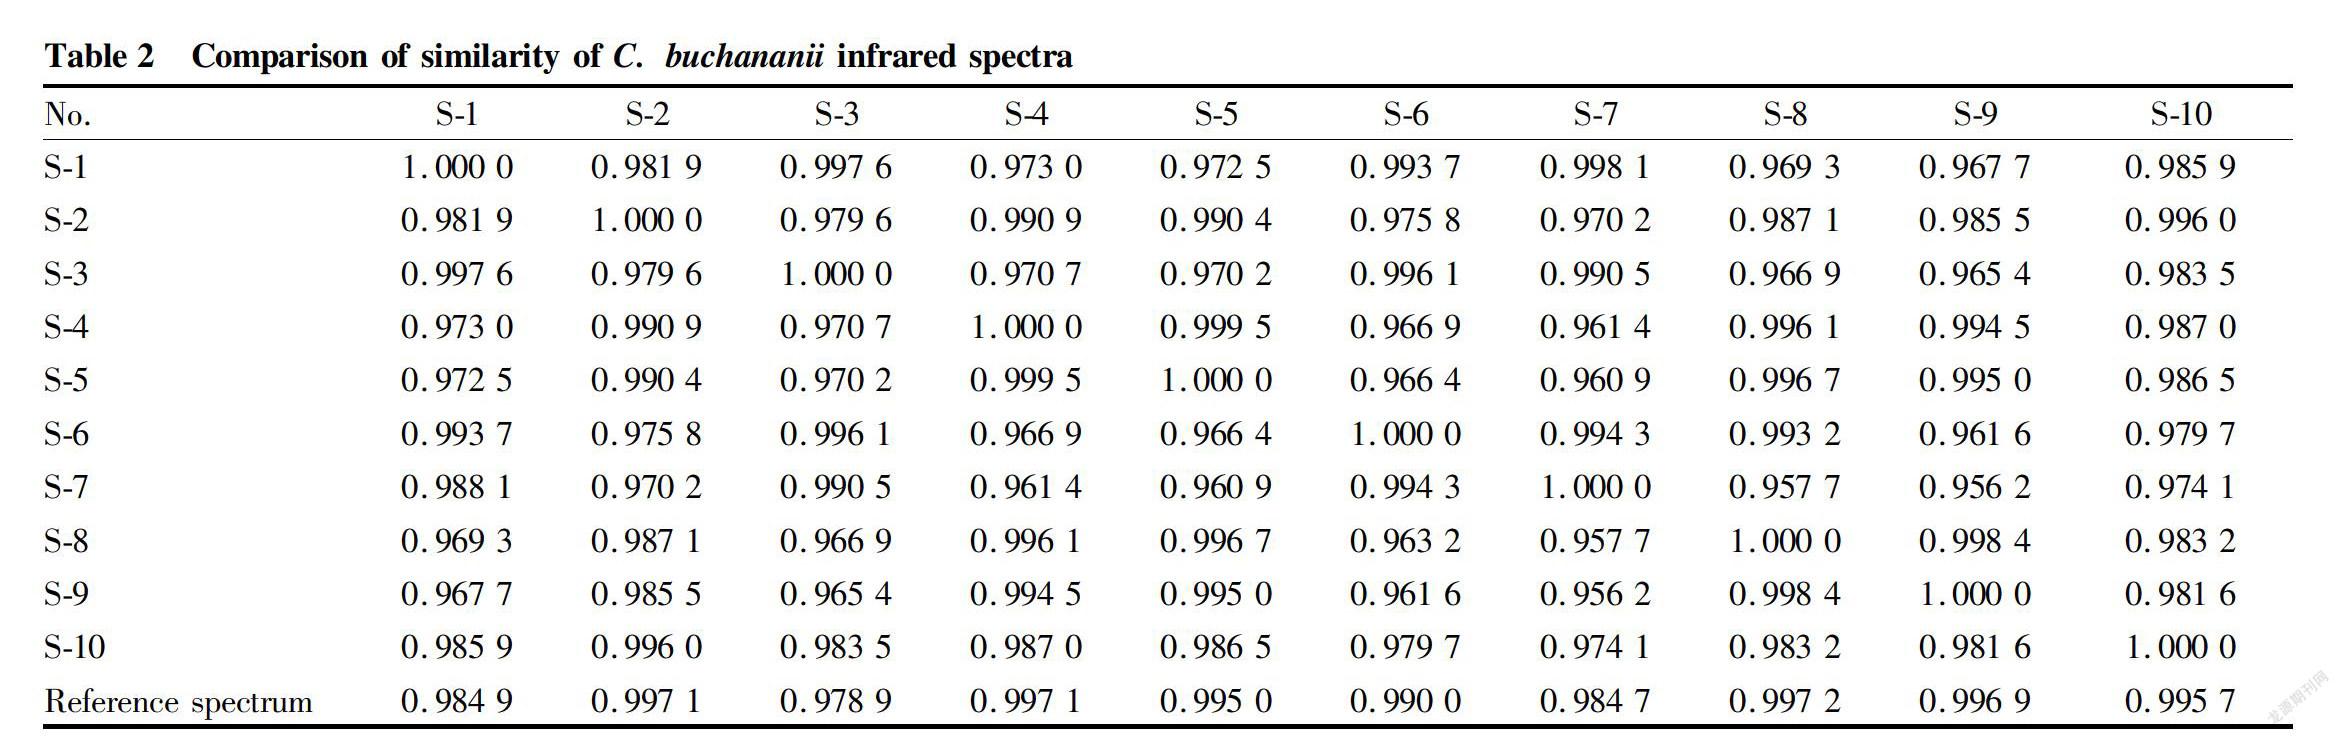
The reference spectrum obtained after the processing with Omic software was used to create a spectral library for similarity comparison. The similarity of the infrared spectra of the 10 batches of C. buchananii was over 0.956 2. Compared with the reference spectrum, the similarity was over 0.978 9. It indicated that the infrared spectra of C. buchananii from different habitats were basically consistent with the established reference spectrum. The infrared fingerprints of C. buchananii from different habitats had higher similarity and good consistency, as shown in Fig. 2 and Table 2.
Cluster Analysis of Infrared Spectral Data of C. buchananii Stems and Leaves from Different Producing Area
Extraction of cluster analysis data
The infrared spectra of the 10 batches of C. buchananii showed obvious differences in peak intensity in the range of 1 600-600 cm-1. The wavenumbers of this band were extracted as the original data for pattern recognition, and the wavenumbers of the infrared spectra of the 10 batches of C. buchananii leaves and stems were derived as the basis for data analysis.
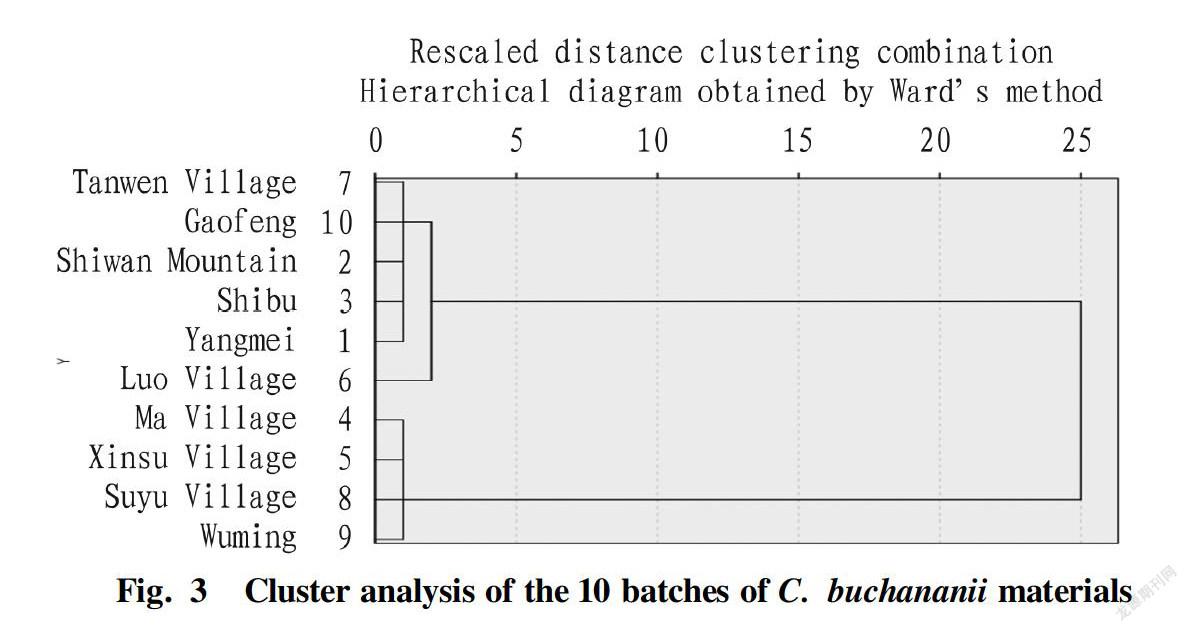
Cluster analysis results
The Euclidean distance squared sum was selected as the measure of samples by the Ward method. The FTIR fingerprint data of the C. buchananii medicinal materials were clustered and analyzed. The 10 batches of C. buchananii leaves were divided into three groups: the first group including Yangmei, Shiwan Mountain, Shibu, Luo Village, Tanwen Village and Gaofeng, the seconding group including Ma Village, Suyu Village and Xinsu Village, and Wuming as the third group. The results are shown in Fig. 3.
Conclusions
With the development of computer technology, Fourier infrared spectroscopy technology is more and more widely used, involving almost all fields of natural science. In recent years, it has also played an important role in drug quality control, food, and botanical identification[8-10]. Nearinfrared spectroscopy technology can quickly determine effective components without destroying the sample. Although the sensitivity is relatively low, it has the advantages of simple operation, fast analysis speed, high analysis efficiency, low analysis cost, no pollution, and no pretreatment of samples, good reproducibility, easy online realization and so on. In this study, the medicinal material powder was compressed into sheets. According to the characteristics of infrared spectroscopy, the main chemical components in the medicinal materials can be identified accurately, quickly and effectively, and the infrared fingerprints could be established to objectively reflect the whole chemical composition of C. buchananii. The chemical characteristics of C. buchananii materials can be fully reflected by the analysis of infrared spectra. Therefore, the established infrared fingerprints of C. buchananii can be used to describe the differences of C. buchananii medicinal materials by pattern recognition technology, and this method is feasible for the quality identification of C. buchananii. From the analysis of the main chemical components, the cluster analysis results of C. buchananii fully met the requirements of the fingerprint technology. However, due to the different climates and temperature conditions in different producing areas, the contents and structures of the chemical constituents in C. buchananii will be different to certain degrees, so the cluster results in the cluster analysis may also have certain differences, which also comprehensively reflects the diversity differentiation between the infrared spectra of samples from different producing areas, which can provide a basis for ensuring the quality consistency of C. buchananii medicinal materials. This study can also provide a scientific basis for the further development and utilization of C. buchananii.
Agricultural Biotechnology2019
References
[1] CUI YL, RAN XD, et al. Zhonghua Yaohai[M]. Harbin: Haerbin Press, 1993: 459. (in Chinese)
[2] Guangxi Institute of Chinese Medicine & Pharmaceutical Science. Guangxi medicinal plants directory (Guangxi Yaoyongzhiwu Minglu)[M]. Guangxi: Guangxi Peoples Publishing House, 1986. (in Chinese)
[3] Editorial Group of Yunnan Chinese Herbal Medicine. Yunnan Chinese herbal medicine (Yunnan Zhongcaoyao)[M]. Yunnan: Yunnan Peoples Publishing House, 2011. (in Chinese)
[4] Editorial Board of Flora of China, Chinese Academy of Sciences. Flora of China[M]. Beijing: Science Press, 1977. (in Chinese)
[5] Editorial Group of Collection of Traditional Chinese Medicine in China. Collection of traditional Chinese medicine in China[M]. Beijing: Peoples Medical Publishing House, 1976: 170. (in Chinese). (in Chinese)
[6] ZHANG GH, ZHANG RS. Chemical compositions and pharmacological activities of Asclepiadaceae plants[J]. Journal of Zhejiang Chinese Medical University, 2009, 33 (3) : 445-446.(in Chinese)
[7] LIANG CY, FENG X, ZHEN HS, et al. Infrared fingerprint of Citrus grandis peels from Guangxi[J]. Journal of Anhui Agricultural Sciences, 2012, 40(25): 12464-12465. (in Chinese)
[8] HUANG J, SHAN M, WANG YT, et al. Application and research progress of near infrared spectroscopy in drug quality control[J]. China Pharmacy, 2017, 28(33): 4744-4748. (in Chinese)
[9] WANG ZT, XU BB. Application of infrared spectroscopy in food detection[J]. Modern Food, 2017(24): 27-31. (in Chinese)
[10] ZUO Y, LIU C, FANG YM. Application of FTIR technology in botany research[J]. Journal of Anhui Agricultural Sciences, 2017, 5(23): 6-8. (in Chinese)

- 农业生物技术(英文版)的其它文章
- Observation on Cardiac Opening of the Inferior Vena Cava in Goat Fetuses
- Evaluation on Application and Spraying Effect of AirAssisted Sprayer in Apple Orchard with Dwarfing Rootstocks
- Problems in the Development of Traditional Chinese Medicinal Materials Planting Industry in Shiyan City and Countermeasures
- Study on Practical Mature Age of Individual Pinus thunbergii×P. densiflora
- Effects of Different Densityreducing Methods on Canopy Microenvironment, Tree Growth and Fruit Quality in Closed Apple Orchard
- Development of Whole Potato Flour Fish Noodles