Research and Application of Image Recognition Technology in Microscopy Diagnosis of Catalytic Cracking Catalysts
Li Lujie
(International School, Beijing University of Posts and Telecommunications, Beijing 100876)
Abstract: The image processing and recognition technology is used in the micrographic diagnosis of the FCC catalyst. By quickly analyzing the image and quickly obtaining the analysis result of the catalyst property, the accident of the FCC unit may be alerted. In this paper, the image recognition technology is used to better diagnose the catalytic cracking catalyst.
Key words: catalytic cracking; catalyst; diagnosis of microstructure; image identification
1 Introduction
The catalyst plays a crucial role in the catalytic cracking(FCC) reaction, which can largely determine the product distribution and product quality of the catalytic cracking unit. For decades, researchers and catalyst manufacturers in various countries have been actively researching and developing new catalysts. However, conventional sampling and analysis methods have been used to monitor and analyze the state of the catalyst in industrial operating plants. Laboratory analysis should be used to study the samples according to time requirements, and the state of the catalyst in the production process cannot be monitored at all times. The assay method can qualitatively obtain the macroscopic physical properties and chemical composition of the catalyst sample, but cannot reflect the true state of the specific microscopic particles of the fresh catalyst and the catalyst in operation.
In fact, many problems in the FCC unit can be reflected from some changes in the microscopic imaging surface of the catalyst, such as catalyst particle bonding, catalyst fragmentation, metal contamination, coking effect,oil contact condition, solid shape changes in slurry,etc. FCC catalyst photomicrography, which is the microscopic photography and magnifying observation of the catalyst, can be used to quickly and intuitively understand the change of the catalyst. By comparing the microscopic magnified image of the catalyst under different conditions, the accident can be found as soon as possible, as well as the reasons, problem solving in a timely manner, especially for those problems that cannot be clearly analyzed by experience. Image analysis,after an investment, no longer requires additional costs.The sampling can be carried out at any time for photo observation and analysis, which improves the efficiency of analysis.
In the past, catalyst photomicrographs required manual observation and analysis, which can effectively dig out the problems of FCC units. However, manual judgment requires experienced engineers to do so. The manual analysis of the photomicrograph of the catalyst has a strong dependence on the empirical knowledge, and puts high demands on the engineer's FCC industrial engineering knowledge and experience.
The work in this paper is to transform the empirical knowledge acquired by engineers into an information system, which is closely integrated with image processing and recognition technology, so that the computer can automatically obtain accurate and effective results of catalyst property analysis, and can automatically combine the experience of engineers. The library intelligently can generate catalyst assessment reports and incident solutions.
2 Microscopic Diagnosis of FCC Catalyst
Diagnostic analysis of catalysts has always been an important topic in the FCC industry, and many research institutions at home and abroad have been studying more efficient catalyst monitoring and analysis methods.Although the conventional analytical method can be used to quantitatively study the physical properties and chemical composition of the catalyst, since the catalyst sample is a mixed batch sample, the result obtained is macroscopically averaged. The true microscopic state of each catalyst particle in the system cannot be directly reflected. The FCC catalyst is a particle with a diameter in the range of 10 μm to 140 μm, and only a general color can be observed by the naked eye, and the surface structure, the particle shape, the fracture state of the catalyst, and the distribution of carbon on the catalyst surface cannot be deeply understood[1]. In addition, since the positions of the conventional sampling are relatively fixed, it is impossible to analyze the catalyst samples of some special parts, such as the particle size distribution of the solid matter in the slurry at the bottom of the fractionation column.
After realizing the limitations and shortcomings of the conventional sampling assay in the catalyst analysis process, Mr. Zhou Fuchang[1]developed a new FCC operation diagnostic technology in 2006 based on years of FCC industrial experience - FCC catalyst particle microscopic observation diagnostic technique. Catalyst display was established by processing, microscopically observing and photographing more than 3 000 fresh,spent and regenerated catalysts collected from various parts of more than 80 FCC units under different working conditions, as well as catalyst samples obtained from the three-stage cyclones and oil slurry. By comparing the particle size distribution, appearance shape, surface color,coke content, particle size distribution, and particle shape of the catalyst sample, the photomicrograph diagnostic analysis of the catalyst is realized, which can provide guidance for analyzing, judging, and solving the difficult problems of the FCC unit production technology. At present, it has assisted more than a dozen sets of FCC units in China to perform fault diagnosis and optimization operations, and has achieved remarkable results.However, this technology is currently only available to engineers with extensive experience with FCC units.The catalyst photomicrograph has strong dependence on the experience of the catalyst, and it has high demands for the engineering knowledge and experience relating to the FCC knowledge of the diagnostic engineer. Only experienced engineers can effectively compare the existing “The Catalyst Image Library” to achieve the correct diagnostic analysis.
3 Research on Microscopic Image Recognition Technology
With the rapid development of computer technology,it is expected to replace the naked eye with computer image recognition technology, and automatically judge the nature of the catalyst by combining with the expert knowledge base. The image in nature is an analog quantity. The catalyst image recording and transmission device already processes the image using analog signals before the computer is widely used. But the computer can only process digital quantities, not analog images.Therefore, the image should be digitized before using the computer to process the image.
Digital analysis of the catalyst image refers to monitoring and measuring the target points of interest in the image to obtain useful information. Digital image analysis usually refers to the abstraction of converting an image into another non-image, such as the distance between the object and the target object in the image, and the number or size of the target objects, including the edge detection and image segmentation, the feature extraction, and the geometric measurements and counting[2].
The basic steps of “Catalyst Particle Microscopic Observation” digital image processing and recognition include the following:
1) The dot operation of the image can effectively improve the appearance of the image through grayscale transformation, and achieve the grayscale normalization of the image to a certain extent. Grayscale operations include the image stretching, the contrast enhancement,the histogram equalization, and the histogram matching.2) The geometric transformation of the image is mainly used in the geometric normalization of the image and the image calibration. It is part of the pre-processing of the catalyst image recognition.
3) Image enhancement is a method of processing certain information enhancement or weakening of a catalyst picture. Its main purpose is to make the processed image more suitable for a particular application than the original image. As a fairly subjective field in image processing(the purpose of enhancement is to enable people to better observe and recognize images), image enhancement is the premise and basis of subsequent image processing methods.
4) With the improvement of image compression, edge and eigenvalue detection and texture analysis, wavelet transform came into being. The Fourier transform has always been the cornerstone of frequency domain image processing. It can use the sum of sine functions to represent arbitrary analysis functions, while wavelet transforms are based on finite-width base wavelets that are not only variables in frequency. And their duration is limited.
5) Image restoration is similar to image enhancement, and its purpose is to improve image quality. However, image restoration attempts to restore the original appearance using a priori knowledge of the degradation process and the degraded image, and image enhancement is to improve the image quality to accommodate visual requirement through some heuristics. Image restoration is a mathematical model based on image degradation, and the method of restoration is based on a relatively strict mathematical derivation.
6) Color image processing is actually classified from the type of images, mainly including the processing of fullcolor images, as well as the pseudo-color processing of grayscale images. Color image processing is more complicated than binary and grayscale images.
7) Morphological image processing is a new method of applying mathematical morphology to the field of image processing. It is an image processing analysis method based on the natural shape of an object. Image algebra is a mathematical tool for morphological image analysis. The basic idea is to use the structural elements with certain morphological features to measure and extract the corresponding shapes in the image to achieve the purpose of image analysis and recognition. Image morphology is often used in image operations such as boundary extraction, region filling, connected component extraction, convex hull extraction, edge extraction, and pixel extraction.
8) Image segmentation refers to the process of decomposing an image into a plurality of non-overlapping regions, and the segmentation region needs to satisfy the conditions of uniformity and connectivity at the same time. The representation and description of the target means that the target is marked with pixels that make up the target area or the boundary of the area, and the target is abstracted so that the computer can make full use of the obtained processing result.
9) Feature extraction refers to the further processing of previously obtained image regions and edges, making it a more suitable form for computer processing. In order to enable a computer to “understand” an image to have a true “visual” meaning, it should work out how to extract the useful data or information from an image to obtain a representation or description of the image or “non-image”.As regards the values, vectors, and symbols, this process is the feature extraction, and the extracted “non-image”representation or description is the feature. Using these digital or vector form features, we can teach the computer how to understand these features through training, so that the computer has the ability to recognize images. Common image features include the texture features, the shape features, the spatial relationship features, and the like.
10) Object recognition generally refers to the process of classifying, understanding and using feature vectors extracted from digital images in the previous step.This involves the knowledge of computer counting,the pattern recognition, the artificial intelligence,and the like. This step is based on the previous step of providing the final required data relating to the upper layer control algorithm or directly reporting the recognition result. In fact, target recognition has risen to the level of machine vision.
After the above processing, the original image with interference and defects may become the information required by other control algorithms, thereby achieving the ultimate goal of image recognition. The above summarizes the basic sequence of digital image processing, but not every catalyst image processing requires all steps.
The advantage of our technical solution lies in the combination of multiple image features in a statistical way, learning and detection analysis. Compared with the traditional method of using single image features, it has a series of features such as high accuracy and fast speed of recognition.
In addition, we have extensively used statistical information for identification and classification in our past research work, and the results achieved are very impressive. Based on the past project experience,the recognition accuracy is as high as 75%, and the recognition speed is very fast. It takes only 0.24 s to recognize the 1 920 × 540 resolution image.
4 Application of Microscopic Image Recognition Technology
Catalyst image recognition systems can be used to primarily identify the following catalysts through reporting the relevant indicators:1) Spent catalyst: particle uniformity, carbon content, crushing ratio, particle size distribution range; 2) Slurry: solid content, particle size distribution of solid content;3) Catalyst collected from the three-stage cyclone: fine particle size distribution,separation effect of cyclone;4) Fresh catalyst: particle size distribution;5) Regenerated catalyst: coking uniformity,carbon content, crushing ratio, particle size range, particle size distribution uniformity.
(1) Catalyst size
Catalyst particle size analysis requires techniques such as color image processing, image enhancement, wavelet transform, morphological image processing, image segmentation, feature value extraction, object recognition,and artificial intelligence. The Figures 1—3 show a detailed picture of the particle size process.
(2) Calcium and iron poisoning
Calcium and iron poisoning analysis belongs to image feature analysis (Figures 4—8). In order to enable the computer to
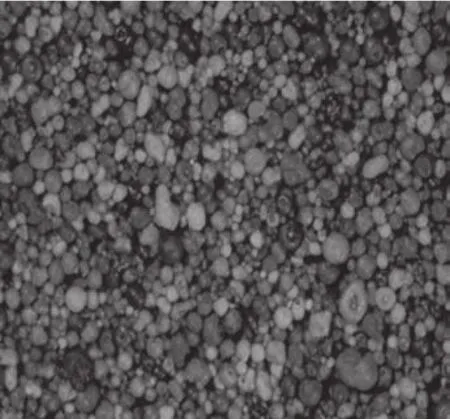
Figure 2 Image enhancement

Figure 3 Process analysis feature map
“understand” the image and thus have a true “visual”, it is necessary to extract the useful data information and obtain a representation or description of the “non-image” elements of the image. After obtaining the data characteristic value of the picture, the corresponding statistical analysis of the data is performed, and the information of calcium or iron poisoning is simulated.
(3) Carbon
Carbon determination refers to the carbon deposition amount of the catalyst and the mass percentage of the catalyst. The carbon determination is an important indicator for measuring the spent and the regenerated catalyst. The carbon in the image is mainly represented by black gray, so the dark part of the image is resolved during catalyst carbon analysis (Figures 9—11).

Figure 4 Catalyst with calcium poisoning

Figure 5 Catalyst without calcium poisoning
(4) Oil slurry solid content
The solids content in slurry is proportional to the area of the catalyst in the slurry. However, low solids and high solids slurries are not simply comparable to solids values,and they are not on the same simulation curve[3]. Therefore,in the process of processing the oil slurry image, it is necessary to process via color image processing, image enhancement, wavelet transform, image segmentation,feature value extraction and the like to ensure the accuracy of the solid content of the slurry and the number of particles in the solid content(Figures 12—14).

Figure 6 Catalyst with iron poisoning

Figure 7 Catalyst without iron poisoning
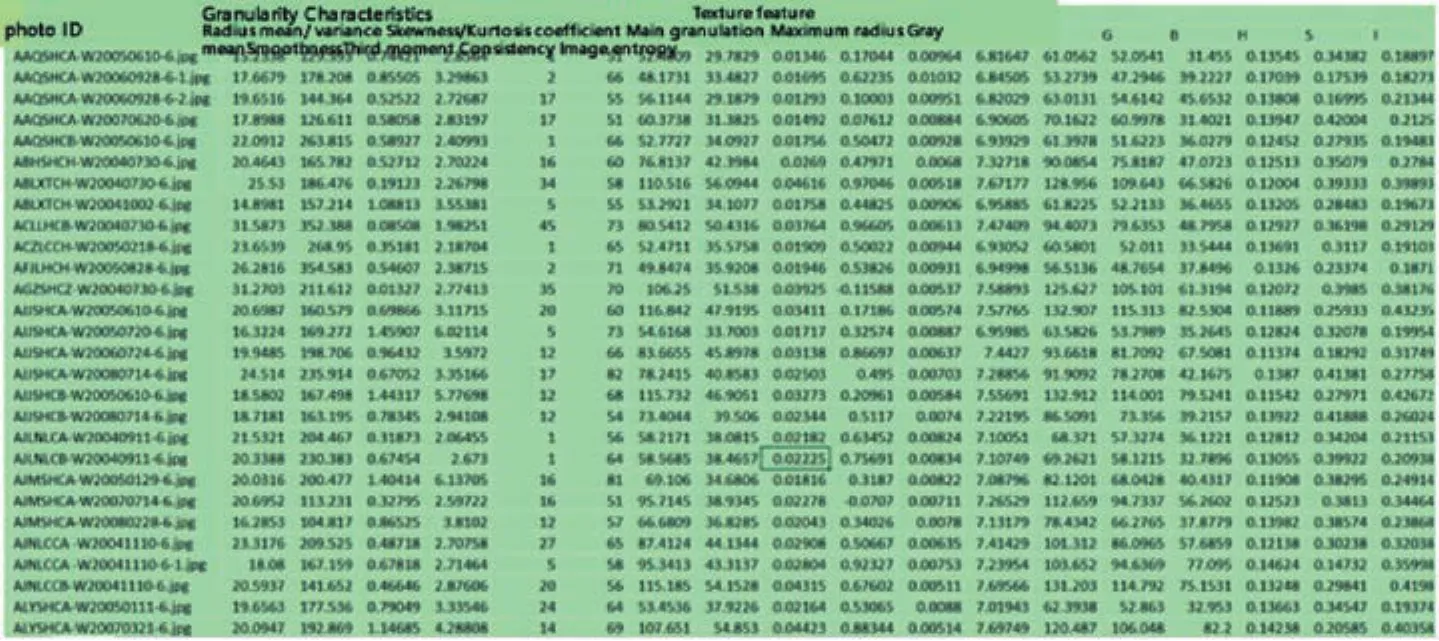
Figure 8 Characteristic data of calcium or iron poisoning
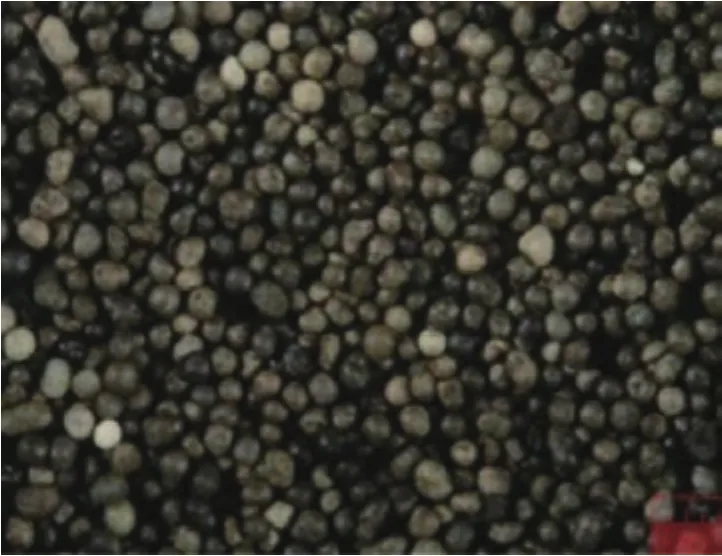
Figure 9 Original image of spent catalyst

Figure 10 Processed diagram
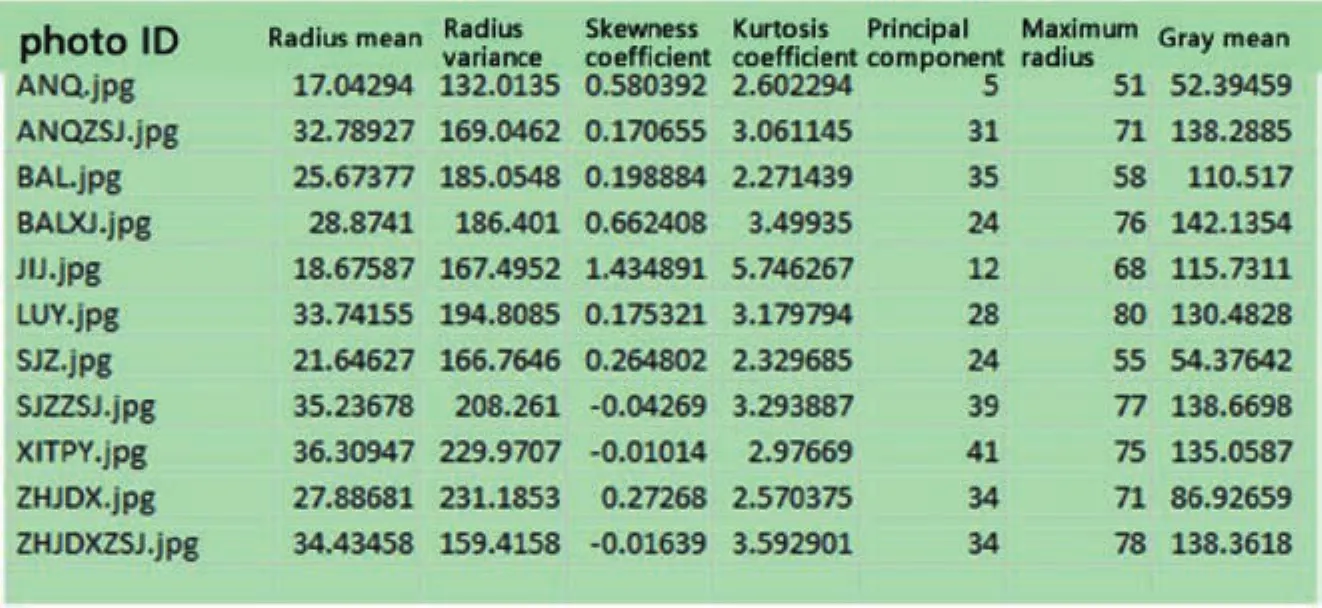
Figure 11 Characteristic data during catalyst carbon analysis

Figure 12 Slurry with high solid content
(5) Expert mind map
Using computer image processing technology, 145 original manual analysis reports were sorted out, and 572 historical pictures and corresponding conclusions were compiled. According to the different types of each catalyst, the classification was carried out, and about 3 000 pieces of expert knowledge were sorted out. By summarizing more than 3 000 pieces of knowledge points, the knowledge base is formed, and the intelligent expert mind map is extracted (Figure 15). The expert mind map is based on the computer identification of the photomicrograph of the FCC catalyst particles, combined with the historical expert diagnostic knowledge base,which can comprehensively diagnose the catalytic properties and the operating conditions of the FCC unit.

Figure 13 Normal slurry
5 Microscopic Image Diagnosis Case
(1) Freshener particle size comparison

Figure 14 Characteristic curve of solids content in slurry
Case 1:
Figure 16 and Table 1 presented below show an image and particle size analysis table for a set of fresh catalysts.Judging from Figure 16 and Table 1, it can be seen that the computer microscopic image diagnosis system analysis conclusion is close to the manual analysis conclusion; the diagnosis system analysis conclusion and the manual analysis conclusion mainly deviate from the particle size in the range of 75—112 μm; the particle size distribution of the new agent of the system is reasonable.

Figure15 Expert mind map

Figure 16 Fresh catalyst image

Table 1 Particle size analysis
Case 2:
The image and particle size analysis of catalysts recovered from the third stage of cyclone separator are shown in Figure 17 and Table 2.

Figure 17 The catalyst recovered from the third stage of cyclone separator
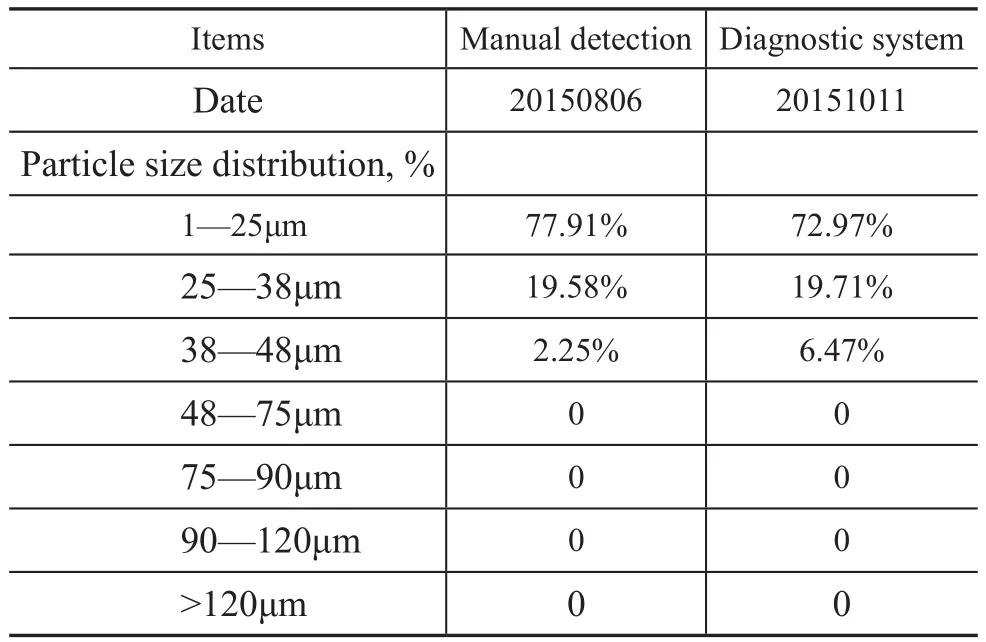
Table 2 The particle size distribution of the catalyst from the third stage of cyclone separator
Upon judging from the comparison of the above chart data, it can be seen that the analysis conclusion of the microscopic image diagnosis system of the catalyst from the third stage of cyclone is basically consistent with the conclusion of the manual analysis.
(2) Carbon[4]
The chart presented below shows the sample images of the spent catalyst 1, 2 and the carbon analysis table.

Figure 18 Spent catalyst 1

Figure 19 Spent catalyst 2

Table 3 Carbon determination results
Judging from the comparison of the above chart data, it can be seen that the conclusion of the carbon determination analysis of the diagnostic system is basically consistent with the carbon measuring result of the manual analysis.
(3) Solid content in slurry[5]
The slurry No. 1, 2, 3, 4 and the solid content analysis results are shown in Table 4.
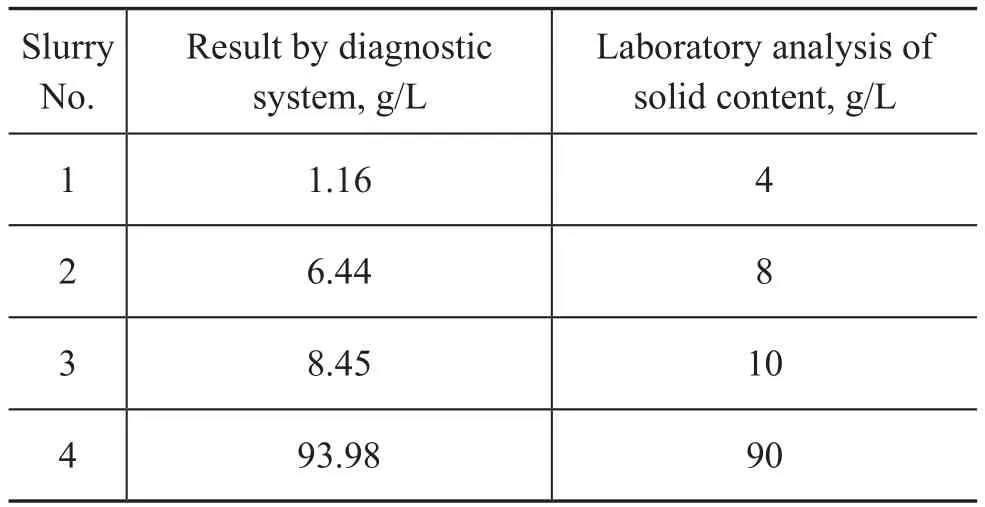
Table 4 Solid content analysis result
Judging from the comparison of the data in Table 4, it can be seen that the analysis result of the solid content in slurry by the diagnostic system is basically consistent with the analysis result obtained in the laboratory.
6 Conclusion
Based on the above application cases, the catalyst microscopic image diagnosis system can completely replace the artificial naked eye analysis and judgment,and the analysis conclusion can meet the FCC production diagnosis requirements and achieve the intelligent application effect.
- 中国炼油与石油化工的其它文章
- Optimization of Dividing Wall Column with Heat Transfer Process Across the Wall for Feed Properties Variation
- Numerical Simulation of Optimization of Mixing Tank for Residue Upgrading Reactor
- Biodegradability and Tribological Properties of Mineral Base Oil Enhanced by Caprylic Methyl Diethanolamine Phosphate Ester
- Enhanced Anti-Wear Property of Low Viscosity Engine Oil for Sequence IVB Engine Test Meeting the GF-6 Specification
- Study on Flue Gas Desulfurization Process with Selective SO2 Removal by N-formylmorpholine
- Evaluation of Inocula and Packing Material for Acceleration of Start-Up in Biofilters

