Assessment of Genetic Diversity of Drought Tolerant and Susceptible Rice Genotypes Using Microsatellite Markers
Ravindra Donde, Jitendra Kumar, Gayatri Gouda, Manoj Kumar Gupta, Mitadru Mukherjee,Sk Yasin Baksh, Pradosh Mahadani, KhirodKumar Sahoo, Lambodar Behera, Sushanta Kumar Dash
Assessment of Genetic Diversity of Drought Tolerant and Susceptible Rice Genotypes Using Microsatellite Markers
Ravindra Donde1, Jitendra Kumar1, Gayatri Gouda1, Manoj Kumar Gupta3, Mitadru Mukherjee1,Sk Yasin Baksh1, Pradosh Mahadani, KhirodKumar Sahoo2, Lambodar Behera1, Sushanta Kumar Dash1
()
The introgression of wild chromosomal segments into popular rice varieties is one of the potential approaches for developing varieties for drought stress condition. Sixteen genotypes, including nine, twoand five chromosome segments substitution lines (CSSLs) with different levels of tolerance/susceptibility to drought stress, were selected for diversity study. Sixty-three microsatellite markers were utilized for assessing genetic diversity. A total of 95 alleles were amplified,and out of them, 60 were polymorphic. Six unique alleles, amplified by the microsatellite loci RM276, RM472, RM488, RM537, RM541 and RM28089, were identified in six genotypes, namely FR13A, Brahamanakhi, RUF44, Swarna-, Brahamanakhi and Satyabhama. The highest genetic similarity was found among CSSLs. Polymorphism information content (PIC) value varied from 0 to 1.00 with an average of 0.66 per locus. Twenty-eight microsatellites were found to be polymorphic, which could be used in marker-assisted selection programme. All the sixteen genotypes were grouped into two major clusters at genetic similarity of 0.64. In the cluster I, five CSSLs identified as diverse genotypes had wild ancestor segments responsible for drought tolerance, and hence they could be utilized as potential donors. The popular Indian varieties, Swarna-and IR64-, could be used as recurrent parents in the future breeding program for developing varieties for abiotic stresses such as submergence and drought.
genetic diversity;marker-assisted selection; microsatellite marker; rice; drought stress; submergence; chromosome segment substitution line
Rice (L.) is one of the most important staple food crops for more than 3.5 billion people (Xu et al, 2016).It is thelargest consumed calorie source among the food grains representing 21% of the entire calorie supply (Khush, 2005;Tian et al, 2006; Sweeney and McCouch, 2007; Gaikwad et al, 2014).In India, rice is mostly grown in a wet season under monsoon rains and around 50% of the area is rain-fed which is frequently subjected to various stresses, including flash flood, drought and salinity, particularly in coastal regions (Khush, 2005). Drought is a major abiotic stress that limits rice productivity in rainfed and upland ecosystems (Venuprasad et al, 2012). Drought affects approximately 34 million hectare of rainfed rice and 8million hectare of upland rice area in Asia alone (Venuprasad et al, 2009b). Upon exposure to different environmental stresses, the productivity, quantity and quality of rice are severely affected (Varshney et al, 2011). Similarly, floods and submergence caused by heavy rains can occur at any stage of crop growth and affect more than 10–15 million hectare of rice in Southeast Asia in particular and Asia in general causing an annual economic loss of approximately 1 billion dollar(Septiningsih et al, 2009; Singh et al, 2010; Ismail et al, 2013). Rice production in rainfed ecosystems depends mainly on monsoon rainfall and run-off water from the catchment areas (Molden et al, 2010).
The recombination breeding plays a major role in the accumulation of minor genes for grain yield under drought stress. It is imperative to know the genetic diversity among germplasm before proceeding for any breeding programme. Highly heterotic F1s and immense variability in F2s along with promising transgressive segregants in advance generation could be obtained by crossing diverse genotypes. In the process of choosing diverse parents for complementing drought and submergence tolerance, the selection of parent is really a deciding factor for getting proper recombinants. Hence,andalong with some promising cultures were studied for assessing necessary diversity for selecting recombinants with higher grain yield under drought and submergence stress.
The earlier efforts of the breeders for assessing genetic diversity using conventional phenotypic traits were supposed to be less efficient because of its interaction with the environment. However, the molecular markers have made it possible to assess the diverse cultivars more efficiently for prospective utilization as parents. Simple sequence repeat (SSR) is one of the most useful molecular markers for assessing the genetic relationships amongst plant cultivars (Flint-Garcia et al, 2005; Gawenda et al, 2012;Choudhary et al, 2013; Gaikwad et al, 2014; Zhao et al, 2014). They are multiallelic, highly polymorphic, co-dominant and abundant in the genome. The current study aimed to find out the highly diverse genotypes useful for inclusion in hybridization programmes to develop drought-tolerant varieties along with submergence tolerance. Sixty-three SSR markers were used to assess genetic diversity among 16 genotypes including popular high-yielding Indian rice varieties and phenotypically promising drought tolerant chromosomesegments substitution lines (CSSLs). These CSSLs had been screened under rainout shelter fordrought tolerance atthe reproductive stage and were used as a donor for the introgression of wild segments into popular rice varieties (Barik et al, 2017). Hence, it is important to identify and select the ideal parents for hybridization as well as back-cross breeding programme with the assist of marker-assisted selection using polymorphic markers among the parents.
MATERIALS AND METHODS
Rice materials
Sixteen rice genotypes, including nine, twoand five CSSLs, were used in our study (Supplemental Table 1). Among them, 13 are tolerant to drought stress while the others are susceptible. The CSSLs were developed by Susan McCouch at Cornell University, USA (Arbelaez et al, 2015). They were developed by backcrossing with recurrent parent Curinga (ssp.), a commercial rice variety developed and released at Brazil in 2005 using marker-assisted selection using two different wild donor parents. The recurrent parent Curinga was a semi-early maturing and drought-tolerant cultivar. In the first set, the donor wasW2112 (https://shigen.nig.ac.jp/rice/oryzabase/Oryzabase), and in the second set, the donor wasGriff IRGC105491. These lines contained wild introgression segments fromandin Curinga background. The first and second set has been designated as(MER) and(RUF), respectively (Arbelaez et al, 2015).
Thevarieties (Azucaena and Curinga) and five CSSLs have been identified a drought tolerant through screening under rainout shelter condition (Supplemental Table 1) (Barik et al, 2017). Out of ninevarieties, two were popular high-yielding submergence tolerant rice varieties viz., Swarna-and IR64-, and could withstand flash flood situation due to the presence ofgene,butare sensitive to drought condition, while four are drought tolerant genotypes (viz. Satyabhama, Brhamnakhi, N22 and CR143-2-2) for upland and aerobic situations with appreciable grain yield. Among the rest three genotypes, FR13A is international submergence tolerance Donor, IR20 is an international drought sensitive check, and Nerical is an upland/aerobic genotype for drought tolerance suitable for Africa(Supplemental Table 1).
Genomic DNA isolation
The young leaf samples were collected from one-month-old transplanted plants of each genotype during dry season in 2017. Genomic DNA was isolated from 3–4 cm of bulked leaf samples following sodium dodecyl sulfate (SDS) method (Dellaporta, 1983). The quantity and quality were estimated applying a spectrophotometer and agarose gel electrophoresis using known concentration of lambda DNA. The samples were diluted in TE buffer (10 mmol/L Tris-HCl, 1 mmol/L EDTA, pH 8.0) to get a final concentration of 30 ng/µL for amplification.
PCR amplication and electrophoresis
The genetic diversity/similarity of the 16 genotypes were assessed by using 63 SSR markers. Out of them, twelve markers are linked to drought-tolerant QTLs (Supplemental Table 2).The primer sequences for the63 SSR markers can be found in the Gramene website (http://www.gramene.org). The amplification was carried out in a 20 µL reaction mixture volume containing 1 µL genomic DNA, 5 pmol/L of forward and reverse primer and 1× PremixVersion 2.0 (XcelGen). The PCR was performed in Eppendorf thermocycler (Eppendorf vapo.protect 96 well) as per following cycling parameters: initial denaturation at 94ºC for 4 min followed by 35 cycles of denaturation at 94ºC for 30 s, annealing at 55ºC–67ºC (depending upon primer Tm) for 1 min and extension at 72ºC for 30 s and final extension at 72ºC for 7 min. The amplified products were separated on 2.5%–3.0% agarose gels using 1× TBE buffer and stained with ethidium bromide (0.5 µg/mL). The gels were visualized under UV radiation and photographed using a gel documentation system (G Box, Syngene) to detect polymorphism. The size of amplified bands was determined based on the migration, relative to molecular weight of the markers (50 bp DNA ladder, Thermo Scientific, USA).
Data analysis
The amplified bands (alleles) were scored as present (1) or absent (0) for each genotype and primer combination. The data were entered into a binary matrix and subsequently analyzed using the software package, NTSYS-pc (Version 2.02) (Rohlf, 1988). The total number of alleles per locus, percentage of polymorphic alleles, low-frequency alleles (frequency of allele ≤ 30%), high-frequency alleles (frequency of allele > 30%), and polymorphism information content (PIC) were calculated to assess the diversity of alleles of marker locus. The genetic similarity coefficients were calculated and used to assess the genetic relationship among 16 genotypes, which were used to construct a dendrogram using unweighted pair group method using arithmetic averages (UPGMA) sequential agglomerative hierarchal nested (SHAN) cluster. Principal component analysis (PCA) was performed to highlight the resolving power of the coordination. The similarity coefficient (Rohlf, 1988; Behera et al, 2013) was calculated to measure the goodness of fit of clusters. PCA was carried out using the computer package NTSYS-pc (Version 2.02) (Rohlf, 1988).
RESULTS
Allelic diversity of microsatellite markers
A total of 95 reproducible alleles were amplified with an average of 1.5 alleles per locus. The number of alleles varied from 1 to 3 alleles/locus, and 60 alleles (63.2%) were found to be polymorphic which were amplified by 28 SSRs (Table 1).
Unique alleles
The unique alleles play important role in the identification of genotypes. These unique alleles might be a diagnostic marker and could be useful for marker-assisted selection. The present study identified a total of six unique alleles (6.3% of total alleles). These unique alleles were amplified by six SSRs, namely RM276, RM472, RM488, RM537, RM541 and RM28089 (Table 1) and were found in genotypes viz., FR13A, Brahamanakhi, Swarna-, Brahamanakhi, RUF44and Satyabhama.
Low and high-frequency alleles
A total of 77 (81.1%) high-frequency alleles with an average of 1.2 alleles per locus were observed. Similarly, 13 of low-frequency alleles (13.7%) were identified among 16 rice genotypes. Twelve SSR markers amplified at least one low-frequency allele while all the 63 SSR markers amplified at least one high-frequency allele each (Table 1).
Polymorphism information content (PIC)
The PIC value provides an estimate of discriminating power of a marker locus in a given population. PIC value varied from 0 to 0.98 with an average of 0.66. Out of 63 SSRs, 19 showed higher PIC value (> 0.60). The highest PIC values, i.e. 1.0, was observed in three markers, namely RM541, RM276 and RM28089, followed by a value ranging from 0.98 to 0.96 in markers RM279, RM530, RM22, RM28079 and RM1261 (Table 1).
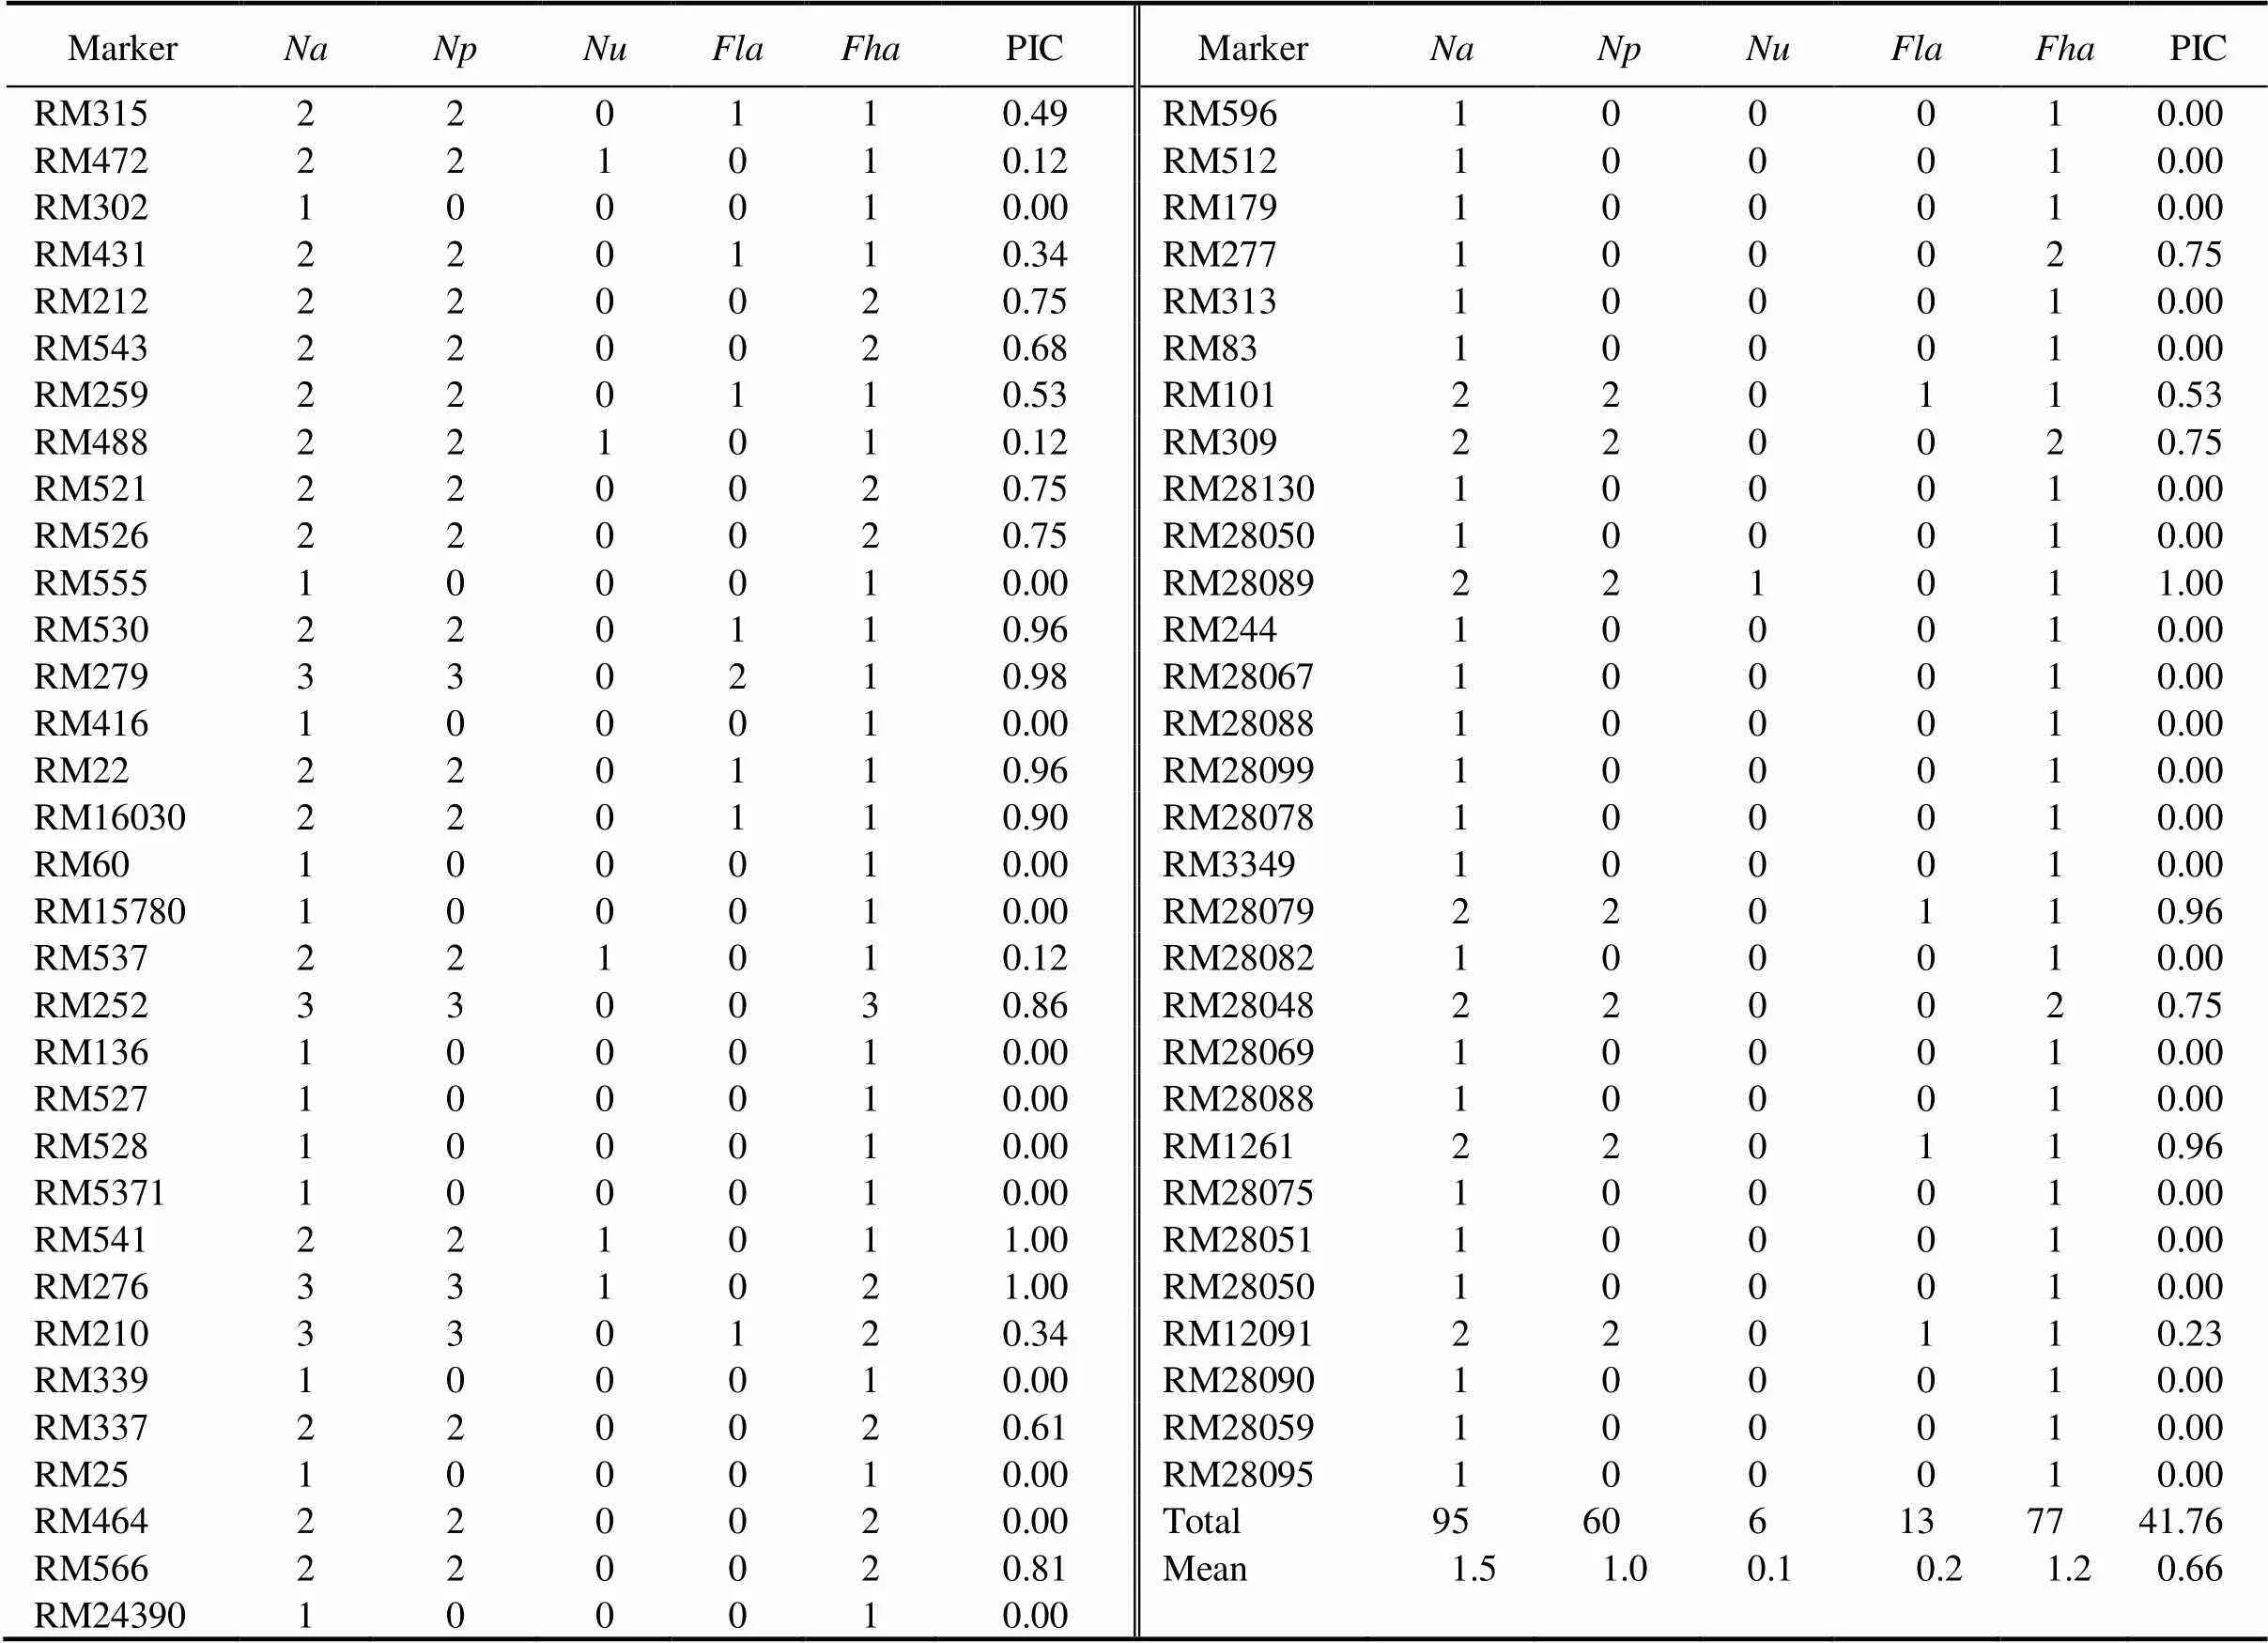
Table 1.Number of alleles (Na), number of polymorphic alleles (Np), unique allele (Nu), low-frequency allele (Fla), high-frequency allele (Fha) and polymorphism information content (PIC) for 63 simple sequence repeats (SSRs) in 16 rice genotypes.
Principal component analysis (PCA)
PCA was used to classify group and sub-group genotypes according to their similarity and genetic information contents. The present study could group 16 genotypes into three major clusters (Fig. 1). This classification would provide an indication regarding their prospective use as parents based on the genetic distance. This was more or less as per expectation because all the CSSLs have been derived from the same Curinga background with the introgression of RUF and MER. This molecular information could be used in marker-assisted backcross breeding (MABC) program to develop drought-tolerant variety. The CSSLs formed a completely different group whereasgenotypes formed another group. In PCA, the right-hand side group representsgenotypes in an orange circle while left-hand side in a blue circle represents CSSLs genotypes.
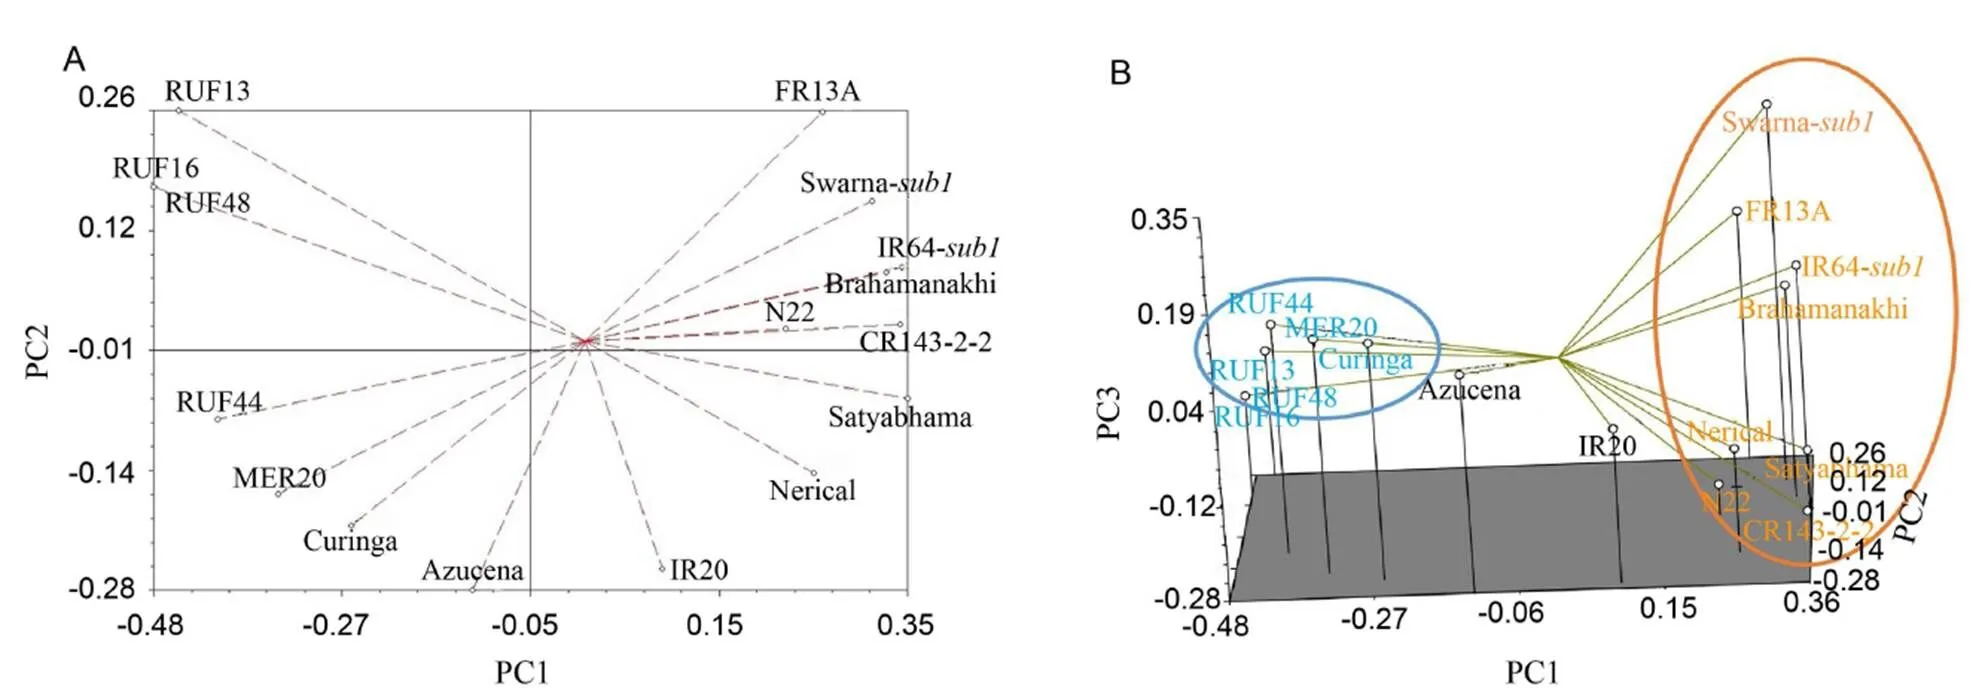
Fig. 1. Two-dimensional plot (A) and three-dimensional plot (B) from the principal component analysis (PCA) for 16 rice genotypes based on 63 simple sequence repeat markers.
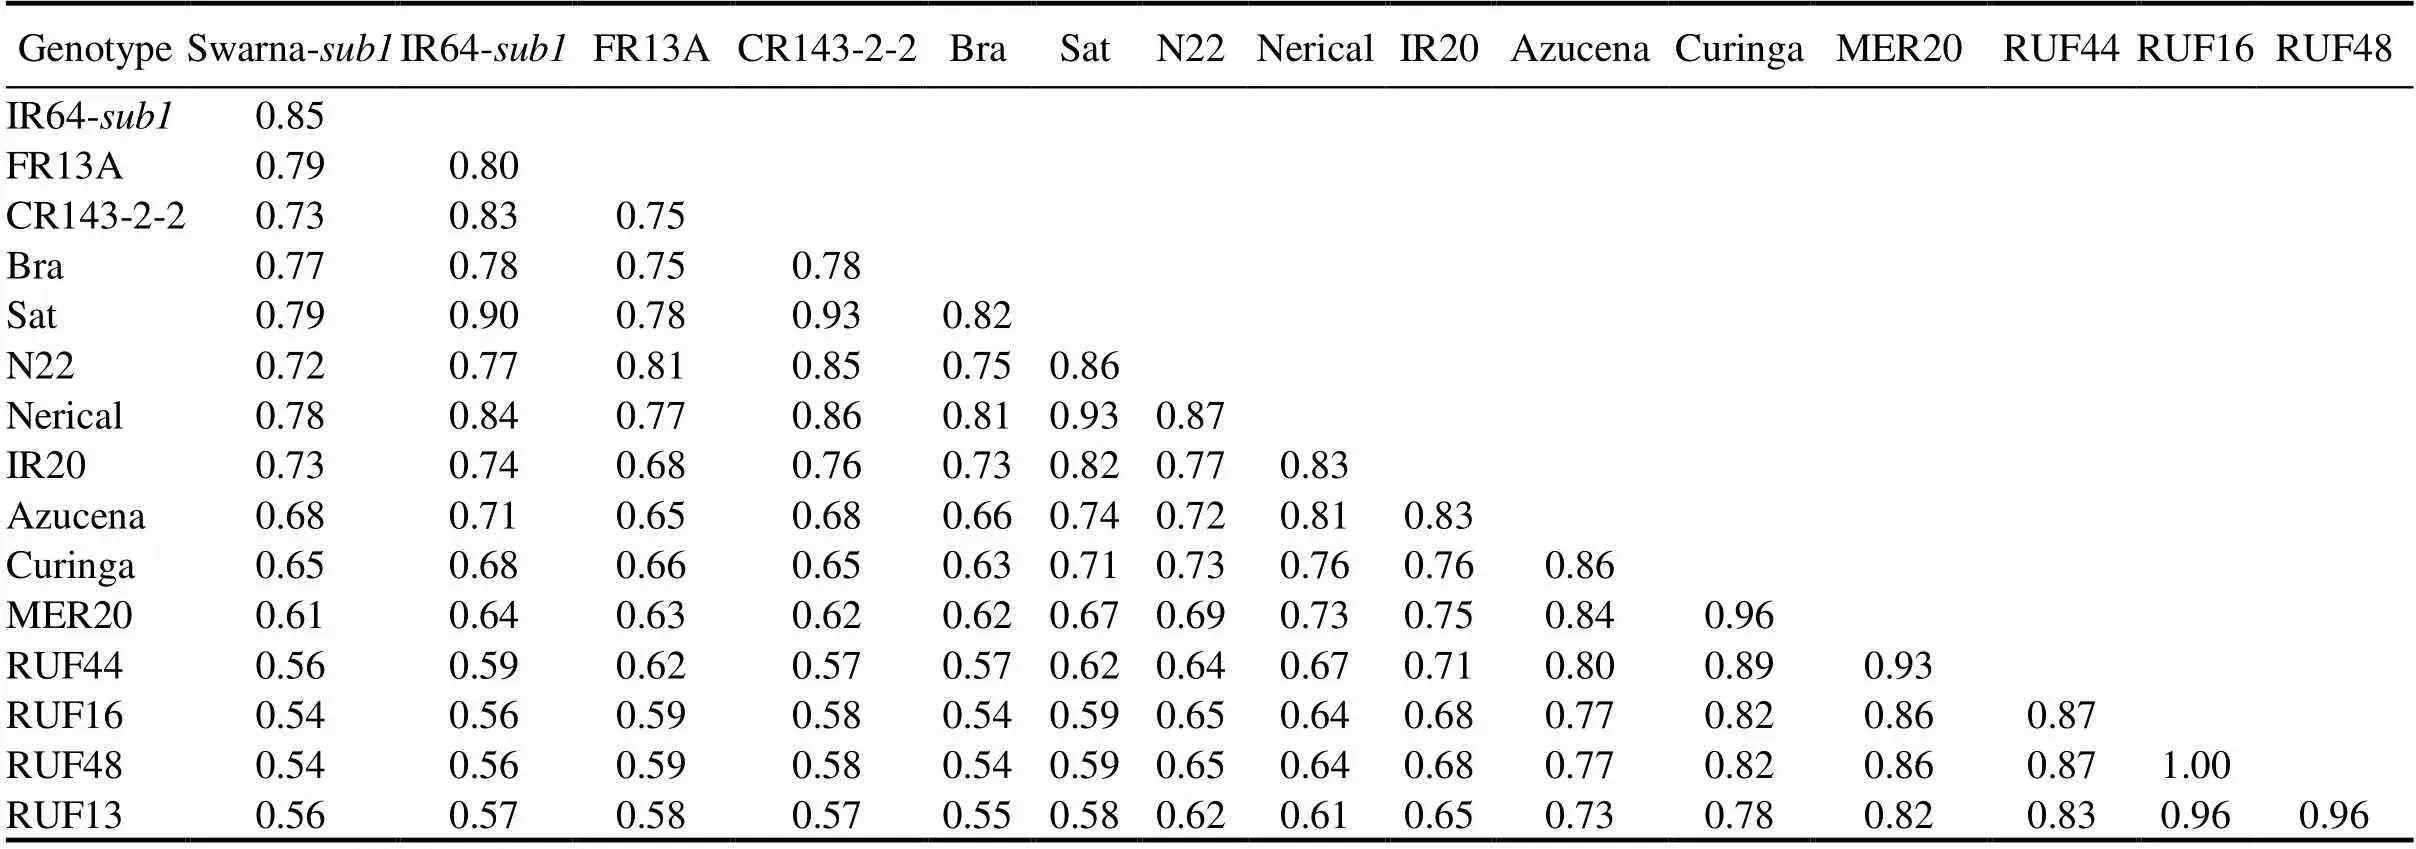
Table 2. Genetic similarity coefficient among 16 rice genotypes.
Bra, Brahamanakhi; Sat, Satyabhama.
Genetic similarity and UPGMA cluster analysis
Genetic similarity coefficients of pair-wise comparisons estimated on the basis of all the 63 SSRs ranged from 0.54 to 1.00 with an average of 0.72 (Table 2), indicating moderate level genetic diversity present in genotypes. The genotype RUF16 showed the highest genetic similarity with RUF48 (i.e.0.98), followed by Curinga with MER20 (0.96), RUF16 with RUF13 (0.96), and RUF48 with RUF13 (0.96). The least genetic similarity (0.54) was found between Brahamanakhi with RUF16 and RUF48 (Table 2). Clustering based on UPGMA provided a clear resolution of relationships among all the 16 rice genotypes. The genetic similarity coefficient between two major clusters was observed to be 0.64 (Fig. 2). Cluster I is divided into two sub-clusters:cluster I-A consisting of six genotypes (five CSSLs viz. RUF13, RUF48, RUF16, RUF44 and MER20 along with Curinga)andcluster I-B consisting of two genotypes (Azucena and IR20). The genetic similarity index varied from 0.84 to 1.00 (Table 2). The second cluster consisted of 8genotypes with an average genetic similarity of 0.76.
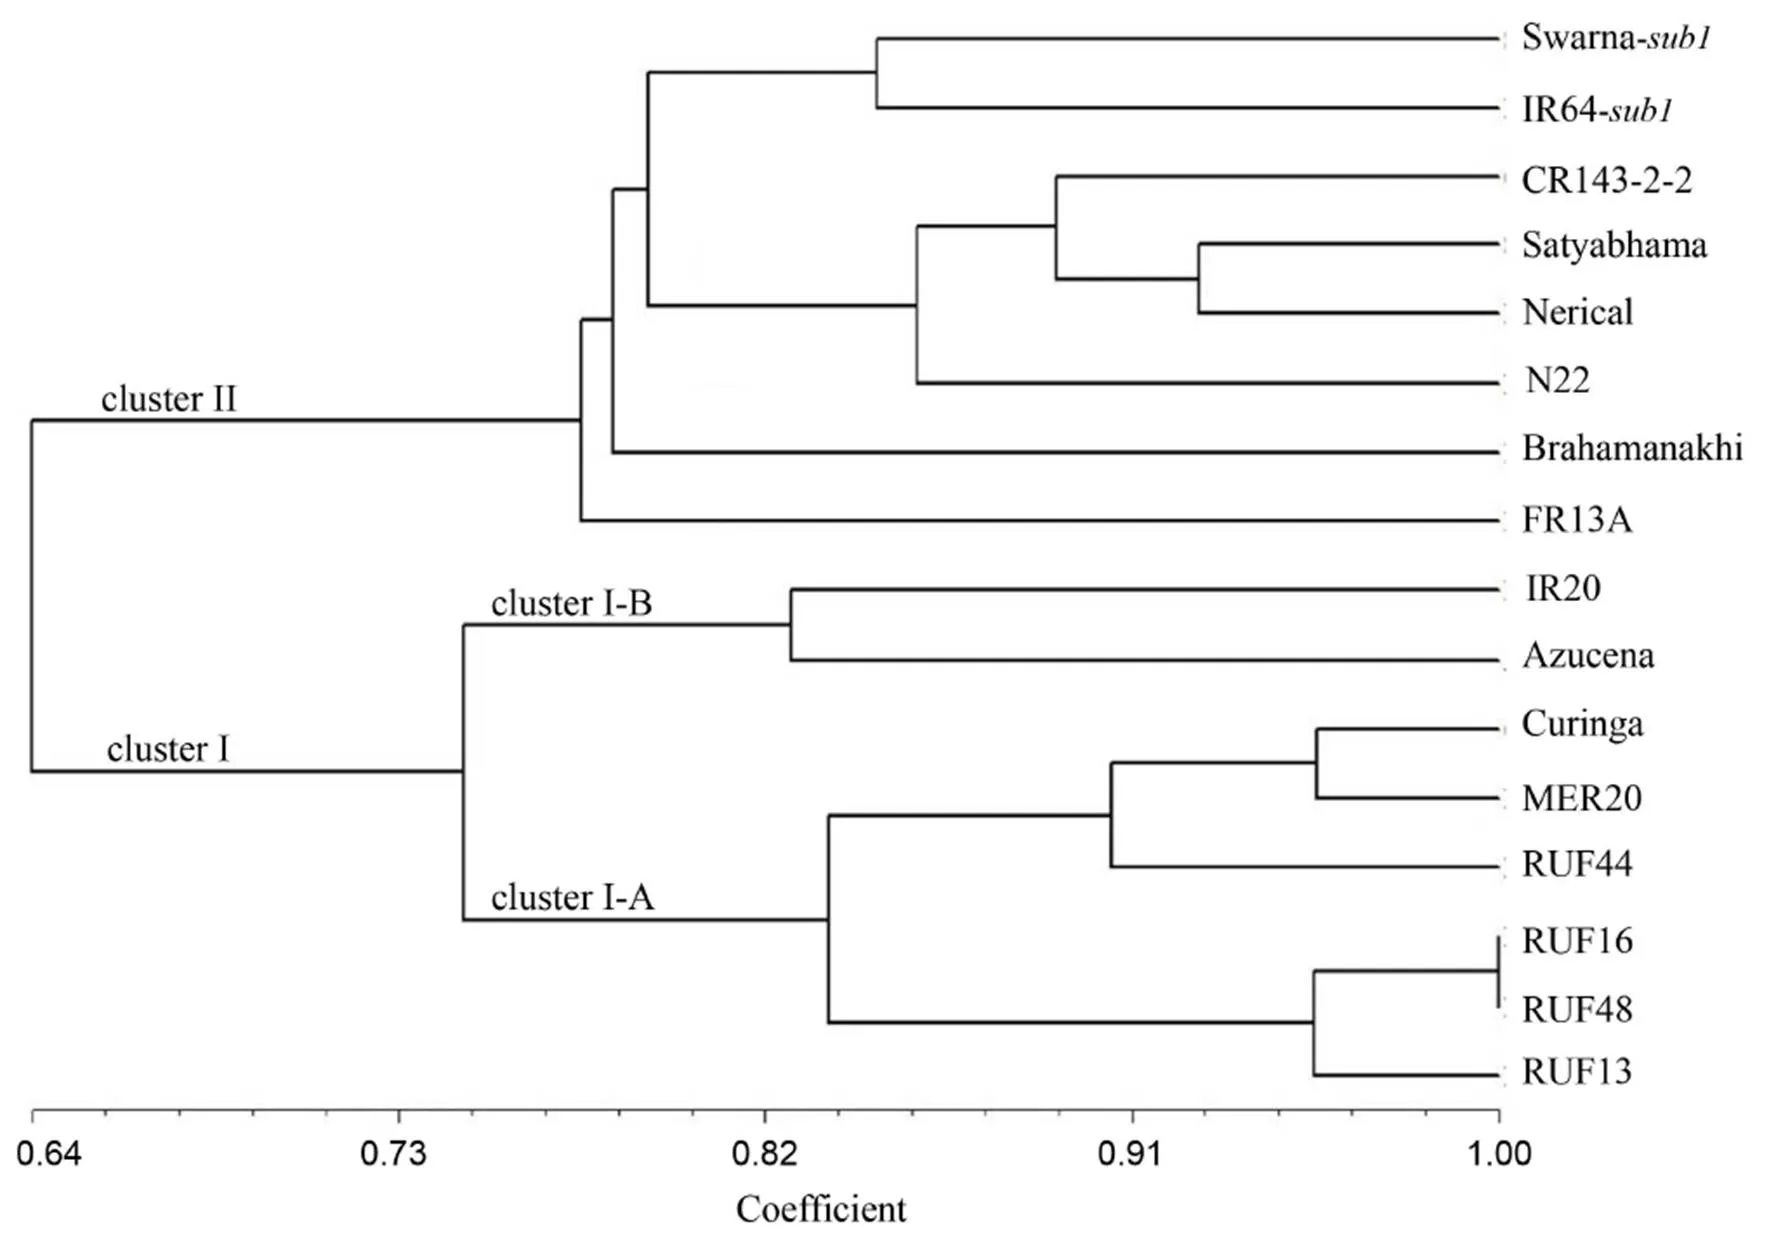
Fig. 2. Unweighted pair-group method with arithmetic means (UPGMA) dendrogram for 16 rice genotypes based on genetic similarity by 63 simple sequence repeat markers.
DISCUSSION
The assessment of genetic diversity of germplasm is one of the potential approach for variety development (Sajib et al, 2012; Nachimuthu et al, 2015). Identification of diverse parents is supposed to be the primary step for designing effective breeding strategy for hybridization and subsequent selection (Sajib et al, 2012). Genetic diversity assists in the development of genotype that is suitable and adaptable to rapid climate change through the introduction of foreign genes (Jasim Aljumaili et al, 2018). SSRs are considered to be appropriate for assessment of genetic diversity, fingerprinting for varietal identification and assessment of seed purity because of their ability to detect large numbers of discrete alleles accurately and efficiently (Charcosset and Moreau, 2004; Sajib et al, 2012; Nachimuthu et al, 2015; Ganie et al, 2016; Jasim Aljumaili et al, 2018).
This study reveals sufficient genetic diversity among 16 rice genotypes, and hence they could be differentiated from each other. Total 95 alleles were produced by 63 SSRs, out of which 60 alleles were found polymorphic. The polymorphic alleles play important roles in many research fields such as variety differentiation, diversity characterization and conservation to identify potential parents (Marathi, 2012). Out of 63 SSRs, 28 were reported as polymorphic markers. The number of alleles per locus detected in the present study is similar to earlier reports (Jasim Aljumaili et al, 2018). However, Pradhan et al (2016) observed a higher number of alleles per locus. Roy et al (2015) used 29 SSR markers to assess diversity among 7 rice genotypes, where 84 alleles were detected with an average of 2.89 alleles per locus. Similarly, Singh et al (2016) identified 63 alleles with an average of 2.75 alleles per locus.
The present study reported six unique alleles. The unique alleles were used as a diagnostic marker for specific varietal identification, and they could distinguish varieties from the rest of the genotypes (Kumbhar et al, 2015). These unique alleles might play an important role under plant stress situation so that crop can withstand drought stress as well as flash flood situation. In this context, these unique genotypes could be used as potential donors for hybridization with recurrent parents for abiotic and biotic stress tolerance in resistance breeding programme. Similar observations were reported by others (Saini et al, 2004; Behera et al, 2012; Anandan et al, 2016). Allele frequency plays important role in monitoring linkage between markers and QTL (Venuprasad et al, 2009a; Sajib et al, 2012; Sun et al, 2013). The present study reported low and high frequency alleles of 13 and 77, respectively (Table 1). Behera et al (2012) reported a high-frequency allele of 53.6% in the 69 genotypes whereas Choudhary et al (2013) reported 85% of the population shares high-frequency allele. Four loci, namely RM210, RM276, RM252 and RM279, amplified the highest number of high-frequency alleles (i.e. 3 alleles) in our study. Similarly, Singh et al (2016) reported that all the 51 primers amplify at least one high-frequency allele in 729 Indian rice varieties. Anandan et al (2016) reported high-frequency alleles with an average of 0.24 in 96 Indian rice genotypes having variation in seedling vigour.
PIC values ranged from 0 to 1.00 with an average of 0.66. Previous researchers reported similar PIC values (0.24 to 0.95) with an average of 0.81 per locus in medicinal rice (Behera et al, 2012), 0.14 to 0.75 in 192 diverse rice genotypes (Nachimuthu et al, 2015), 0.962 to 0.991 in 142 diverse rice genotypes (Ganie et al, 2016), 0.67 to 0.97 in100 high yielding rice genotypes (Choudhary et al, 2013), and 0.29 to 0.93 in seven aromatic rice varieties (Roy et al, 2016). Moreover, Patel et al (2014) reported PIC value ranging from 0.36 to 0.78, whereasShah et al (2016) reported lower PIC value 0.34 andAnandan et al (2016) reported PIC ranging from 0.04 to 0.37 with an average of 0.24,which support current findings.
In PCA, six genotypes were grouped together into cluster I (blue circle), viz. RUF13, RUF48, RUF16, RUF44, MER20 and Curinga, which were very close to each other. Eightgenotypes Swarna-, IR64-, FR13A, N22, Nerieal Satyabhama, Brhamankhi and CR143-2-2 were grouped into cluster II (orange circle). However, genotypes Azucena and IR20 placed themselves very closely because of substantial genetic similarity among them (Fig. 1). The present study clarified that CSSLs viz. MER20, RUF44, RUF16, RUF13 and RUF48 are different from populargenotypes i.e. Swarna-and IR64-, similar to genetic phylogeny shown in the dendrogram (Fig. 2). This information could be utilized in near future for designing effective breeding strategy for developing variety for yield under drought stress situation. Further, it will also assist to develop quite variable transgressive segregants utilizing those genotypes from distinct clusters. The groupings identified by PCA were comparable to those identified by UPGMA cluster analysis (Fig. 1). A similar finding was reported by Behera et al (2012) in 33 medicinal rice genotypes when accessing genetic diversity among them.
Our study indicated a moderate level of diversity among 16 rice genotypes. This diversity is supposed to play an important role in rice genetic improvement. Though some genotypes from different origin are not clustered exactly according to their phylogeny,they could be grouped in the same cluster, probably due to similar yield potential, morphology, tolerance to submergence and similarity at the genome level. Cluster I comprised all CSSLs containing introgressions fromand wild ancestors. Upadhyay et al (2011) reported a genetic similarity ranging from 0.38 to 0.82 in 29 popular Indian rice accessions. Yang et al (2014) detected two major groups based on 35 SSR markers in 416 rice genotypes, representingandsub-species.
The cluster II consisted of different fixed lines, viz. popular varieties, basically derived frombelong to three subclusters of. Similar to our observation, Upadhyay et al (2011) found that popular varieties are grouped together according to their development rather than the ecology, which may be due to differential selection pressure and selection criteria. The morphological and biochemical characters, especially isozymes, have often been utilized for classification of rice varieties by rice geneticists and breeders. Classification of rice varieties asandisbased on the morphological, serological and inter-parental hybrid fertility characters.
CONCLUSIONS
The present study clearly indicated that microsatellite markers are useful in assessing genetic diversity. The 63 SSR markers successfully classified 16 rice genotypes. A basic molecular allelic dataset was created which could distinguish drought-tolerant and drought-sensitive as well as submergence tolerant rice genotypes. The set of markers could also be utilized for studying polymorphism and assessing hybridity while crossing the genotypes, and they might assist in marker-assisted selection. The present study identified 28 polymorphic markers that could also be utilised for marker-assisted selection programme. The current genetic diversity analysis clearly differentiated genotypes into separate groups viz. CSSLs (containing chromosomal segments from wild ancestors as a source of drought tolerance) andparents (IR64-and Swarna-as lowland submergence tolerant genotypes) to be utilized as most distant parental categories. This would assist further for hybridization as well as identification of potential donors in marker-assisted selection because of their tolerance to drought and submergence. The effective breeding strategy could be formulated for designing high-yielding drought as well as submergence-tolerant varieties for rainfed areas utilizinglines as recurrent parents.
ACKNOWLEDGEMENTS
We gratefully acknowledge the financial support from Department of Biotechnology (DBT) Ministry of Science and Technology, Indian Council of Agricultural Research (ICAR) and the Director, ICAR-National Rice Research Institute, India, for providing all lab and field facilities. Special thanks to Susan R. McCouch, Rice GeneticsLabDepartment of Plant Breeding and Genetics, Cornell University, for providing CSSLs and guidance.
Supplemental DatA
The following materials are available in the online version of this article at http://www.sciencedirect.com/science/ journal/16726308; http://www.ricescience.org.
Supplemental Table 1. List of drought tolerant and susceptible rice genotypes used for the assessment of genetic diversity.
Supplemental Table 2. List of microsatellite markers associated with drought-tolerant QTLs used for assessment of genetic diversity study.
Anandan A, Anumalla M, Pradhan S K, Ali J. 2016. Population structure, diversity and trait association analysis in rice (L.) germplasm for early seedling vigor (ESV) using trait linked SSR markers.,11(3): e0152406.
Anderson J A, Churchill G A, Autrique J E, Tanksley S D, Sorrells M E. 1993. Optimizing parental selection for genetic linkage maps.,36(1): 181–186.
Arbelaez J D, Moreno L T, Singh N, Tung CW, Maron L G, Ospina Y, Martinez C P, Grenier C, Lorieux M, McCouch S. 2015. Development and GBS-genotyping of introgression lines (ILs) using two wild species of rice,and, in a common recurrent parent,cv. Curinga.,35: 81.
Barik M, Dash S K, Padhi S, Swain P. 2017. Effect of drought on morpho-physiological, yield and yield traits of chromosome segment substitution lines (CSSLs) derived from wild species of rice.,54(1): 65–72.
Behera L, Patra B C, Sahu R K, Nanda A, Sahu S C, Patnaik A, Rao G J N, Singh O N. 2012. Assessment of genetic diversity in medicinal rices using microsatellite markers.,6(9): 1369–1376.
Behera L, Mohanty S, Pradhan S, Singh S, Singh O, Sahu R,Sahu S, Dash S, Mohapatra T.2013. Assessment of genetic diversity of rainfed lowland rice genotypes using microsatellite markers.,73: 142–152.
Charcosset A, Moreau L. 2004. Use of molecular markers for the development of new cultivars and the evaluation of genetic diversity.,137(1): 81–94.
Choudhary G, Ranjitkumar N, Surapaneni M, Deborah D A, Vipparla A, Anuradha G, Siddiq E A, Vemireddy L R. 2013. Molecular genetic diversity of major Indian rice cultivars over decadal periods.,8(6): e66197.
Dellaporta S L, Wood J, Hicks J B. 1983. A plant DNA minipreparation: Version II., 1: 19–21.
Flint-Garcia S A, Thuillet AC, Yu J, Pressoir G, Romero S M, Mitchell S E, Doebley J, Kresovich S, Goodman M M, Buckler E S. 2005. Maize association population: A high-resolution platform for quantitative trait locus dissection.,44: 1054–1064.
Gaikwad K B, Singh N, Bhatia D, Kaur R, Bains N S, Bharaj T S, Singh K. 2014. Yield-enhancing heterotic QTL transferred from wild species to cultivated riceL.,9(6): e96939.
Ganie S A, Borgohain M J, Kritika K, Talukdar A, Pani D R, Mondal T K. 2016. Assessment of genetic diversity ofQTL among the rice (L.) genotypes.,22(1): 107–114.
Gawenda I, Schrӧder-Lorenz A, Debener T. 2012. Markers for ornamental traits inorchids: Population structure, linkage disequilibrium and association mapping.,30(1): 305–316.
Ismail A M, Singh U S, Singh S, Dar M H, Mackill D J. 2013. The contribution of submergence-tolerant () rice varieties to food security in flood-prone rainfed lowland areas in Asia.,152: 83–93.
Jasim Aljumaili S, Rafii M Y, Latif M, Sakimin S Z, Arolu I W, Miah G. 2018. Genetic diversity of aromatic rice germplasm revealed by SSR markers.,2018: 1–11.
Khush G S. 2005. What it will take to feed 5.0 billion rice consumers in 2030.,59: 1–6.
Kumbhar S D, Kulwal P L, Patil J V, Sarawate C D, Gaikwad A P, Jadhav A S. 2015. Genetic diversity and population structure in landraces and improved rice varieties from India.,22(3): 99–107.
Marathi B, Guleria S, Mohapatra T, Parsad R, Mariappan N, Kurungara V K, Atwal S S, Prabhu K V, Singh N K, Singh A K. 2012. QTL analysis of novel genomic regions associated with yield and yield related traits in new plant type based recombinant inbred lines of rice (L.)., 12: 137.
Molden D, Oweis T, Steduto P, Bindraban P, Hanjra M A, Kijne J. 2010. Improving agricultural water productivity: Between optimism and caution.,97(4): 528–535.
Nachimuthu V V, Muthurajan R, Duraialaguraja S, Sivakami R, Pandian B A, Ponniah G, Gunasekaran K, Swaminathan M, Suji K K, Sabariappan R. 2015. Analysis of population structure and genetic diversity in rice germplasm using SSR markers: An initiative towards association mapping of agronomic traits in,8: 30.
Patel S, Ravikiran R, Chakraborty S, Macwana S, Sasidharan N, Trivadi R, Aher B. 2014. Genetic diversity analysis of colored and white rice genotypes using microsatellite (SSR) and insertion-deletion (INDEL) markers.,26(6):497–507.
Pradhan S K, Barik S R, Sahoo A, Mohapatra S, Nayak D K, Mahender A, Meher J, Anandan A, Pandit E. 2016. Population structure, genetic diversity and molecular marker-trait association analysis for high temperature stress tolerance in rice., 11: e0160027.
Rohlf F J. 1988. NTSYS-pc: Numerical Taxonomy and Multivariate Analysis System. Exeter Publishing.
Roy P S, Rao G J N, Jena S, Samal R, Patnaik A, Patnaik S S C, Jambhulkar N N, Sharma S, Mohapatra T. 2016. Nuclear and chloroplast DNA variation provides insights into population structure and multiple origin of native aromatic rices of Odisha, India.,11(9): e0162268.
Roy S, Banerjee A, Mawkhlieng B, Misra1 A K, Pattanayak A, Harish G D, Singh S K, Ngachan S V, Bansal K C, 2015. Genetic diversity and population structure in aromatic and quality rice (L.) landraces from North-Eastern India.,10:e0129607.
Saini N, Jain N, Jain S, Jain R K. 2004. Assessment of genetic diversity within and among Basmati and non-Basmati rice varieties using AFLP, ISSR and SSR markers.,140(3): 133–146.
Sajib A M, Hossain M, Mosnaz A, Hossain H, Islam M, Ali M, Prodhan S H. 2012. SSR marker-based molecular characterization and genetic diversity analysis of aromatic landreces of rice (L.)., 1: 107–116.
Septiningsih E M, Pamplona A M, Sanchez D L, NeerajaC N, Vergara G V, Heuer S, Ismail A M, Mackill D J. 2009. Development of submergence-tolerant rice cultivars: Thelocus and beyond.,103(2): 151–160.
Shah S M, Arif M, Aslam K, Shabir G, Thomson M J. 2016. Genetic diversity analysis of Pakistan rice () germplasm using multiplexed single nucleotide polymorphism markers.,63(7): 1113–1126.
Singh N, Dang T T M, Vergara G V, Pandey D M, Sanchez D, Neeraja C N, Septiningsih E M, Mendioro M, Tecson-Mendoza E M, Ismail A M, Mackill D J. 2010. Molecular marker survey and expression analyses of the rice submergence-tolerance gene.,121(8): 1441–1453.
Singh N, Choudhury D R, Tiwari G, Singh A K, Kumar S, Srinivasan K, Tyagi R K, Sharma A D, Singh N K, Singh R. 2016. Genetic diversity trend in Indian rice varieties: An analysis using SSR markers.,17: 127.
Sun J, Qian Q, Ma DR, Xu ZJ, Liu D, Du HB, Chen WF. 2013. Introgression and selection shaping the genome and adaptive loci of weedy rice in northern China.,197(1): 290–299.
Sweeney M, McCouch S. 2007. The complex history of the domestication of rice.,100(5): 951–957.
Tian F, Li D J, Fu Q, Zhu Z F, Fu Y C, Wang X K, Sun C Q. 2006. Construction of introgression lines carrying wild rice (.) segments in cultivated rice (L.) background and characterization of introgressed segments associated with yield-related traits.,112(3): 570–580.
Upadhyay P, Singh V K, Neeraja C. 2011. Identification of genotype specific alleles and molecular diversity assessment of popular rice (L.) varieties of India.,5(2): 130–140.
Varshney R K, Bansal K C, Aggarwal P K, Datta S K, Craufurd P Q. 2011. Agricultural biotechnology for crop improvement in a variable climate: Hope or hype?,16(7): 363–371.
Venuprasad R, Bool M, Dalid C O, Bernier J, Kumar A, Atlin G N. 2009a. Genetic loci responding to two cycles of divergent selection for grain yield under drought stress in a rice breeding population.,167(2): 261–269.
Venuprasad R, Dalid C O, Del Valle M, Zhao D, Espiritu M, Sta Cruz M T, Amante M, Kumar A, Atlin G N. 2009b. Identification and characterization of large-effect quantitative trait loci for grain yield under lowland drought stress in rice using bulk-segregant analysis.,120(1): 177–190.
Venuprasad R, Bool M E, Quiatchon L, Sta Cruz M T, Amante M, Atlin G. 2012. A large-effect QTL for rice grain yield under upland drought stress on chromosome 1.,30(1): 535–547.
Xu Q, Yuan X P, Wang S, Feng Y, Yu H Y, Wang Y P, Yang Y L, Wei X H, Li X M. 2016. The genetic diversity and structure ofrice in China as detected by single nucleotide polymorphism analysis.,17: 53.
Yang F, Chen Y L, Tong C, Huang Y, Xu F F, Li K H, Corke H, Sun M, Bao J S. 2014. Association mapping of starch physicochemical properties with starch synthesis-related gene markers in nonwaxy rice (L.).,34(4): 1747–1763.
Zhao Y L, Wang H M, Chen W, Li Y H. 2014. Genetic structure, linkage disequilibrium and association mapping of Verticillium wilt resistance in elite cotton (L.) germplasm population.,9(1): e86308.
14 November 2018;
14 January 2019
Sushanta KumarDash (skdash139@gmail.com)
Copyright © 2019, China National Rice Research Institute. Hosting by Elsevier B V
This is an open access article under the CC BY-NC-ND license (http://creativecommons.org/licenses/by-nc-nd/4.0/)
Peer review under responsibility of China National Rice Research Institute
http://dx.doi.org/10.1016/j.rsci.2019.01.004
(Managing Editor: Fang Hongmin)
- Rice Science的其它文章
- Ustilaginoidea virens: A Fungus Infects Rice Flower and Threats World Rice Production
- Photocatalytic Treatment of Waste Water from Rice Husk Alkaline Hydrolysate
- Physiological Responses of Contrasting Rice Genotypes to Salt Stress at Reproductive Stage
- Fine-Mapping of qTGW1.2a, a Quantitative Trait Locus for 1000-Grain Weight in Rice
- Screening for Spikelet Fertility and Validation of Heat Tolerance in a Large Rice Mutant Population
- Comparison of Five Endogenous Reference Genes for Specific PCR Detection and Quantification of Rice

