Hybrid Deep VGG-NET Convolutional Classifier for Video Smoke Detection
Princy Matlani and Manish Shrivastava
Abstract: Real-time wild smoke detection utilizing machine based identification method is not produced proper accuracy,and it is not suitable for accurate prediction.However,various video smoke detection approaches involve minimum lighting,and it is required for the cameras to identify the existence of smoke particles in a scene.To overcome such challenges,our proposed work introduces a novel concept like deep VGG-Net Convolutional Neural Network(CNN)for the classification of smoke particles.This Deep Feature Synthesis algorithm automatically generated the characteristics for relational datasets.Also hybrid ABC optimization rectifies the problem related to the slow convergence since complexity is reduced.The proposed real-time algorithm uses some pre-processing for the image enhancement and next to the image enhancement processing;foreground and background regions are separated with Otsu thresholding.Here,to regulate the linear combination of foreground and background components alpha channel is applied to the image components.Here,Farneback optical flow evaluation technique diminishes the false finding rate and finally smoke particles are classified with the VGG-Net CNN classifier.In the end,the investigational outcome shows better statistical stability and performance regarding classification accuracy.The algorithm has better smoke detection performance among various video scenes.
Keywords: Smoke detection,foreground extraction,optical flow estimation,classification,filtering,thresholding.
1 Introduction
Fire is suddenly happening and strongly affect an extensive range and ambitious to dispose.Smoke detection in pattern recognition and communication vision communities is a difficult task[Calderara,Piccinini,Cucchiara et al.(2008)].Smoke has rich characteristics like texture and shape irregularity,flicker,fluttering,frequency,color etc.Initially,the video oriented fire smoke detection algorithm is commonly on the basis of one or more features of smoke,and make the decision directly or by classifiers[Li and Labati(2013)].In some situation,it causes the fire,and it is a serious problem,like property damage[Vicente and Guillemant(2002)].
There are certain belongings of accidents in recent time:the Mont Blanc tunnel fire,a missile propellant explosion,in which an enormous amount of losses is occurred[Asakuma,Kuze,Takeuchi et al.(2002)].Consequently,we attempt towards reducing such destruction through increasing a method that notices flame as early as conceivable[Gubbi,Marusic,Palaniswami et al.(2009)].
To avoid such serious issues,some traditional particle-sampling based detectors are used which is on the basis of the scene illumination,changeability in the smoke density,diverse background,and false alarm rate[Ho and Chen(2012)].To model a smoke detection in image processing is a difficult task.In execution point of view,to model a smoke detection process depend upon feature extraction,segmentation,edge smoothening and finally edge-blurring areas out from video[Jia,Yuan,Wang et al.(2016)].The scheme to obtain these features is temporal wavelet,transformation,spatial wavelet transformation and background subtraction.
Using space borne data,detection of smoke is a trivial task,and it is not convenient for such detection in the satellite measurements.Still,it produces some challenges regarding overlap in the detection process[Ko,Park,Nam et al.(2013)].In focus with other researchers,it leads somewhat ad hoc attitudes for the discovery.Frequently,the technique is used for the detection is different channel combinations and it is easy to detach the smoke images from the normal images[Luo,Yan,Wu et al.(2015)].
In the case of smoke detection,based on climate it is classified into twofold:(i.e.,warming due to greenhouse gases and cooling due to smoke elements[Tian,Li,Wang et al.(2014)].The cooling effect is because of the absorption of solar radiation of smoke in the surface,and this leads to the warming effect in the atmosphere.Thus the scattering effect of the smoke's magnitude creates some cooling at the atmosphere-surface system[Calderara,Piccinini,Cucchiara et al.(2011)].This system has some actual world applications like alert and fire detection(manufacturing plants,schools,hospitals and so on).It is also suitable for such industries as Hazard alert for oil and gas and smoke detection for forest fires[Long,Zhao,Han et al.(2010)].
The primary challenge for the industry is to provide accurately,and early detection scheme before any problem happens[Tung and Kim(2011)].Early detection makes the system with maximum time consumption for taking any actions related to preventing fire accident in such environment[Verstockt,Poppe and Hoecke(2012)].This has reduced the danger of sensing,business continuity and less obvious through the traditional detection methods like Bayesian model,artificial neural networks(NN),Computational Intelligence Techniques,texture analysis,Lucas-Kanade optical flow algorithm,Wavelet-Based Smoke Detection,support vector machines and Saliency-Based Method and so on[Yu,Mei and Zhang(2013)].
These systems may produce some less obvious and benefits. Rapid,accurate estimation of possible fire locations confirms alarms upstream facilities[Yuan(2008)].False or nuisance alarms through an automatic alarm scheme are extensive,in certain belongings up to 90%,and are expensive to the public.They can likewise expensive toward trades,through many metropolises levying fines against corporations broadcasting false alarms[Yuan(2011)].Most prominently,though,false alarms means that valued alternative service properties are organized unnecessarily.In concise,enlightening fire discovery is good and right for communal business responsibility[Yuan(2012)].
The major contribution of our work is to improve a novel classification model for video smoke detection.The major objective is to provide better statistical stability and performance regarding classification accuracy.Improve the Deep Feature Synthesis algorithm for automatically creating characteristics for relational datasets.
1.1 Contribution of the work is given below
In addition to using different algorithms,we use deep VGG net CNN network and it acquires significant features on its own.Extracting appropriate features leads key for appropriate analysis and classification which is why the proposed work of smoke detection is preferably suitable for deep learning. Thus,our work is to employ state-ofthe-art to distinguish among images which contain smoke and images that do not and build an accurate smoke detection system.In which Farneback optical flow evaluation technique diminishes the false finding rate and finally smoke particles are classified with the VGG-Net CNN classifier.Thus the Deep Feature Synthesis algorithm automatically generated the characteristics for relational datasets.
In this approach generalized VGG net CNN learning framework was proposed.This approach was implemented on any semi-qualified network to yield low structural design for parameter space by organizing the network constants.These network constants were collected based on the framework space orthogonal decomposition and the parameters that obtained should be update at the training process to remove over-fitting.
The remainder of this manuscript is organized as follows.Section 2 gives the review works related to the smoke detector.Section 3,describes the proposed methodology for improving the precision of the smoke detection process.The experimental setup of our evaluation is presented,and strategies for combining relevant criteria are discussed;finally,the obtained results are discussed in Section 4.Conclusions of our paper are addressed in Section 5.
2 Related work
A smoke detection system was presented by Yuan et al.[Yuan,Shi,Xia et al.(2017)]which was the integration of the characteristics of Local Binary Pattern(LBP),Kernel Principal Component Analysis(KPCA)and Gaussian Process Regression(GPR).In this finding method,there were three steps involved such as feature extraction,reduction of dimensionality and classification.The GPR was to model the categorization as a Gaussian Process via the compelling Gaussian priors accompanied by the measurements and hyper-parameters.
A higher order linear dynamical schemes(h-LDS)descriptor was presented by Dimitropoulos et al.[Dimitropoulos,Barmpoutis and Grammalidis(2017)].They suggested a particle swarms optimization method was performing in the combination of both the spatiotemporal modelling and the dynamic texture analysis.The proficiencies of the h-LDS for estimating the data of the dynamic texture feature and it was implemented over a multivariate organization against the average LDS descriptor.
A Surface let transform and hidden Markov tree(HTM)model was presented by Ye et al.[Ye,Zhao,Wang et al.(2015)]that was the video oriented smoke detection system.For the decomposition stage,the pyramid pattern was utilized and for the efficient noise elimination,the 3D directional filter banks were utilized.The incorporation of the scale continuity model and the Gaussian combination model was connected with the feature extraction from the surface let transform.At last,in the identification method,the Support vector machine(SVM)classifier was utilized and this structure attained higher precision for the identification.
For the image smoke identification,the AdaBoost with staircase searching method was outlined by Yuan et al.[Yuan,Fang,Wu et al.(2015).In the beginning,an effective arithmetical feature and the Haar like features were obtained from the saturation constituents of RGB images and the dual threshold AdaBoost algorithm was applied to the feature obtained images to categorize the smoke.The categorization constancy was defended with the staircase searching method and the dynamic investigation was presented for the discovered smoke presence.
A method for the feature extraction on the smoke existing images was presented by Yuan et al.[Yuan,Shi,Xia et al.(2016)].A pixel oriented high order directional derivative encrypting was outlined and in the beginning,the High-order Local Ternary Patterns(HLTP)were created and connected via the ternary values which were on the basis of the directional derivatives quantization.At this point,the noise elimination was considered with the centre pixels that called as HLTP on the basis of the Magnitudes of noise eliminated derivatives and the values of Centre pixels(HLTPMC).In the end,for the categorization method,the SVM classifier was utilized.
For the video processing,the pre-processing steps are removed from the above given literature.While finding the smoke in the database,the pre-processing steps will be diminished the execution of precision and false alarm rate.The deep learning algorithm proficiently obtained the features from the dataset and categorize whether it is smoke or not.The notations are presented in the following Tab.1.
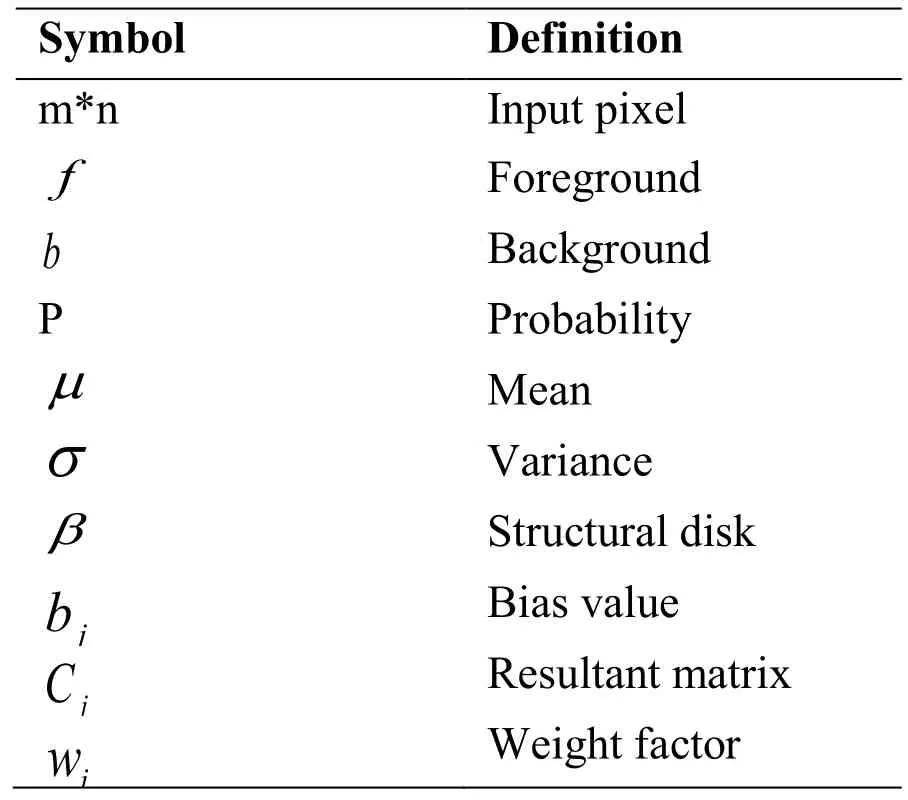
Table 1:Notations
3 Proposed work
In this paper,a deep VGG-net CNN classifier has proposed for automatic detection of video smoke.This proposed methodology has detected the smoke region efficiently with a novel classifier.The major objective related is to provide better statistical stability and performance regarding classification accuracy.
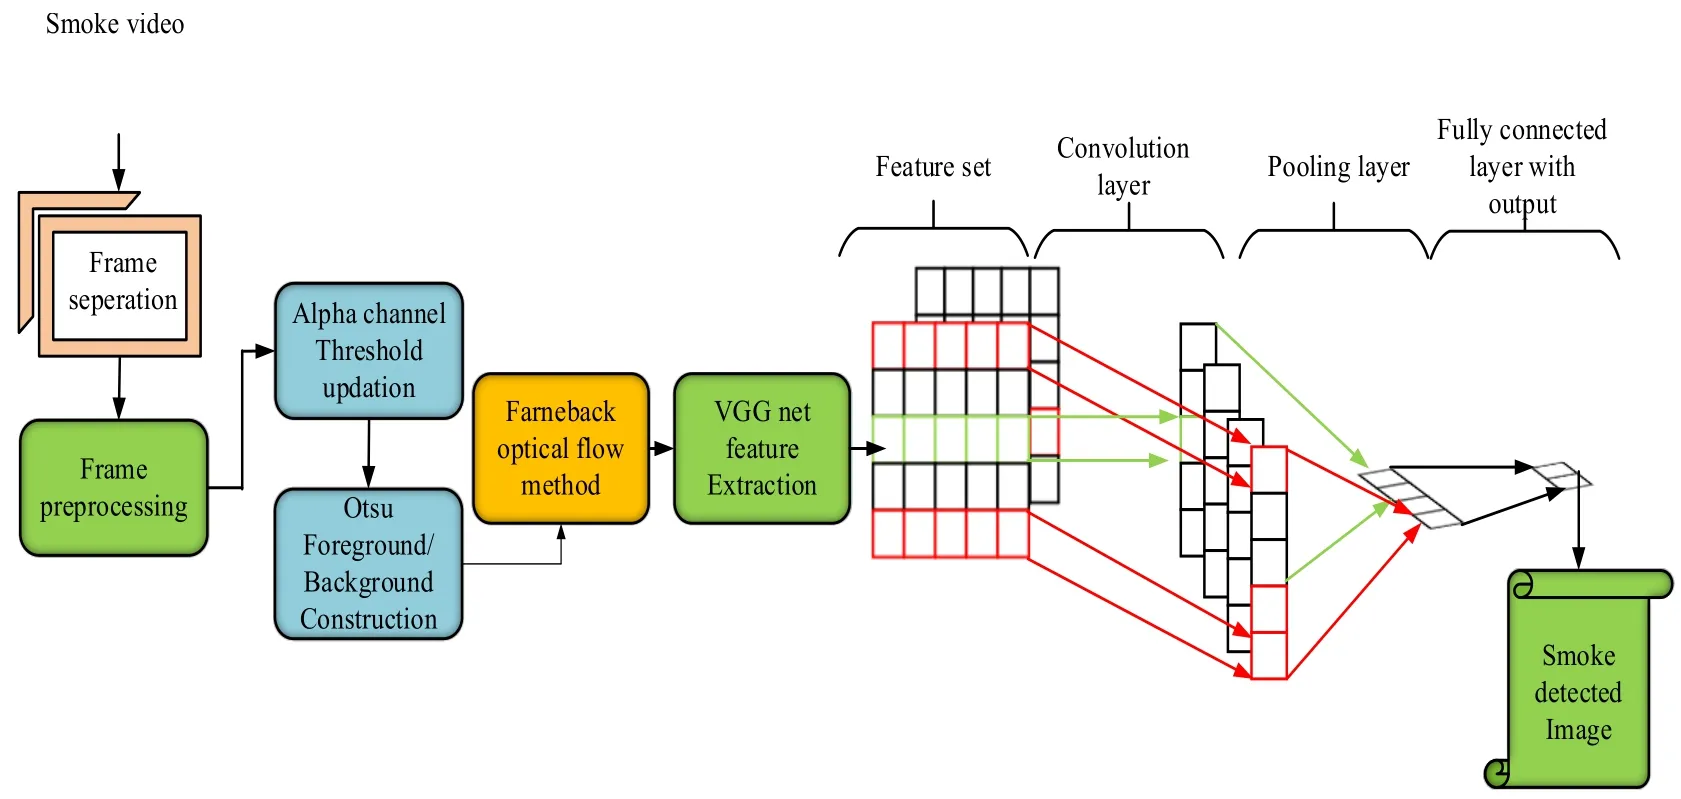
Figure 1:Schematic representation of the proposed method
Fig.1 shows the proposed schematic representation.First,the input frames are getting pre-processed.Subsequently,perform background and threshold update,foreground construction,morphological operation,contour analysis and chaotic motion estimation for the current frames.Then,Deep features are extricated automatically utilizing a VGGNet feature extraction technique.The proposed classifier has detected a smoked region using images processed to detect video smoke automatically.
In Algorithm 1 we give the pseudo code description of the proposed model.The convolutional neural networks often need more data for training because of a huge amount of parameters expected to tune these systems appropriately.Particularly,the last fully attached layers are exceptionally inclined to over fitting because of the vast number of parameters.Model fine-tuning is performed for 10 epochs.The training deep convolutional neural networks are required to resolve a huge amount of parameters,so the training needs an adequate number of data set.The shortage of the training set may prompt insufficient learning of the system and slow of convergence.
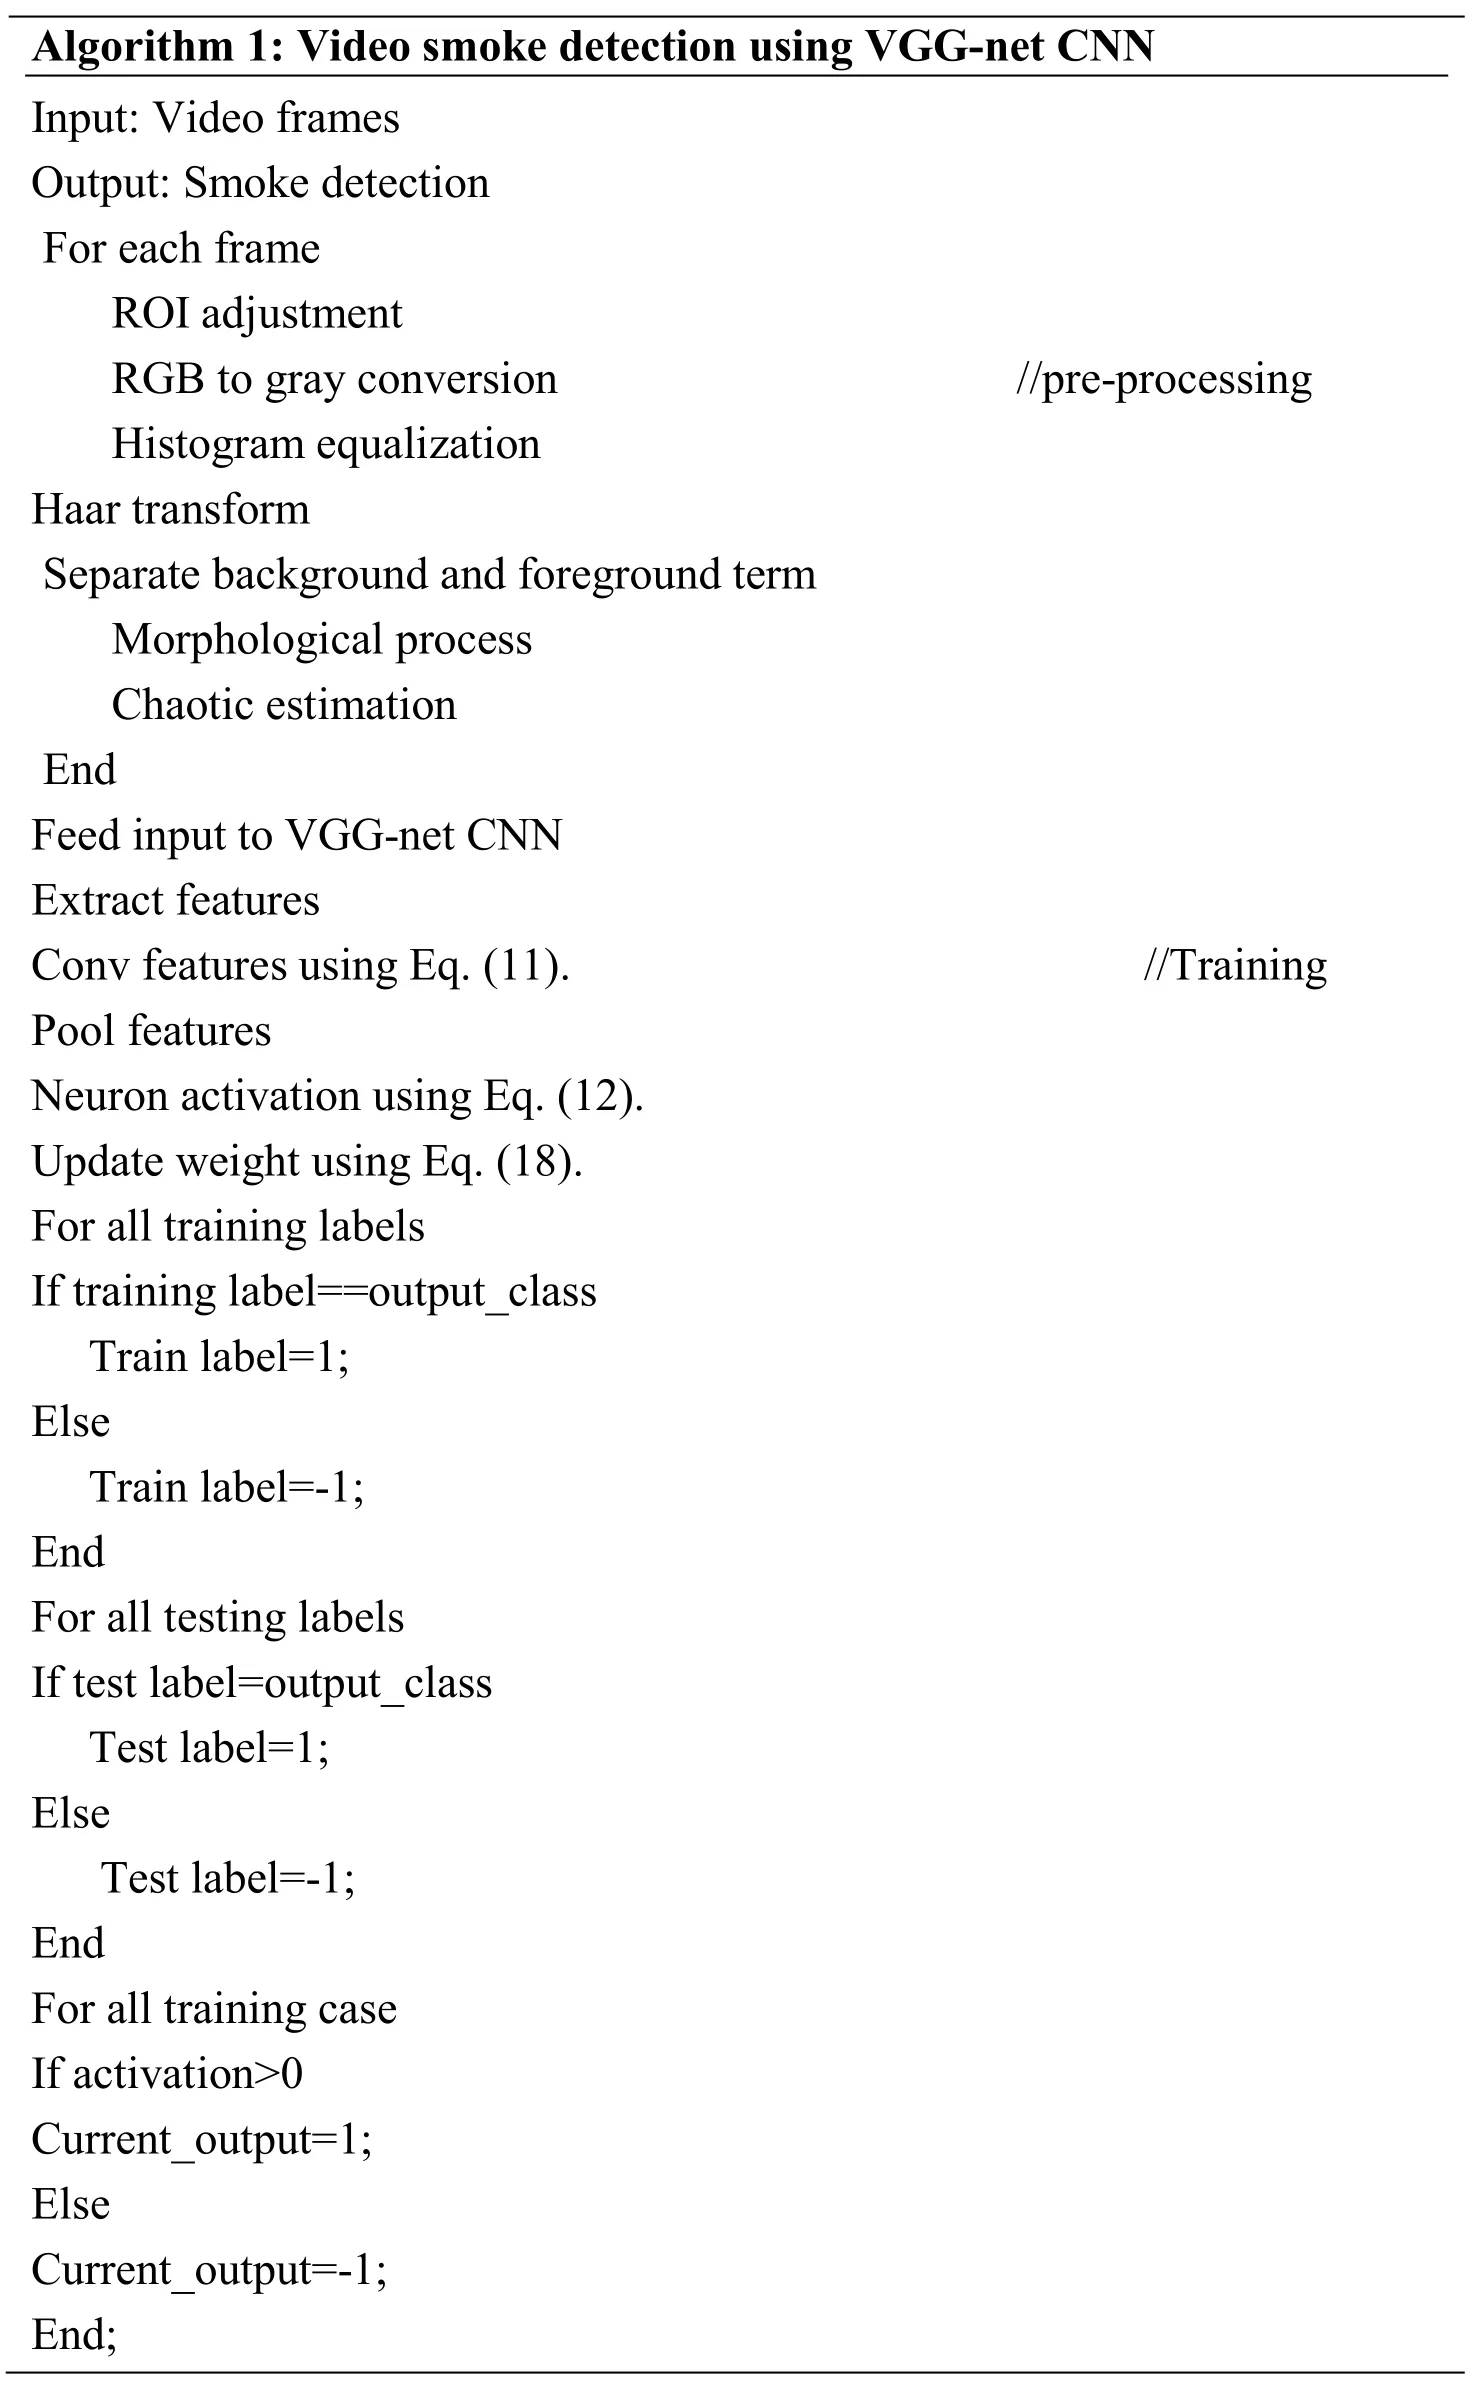
Algorithm 1:Video smoke detection using VGG-net CNN Input:Video frames Output:Smoke detection For each frame ROI adjustment RGB to gray conversion //pre-processing Histogram equalization Haar transform Separate background and foreground term Morphological process Chaotic estimation End Feed input to VGG-net CNN Extract features Conv features using Eq.(11). //Training Pool features Neuron activation using Eq.(12).Update weight using Eq.(18).For all training labels If training label==output_class Train label=1;Else Train label=-1;End For all testing labels If test label=output_class Test label=1;Else Test label=-1;End For all training case If activation>0 Current_output=1;Else Current_output=-1;End;
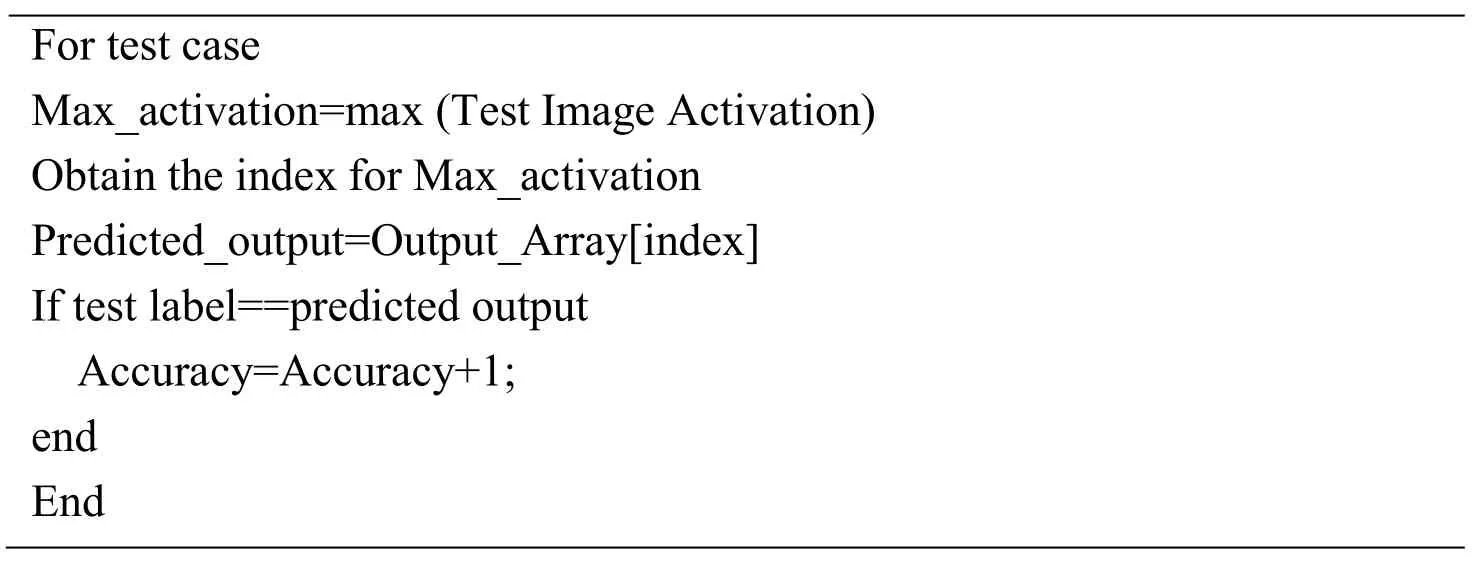
For test case Max_activation=max(Test Image Activation)Obtain the index for Max_activation Predicted_output=Output_Array[index]If test label==predicted output Accuracy=Accuracy+1;end End
3.1 Frame pre-processing
3.1.1 The Region of Interest(ROI)
First,the input image is cropped for the smoke part with m*n image size.This procedure can be finished automatically or manually.Here all the frames achieve ROI analyses,and then the particulars of both interpreter reliability and region delineation are completed in their report of these studies.ROIs are demarcated on the frame slice in which the arrangement is envisioned to be at its heaviest.With image analysis platform we can separate video into 1162 frames.
3.1.2 Channel separation
Secondly,the RGB image is divided into three different grey scale images.After video to image conversion,the RGB image is changed over into Grayscale image.RGB image intensity dimension m*n is transformed into a gray scale image.Gray level intensity is considered by 0.229 to R,0.587 to G and 0.114 to B and summarizes all these values to discover the intensity function.After applying this condition,the dimensionality of image information can be decreased due to colour conversion and visual features of the image can be improved[Yang(2007)].
3.1.3 Intensity regularization
Apply 2D-DCT in all the three channels to avoid the problem of variant illumination.The most standard method for the compression of an image is Discrete Cosine Transform(DCT).DCT is applied in numerous Non-analytical applications like video conferencing.The DCT is applied in transformation for image compression.It is an orthogonal transform and has a stable set of base function.DCT is mainly castoff toward mapping an image space into a frequency[Chen and Li(2006)].
3.1.4 Histogram equalization
Histogram equalization has been mostly utilized for the improvement of contrast image characteristics.Histogram equalization is the technique for enhancing the image quality.During this process,image intensity will be distributed among the whole image.Thus,the histogram equalization process gives the various intensity values over the total image.Below Eq.(1)gives the general form of the image histogram.

In this above Eq.(1),ϑminis the minimum cumulative distribution function of an image.
3.1.5 Transform
The discrete wavelet transforms to Haar basis has been applied to resize the image and to remove high frequencies on horizontal,vertical and diagonal details.The wavelet transforms to Haar basis is the simplest and the fastest algorithm that is necessary for the systems of video processing.2-D discrete Haar wavelet transform is utilized to decompose the input image.Discrete Haar Wavelet Transform is a method to transform the image pixels into wavelets,which are then used for wavelet-based compression and coding.
In this the image was dissected into two segments they are trend or approximation(average)and fluctuation or detail(difference).
Here initial average image formula
Here initial average image formulaat one level with the signal length Ni.ef=f1,f2...fn.


In order to apply the implementation procedure in image compression,the applications procedure was explained by plain example as shown below.For the finite 2D image 2D HT method was applied.
3.2 Background and threshold update using the alpha channel
Accurate separation of a foreground object from the background using blending parameter(so-called alpha channel)controls the linear combination of foreground and background components.Alpha matting is a methodology to separate a frame into a linear arrangement of the background image and foreground image over an alpha channel.It is a significant challenge in artificial intelligence to filter out the foreground image for image processing.An effect of the adjacent background colour could be removed.Let us consider the foreground,and background images asfandb,in which the subsequent formula may be done for each pixels p,

In the above Eq.(4),αpi∈[0,1]is the foreground opaqueness of pixelpi.For the wildfire smoke detection database,the combined frameF,resolving forf,bthenαis also an inverse challenge of the similar research methodology.Through the assumption of bothfandb,it assures an identical neighbourhood standard around a secure form.In which the hard limitation could be simply required to the cost function.
3.3 Foreground construction
Then,we have applied the threshold processing to receive the binary foreground.Here,we should use the Otsu thresholding.
3.3.1 Otsu method
Otsu method is to remove the Background area from a wildfire frame for fast processing which efficiently determines the background/main parts in the pre-processing step among the image processing[Chen(2012)].The classification has performed by allocating a label to each pixel as main part and foreground areas as,binary image.This technique is suitable for image Binarization,here only the foreground will be reconstructed and then the foreground image to be binarized.An image can be divided into two regions on the basis of a global threshold T to minimize the inner class changes of black and white pixels.

P1(Th)is the probability of foreground object andP2(Th)is the background object probability.µ1(Th)is the mean of foreground value andµ2(Th)is the background mean andσis the variance of the grey level image.The background and foreground standard,consistently maximizes the between-class partition in the foreground and background and with the same time,reduces the entire variance in all fore-ground and back-ground regions.Otsu's criterion enrols almost identical attention in entire regions with mean value of an assumed image to be segmented with comparatively suits to partition those images with dispersed homogeneities,i.e.,some method emphases on both the entire regions.
3.4 Morphological processing
In the next step of the algorithm to clear of noise and to attach of moving blobs,the connected component assessment has been utilized.This form of assessment has taken in a noisy input foreground. Morphological processes have been utilized to diminish the noise.On the next step of algorithm to clear of noise and to connect of moving blobs the connected components analysis has been used.This form of analysis has taken in a noisy input foreground.Morphological operations have been applied to reduce the noise.The morphological filter involves the application of a combination of erosion and dilation operators on the noisy frames.Video frames are significantly degraded through some noises(spikes),i.e.,actual large positive or negative values of the very short interval.The noise suppression with the proposed morphological filter comprises of dilation succeeded by erosion in the initial phase and erosion is succeeded through dilation in next phase using elemental structure disk(β).The structure elemental disk must be equivalent to the width of image noise.In which,(β)contains a range of one's of size 10.This allows elimination of unwanted noise devoid of presenting any falsehood in information.
Mathematical modelling of morphological filtering is discussed below:
3.4.1 Erosion

whereP2demonstrates the erosion image,P1represents the initial image andβdenotes the structure elemental disk.From the time when this erosion practice shaves off the sharp peaks.
3.4.2 Dilation

Eq.(3)represents the dilation process,during this dilation process;it restructures an image without the sharp peaks.In this Eq.(3),P3is the outcome of the dilation process.
3.5 Contour analysis and chaotic motion estimation
This analysis can search of all contours is carried out.Then it tosses the contours that are too small and estimate the rest with polygons.For chaotic motion estimation and Optical flow calculation has been done only for the blocks belonging to the foreground.This process can diminish the false detection rate effectively.Here,we have utilized the Farneback optical flow method.The average angular error function is estimated to assess the functioning of various optical flow evaluation techniques.
3.5.1 Chaotic motion analysis
Due to the convection flows and air currents,smoke and fire variation occur in each frame with respect to shape and dimension.This variation leads to a chaos in this approach.The bounding box of the blob was created in regards to the proceedings from the motion identification a histogram of the(x,y)point of several white pixel.Histogram was updated for incoming data from the motion detection component during every time lapse.More uniform histogram was produced during the high entropy which was taken into an account by means of Kurtosis,in formulae

whereµ4represents the fourth order momentum distribution and the value ofβfor Gaussians was three,and this value reaches zero for uniform distribution.In order to filter the false alarms that were produced by the objects that are moving in the image uniformly,then the available values were provided.
As a significant physical strategy of smoke turbulent,it has an arbitrary flow which has abundant shape and size variation.When we consider the smoke particle,it is the collection of lots of spots,as a consequence of the turbulent acceleration;the velocity of particles will have different allocations.So,here we have used some optical flow techniques for measuring optical variation[Chunyu,Fang,Wang et al.(2010)].So the average of the optical flow velocity field falls into an interval in a fixed scene.
This is a metric in which flow estimation is executed between two images,and this is given in below Eq.(9).

In the above algorithm,X,Yrepresents the current optical flow and the estimated optical flow is signified asXeandYe.These estimated optical flows likeXeandYeare computed through different frames of the video database.Here,we should have used two frames for current estimation.Motion estimation with the Farneback method utilizes quadratic polynomials for providing the motion flow between two frames.In this method,the local model is produced,and it is the local coordinate system.It is given in the following Eq.(10).

In the above equationMis the symmetric matrix,Nis the vector value andeis the scalar value.Farneback is a compact optical flow algorithm since it calculates the optical flow for all pixels in the image.Coefficient of co-directional motion of the particles is determined as:

where-Vcnumber of motion vectors collinear,Vt-the total number of motion vectorsfor regions of interest.
Next image is segmented with the normal tiling process.Finally,this work is processed by using deep VGG-net CNN to determine whether the features or smoke or not.
3.6 Deep VGG-net CNN classifier for moving blob classification
Finally,deep characteristics are extricated automatically utilizing VGG-Net feature extraction technique.This transforms the training set of the individual channel which is utilized as input to the classifiers.Here a new learning procedure that easily accommodate with current deep net architectures.In order to avoid over-fitting the parameter space was reduced by associating all the parameters together and forcing them orthogonally between the groups.
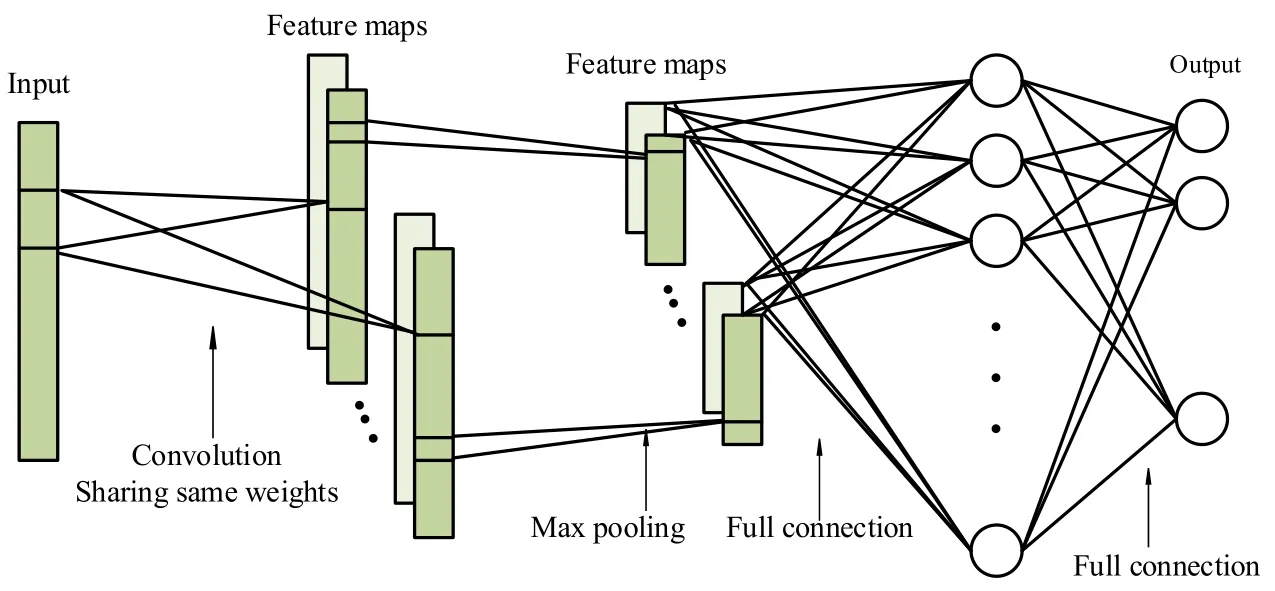
Figure 2:Architecture of CNN classifier
Fig.2 represents the CNN classifier,and it contains three layers convolution layer,pooling layer and fully connected layer with the output.
3.6.1 Deep VGG-net feature extraction
Image Feature Extraction Utilizing VGG deep features could be exactly castoff as input to the convolutional neural networks to solve classification related problems.Here minimum frame pixels can be utilized for the training set of weight parameters estimation.Following the dimension theory,an enormous amount of weight parameters effect is the more difficult task which requires more training models for avoiding over-fitting issues.In distinction,CNN samples merge weights into considerably smaller kernel categorises that intensely shortened the learning sample;and the CNN system is faster and more vigorous than conventional fully connected systems.
3.6.2 Convolutional layer
Input of the network is regularised an image patch with zero mean and unit variance.The first layer is a convolutional layer through 16 output channels and kernel size of 7×7 pixels.The second layer has 2×2 kernel size with max pooling.In this each layer it has 100-50-5 neurons with fully connected neural network.While comparing with all algorithms,it has unique convolutional layer.As the input patches are VGG net text features.The system with a unique layer works as well as networks with multiple convolution layers in smoke patch classification tasks.The hybrid network systems also maximally minimize the amount of parameters to be learned,this supports for avoiding the over-fitting issues.At the last,we get the classified output as true positive,true negative,false positive and false negative.
CNN is a special kind of deep neural network which can recognize the visual pattern directly from the original image.The quality of the theory was not properly shown by the measure as the prospect of training samples were provided to over-fitting.In CNN,convolutional neuron layers are represented as the key component and here input of the layer is the single or multiple 2D matrices(or channels)and the output is the multiple 2D matrices.It has some variation in the input and output layers.Single output matrix for the CNN network is given by the following Eq.(12).

For getting the resultant matrix,the bias valueis added,and each time convoluted matrix is computed.In the second step,apply a non-linear activation functionffor getting the resultant matrix,and this could be applied to the earlier matrix.Every kernel matrix set denotes a local feature extractor which obtains local characteristics from the input frames.The objective of this convolution process is to get kernel matrix set which extracts good discriminative elements to be cast off for the categorization of the smoke detected image.Here the optimization has done in the back propagation algorithm,and it optimizes the weight between the connections.
3.6.3 Pooling layer
In this pooling layer,the dimension of the characteristics to be also reduced the output matrix dimensions are reduced with the pooling algorithm.Here,max pooling layer with the kernel size of 2×2 chooses the maximum limit from the four adjacent features of the input matrix to create the single element in the resultant matrix.Finally,pooling output is got from the gradient signal.
3.6.4 Neuron activation functions
Neuron activation function is utilized for triggering the speed and classification functioning of the system.In our work,we should have used logistic activation function.

This logistic activation function has improved the classification performance,and it is better than other activation functions.
In data distribution the mapping was done from the input to output and the learning algorithm was retrained for mapping when the input changes.This re-train process may disturb the deeper layers too.During every retraining process the data in each layer gets changed.So,the data needs to be normalized by deducting the mean and divide it by the standard deviation before providing it to each layer to improve the stability of the deep neural networks.
3.6.7 Training with back propagation
We augment training data by resizing the shorter edge of input image to 113 with original aspect ratio and then randomly cropping 113×113 image patches from the input image.It is important to keep the original aspect ratio which contains important information of smoke detection.In this phase of CNN,weight updation is processed,and it is the speedup process of learning.
3.6.8 Weight optimization by artificial bee colony
For the weight optimization artificial neural network uses bat algorithm to train the neural network.The nodes weights are optimized by using bat algorithm,each input node represent a set of weights for the neural network.Thus the population is generated initially by this phase.
The fitness function is given in the below equation:

3.6.9 Artificial bee colony optimization algorithm
A simulated onlooker bee selects a sustenance basis contingent on the possible worth related by that sustenance basis,pi,intended by the subsequent appearance(15).

fit(xi)denotes the fitness function of ithelement andNis the number of colony size.Objective function is given in the below Eq.(16):

Population of food position is calculated from the previous memory of the colony which is given in the below Eq.(17):

xijdenoted the food sources within the colony.The value ofφijshould be lies within the limit of(-1,1).The value ofk∈{1,2 ,...n}andj∈{1,2 ,..m}.For each iteration fitness value andvijare estimated and greedy selection algorithm is effectively utilized to compare with the initial food sources and which yields the best values for the number of iterations.For onlooker bee phase the food sources are replaced with the below Eq.(18):

So for the updated food sources this optimization is repeated until the maximum value is obtained.So this optimized solution is used for the solution of ANN weight optimization.Scout Bee phase is utilized only if the abandoned solution is got from the optimization steps.Below figure demonstrates the algorithm for Hybrid Artificial Bee Colony optimization based Neural Networks.So the complexity of weight optimization is reduced since it can be used for online applications.In order to rectify this kind of problems,regularization concept is introduced here.
3.6.10 L2 &L1 regularization
The most common methods of regularization were L1 and L2 which were used to modify the cost function by integrating it with an additional term known as regularization term.

As the regularization term was added to this value the weight get reduced because it estimate that the neural network with less weight matrices may lead to the simpler design.In the meanwhile,it decreases the over-fitting to some extent and this regularization term varies from both L1 and L2.
In L2:Lambda was considered as a regularization parameter which was a hyper parameter and the values were optimized to obtain the better results.L2 regularization was also known as weight decay as it makes the weight to reduce to zero.

In L1:
The total value of the weights was corrected.But here,in L2 the weights were reduced to zero.This value was very useful to constrict the model or else the value of L2 was preferred over it.

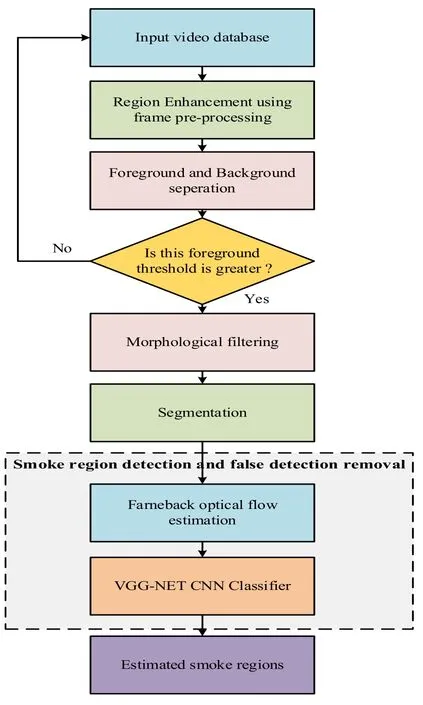
Figure 3:Proposed process flow diagram
Fig.3 represents the process flow graph of the suggested methodology.Finally,we can get efficient classification with accurate detection,and this can be appropriate for many real time applications.The discovery of the suggested technique is possible with true positive,true negative,false positive and finally false negative strategies.
4 Experimental setup and evaluation
The suggested video smoke discovery structure is executed by utilizing the MATLAB with an Intel Core 2-Quad processor PC[Ko,Park and Nam(2011)].The wildfire smoke videos and smoke coloured videos are combined in this database which contains the clouds and the fog to verify the capacity of the suggested scheme to categorize the actual wildfire smoke.From the KMU fire and the smoke database,the datasets are taken that consists of 38 various fire videos like Indoor-outdoor flame,Indoor-outdoor smoke,Wildfire smoke,and Smoke &fire like moving object.While the size of every input image was 320×240 pixels,the frame rates of the video data is differed from 15 to 30 Hz.
The 517 blocks are arbitrarily chosen from ten videos to execute the training 130 blocks of dense smoke,131 blocks of tenuous smoke,120 blocks of tenuous smoke colour clouds and fog,and 136 blocks of dense smoke like clouds and fog.The training video sequences have contained five videos which comprised the wildfire smoke and the five videos that involved the smoke-colour clouds and fog.Our executions are matched with the two present methods such as KNN and ANN.In the end,the executions are estimated concerning True Positive Rate,False Positive Rate;Root Mean Squared Error,Normalized Root Mean Squared Error,Specificity,Positive Predictive Value,Negative Predictive Value,False Discovery Rate,Matthews Correlation Coefficient,F1-score and Balanced Error Rate.
4.1 Data set description
The wildfire video sequences of 320×240 image sizes are being applied to execute the assessment.All through the lack of common approachability of video sequences containing smoke and all this information are gathered from numerous shows.These data bases are smoke-coloured test arrangements and it is acquired from our database.The Investigates are organized by arbitrary initialization and fine tuning of parameters that are demonstrated in the below Tab.2 for training and testing the model.

Table 2:Simulation parameters
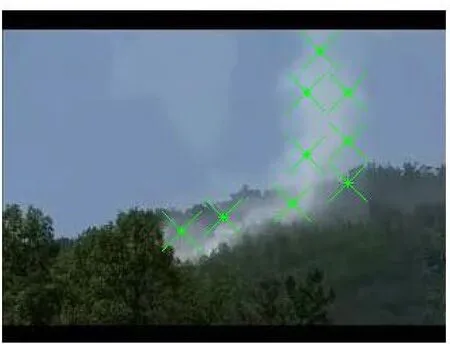
Figure 4(a):Wild smoke detection
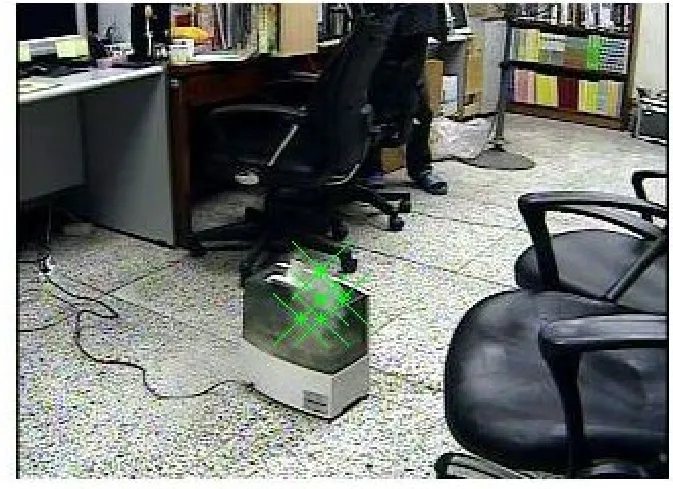
Figure 4(b):Indoor smoke detection
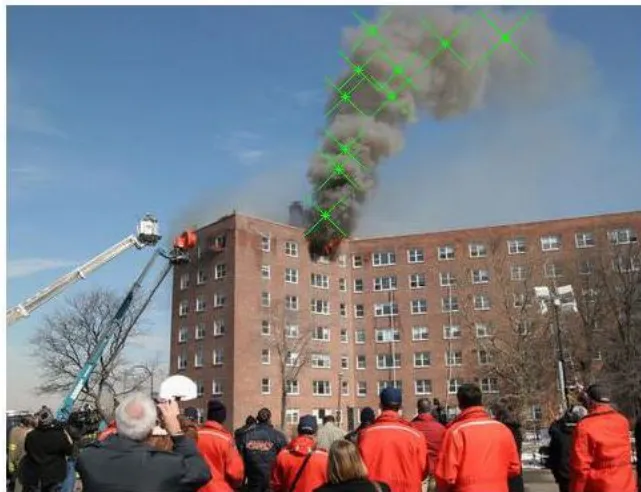
Figure 4(c):Outdoor smoke detection
We can obtain the detected smoke region from the given Figs.4(a),4(b)and 4(c).The smoke presented areas are indicated in the above figures.With the effective new VGG net CNN classifier,this can be discovered.In Fig.4,the detected smoke area of the wild fire area is presented;the detected smoke area of the indoor is illustrated in Fig.5;and in Fig.6,the detected smoke area of the outdoor is presented.
In case of real scenarios,the alarm is set for the detection process.This can be detected with the false positive,false negative,true positive and true negative rate.The amount of false negative smoke,this means that the work are not detects smoke in an image frame though it is actual smoke frames in it.Likewise,the amount of false positive smoke,this means that the work identifies the smoke in an image frame though there is no smoke at all.The number of Tpmeans the rate of properly sensing real smoke as smoke in a video clip.It should be obviously detected that the smoke can be suitably extracted and an appropriate alarm rose.
4.2 Pre-processing results
A few image processing methods are applied by the pre-processing steps that would have the ability to construct the implementation of the suggested detection algorithm and diminish the wrong alarms.For the improvement of compare image features,the histogram equalization has been commonly utilized.The discrete wavelet changes to Haar basis which has been utilized to resize the image and to eliminate the high frequencies on horizontal,vertical and diagonal details.For the systems of the video processing,the wavelet changes to Haar basis is the easiest and the quickest algorithm which is significant. In Fig.5,the outcomes of the pre-processing steps are presented.


Figure 5:Pre-processing steps
4.3 Quality measures
Some of the qualities measured are given below:
4.3.1 Specificity
Specificity is also known as true negative rate,and it is the action of the proportion of negative events.For a best case,it should be closer to one.


Figure 6:Specificity evaluation
The precision of the estimation contrast is shown in Fig 6.The value of the suggested work is 0.8333,and in case of ANN,it is 1.1973,and for KNN it is 1.1054.Therefore,when contrasted with the two current algorithms,the suggested precision is low from the time when the precision is the true negative event.
4.3.2 False Positive Rate(FPR)
The fraction of non-relevant features remains recovered throughout of all features.For a best case,it should be closer to zero.


Figure 7:FPR evaluation
Fig.7 represents the FPR contrast the suggested and the current works.The value of FPR for the suggested work is 1.5,and for KNN,it is 0.6848,and for ANN it is 0.5443.This is the positive event from the time when the value of this measure should be high.When equated it with the KNN and the suggested work,the functioning of the ANN is low.
4.3.3 False Negative Rate(FNR)
FNmeans the positive instances happened for the detection case.For a best case,it should be closer to zero.


Figure 8:FNR evaluation
For the finer categorization,the FNR is a negative event and it should be low which is represented in Fig.8.The functioning of the suggested scheme is low it is 0.9918 and for KNN it is 0.9831 when contrasted to the current work which is 1.0068.
4.3.4 Precision
It determines the positive predictive value and higher values of this precision represents more information presented in the image.

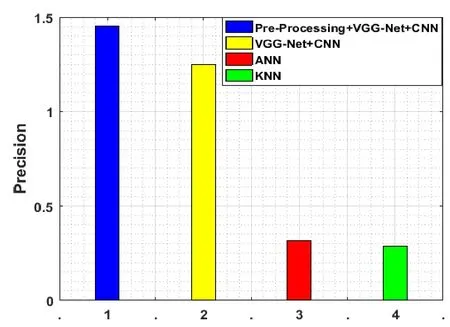
Figure 9:Precision evaluation
For the sake of attaining the finer categorization,the accuracy of the suggested scheme should be high.It is positive event therefore it attains the higher detection that is presented in Fig.9.The value of the present work is 1.2833 and,the value varies from 0.3186 and 0.2813 in case of additional systems.
4.3.5 Recall
The recall is the ratio of an amount of suitably matched block to the total sum of the appropriate block.

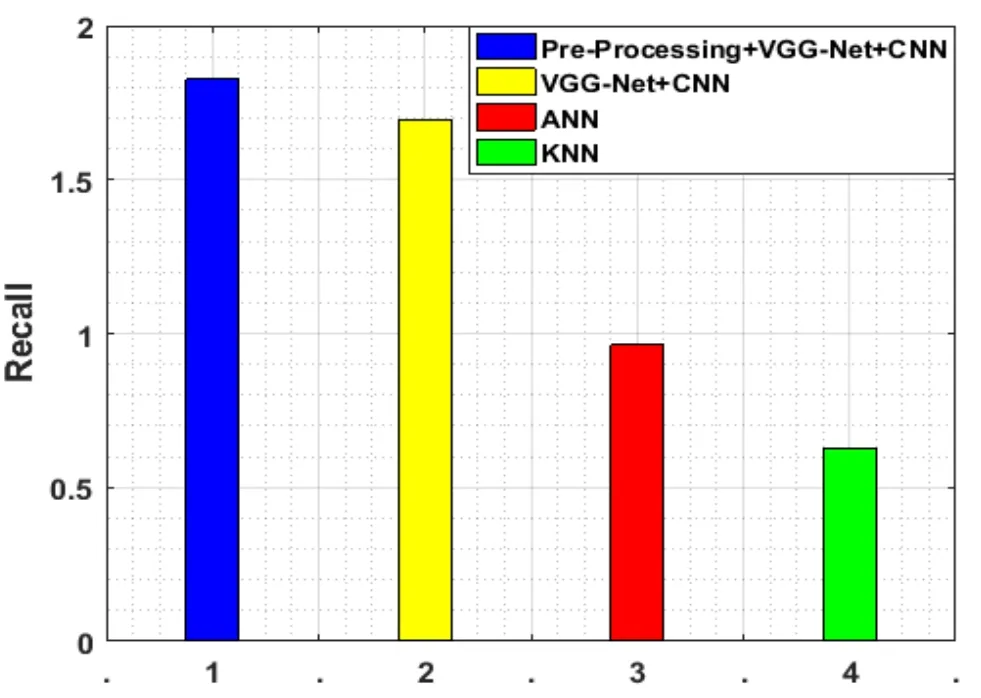
Figure 10:Recall evaluation
The number of suitable identical block inside the image is quantified by the recall and for the sake of illustrating the effectiveness of the work,this calculate should be high that is shown in Fig.10.The value of the suggested work is 1.6971 and,the values are 0.9626 and 0.6272 for the current algorithms.
4.3.6 F1-score
It is the combination of precision and recall,and it is the mean average of both precision and recall.

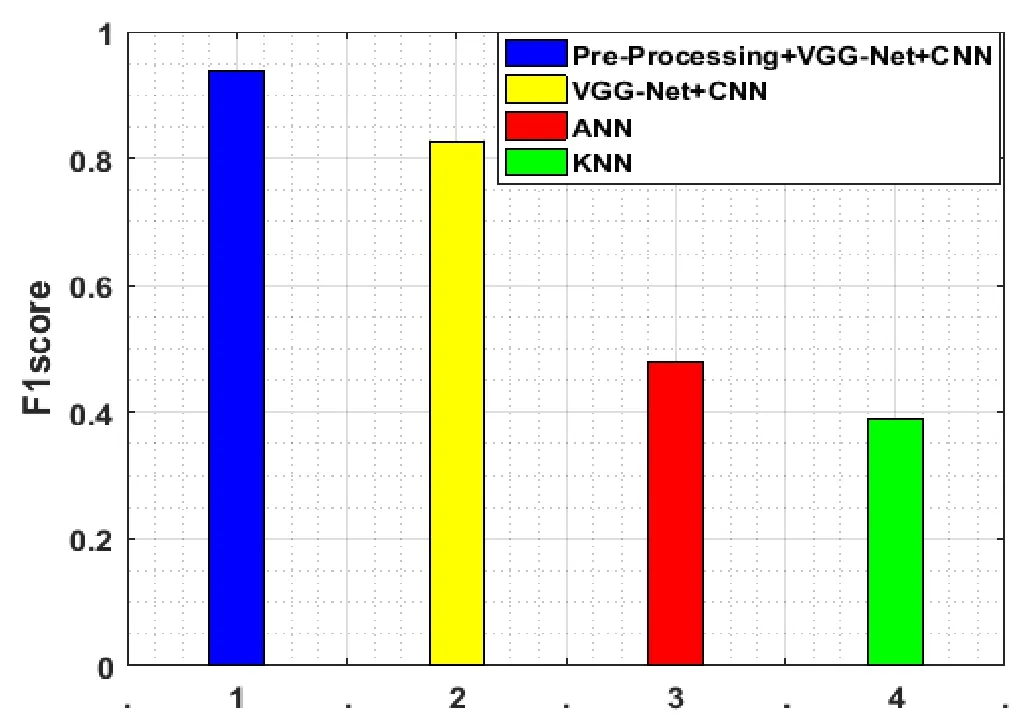
Figure 11:FI Score evaluation
For calculating the recall and the accuracy performance,the F1-Score is estimated in the given Fig.11.For the finer estimation,it should be high and the F1-score has higher performance than the noise level assessment.As per the given figure,the value of the suggested scheme is 1.4854,and the value of the current work is 0.2935 and for KNN the value is 0.4671.
4.3.7 Accuracy
Accuracy is the ratio of the amount of appropriate data retrieved to the total sum of retrieved data.
In our work we use 1162 frames,this leads to 96.33% of accuracy and when increasing the number of frames,it will lead to slight changes in the estimation accuracy.

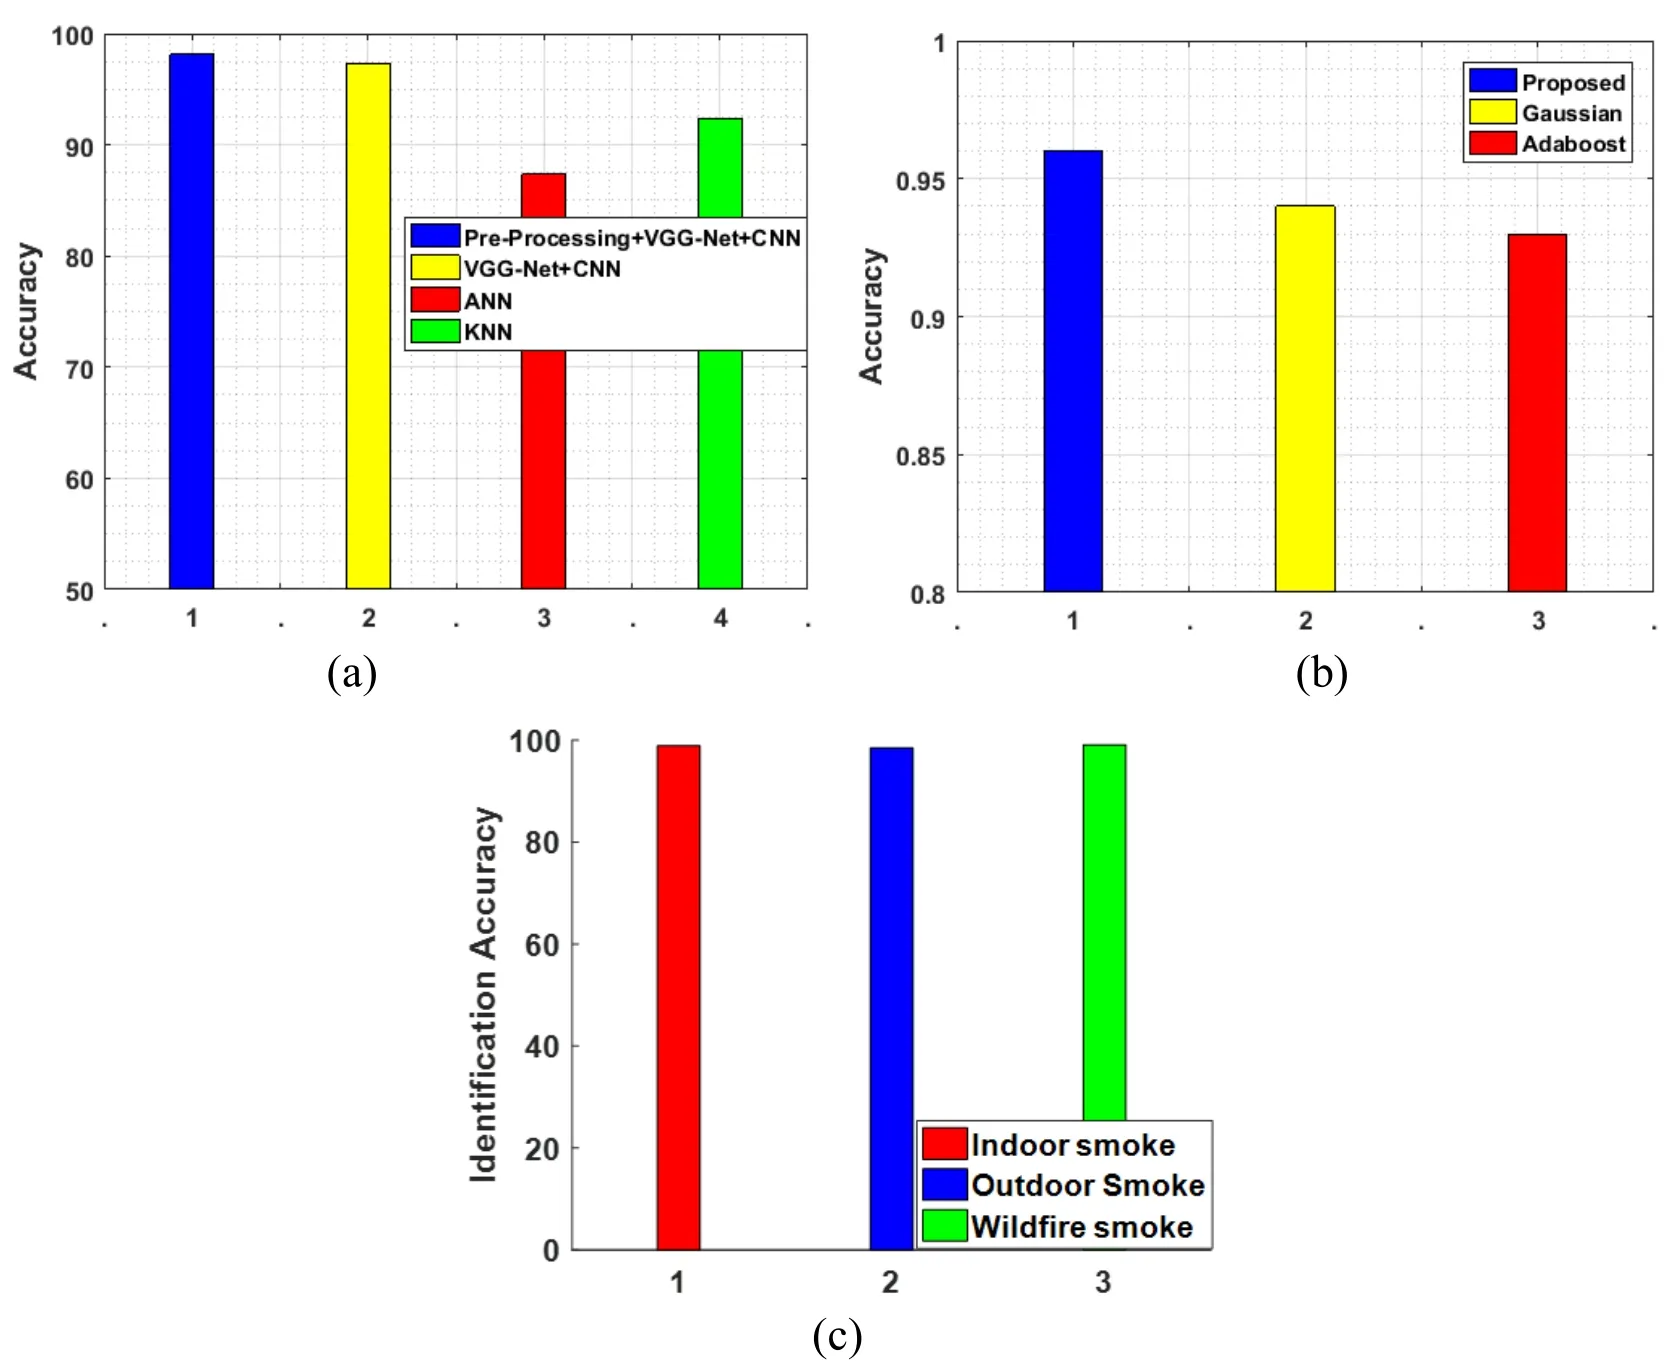
Figure 12:Accuracy evaluation
In Fig.12,the effectiveness of the suggested work is given and for comprehending this,the categorization precision is very effective one.The suggested work has 96%effectiveness which is better than the current works have 94%.We can obtain the finer categorization via the high precision.In Fig.12(c)identification accuracy for the separate images are evaluated.
4.3.8 Matthews's Correlation Coefficient(MCC)
Matthews's Correlation Coefficient is the connection between the perceived and the expected binary taxonomy.

Fig.13 vividly represents the Matthews correlation coefficient which is often utilized as a measure of the quality of categorization.In Fig.14,the outcomes of the local MCC measure are illustrated.This coefficient is considered as false positive and negative detections in a stable method thus the measure can be utilized even if the classes are of dissimilar sizes.The suggested work of the MCC is 0.6402 and for the current works the MCC is 0.4812 and 0.4617.
4.3.9 True Positive Rate(TPR)
TpRefers the positive instances happened at both the test and the training cases.It is the ratio of number ofTpto the sum ofTpandFn.

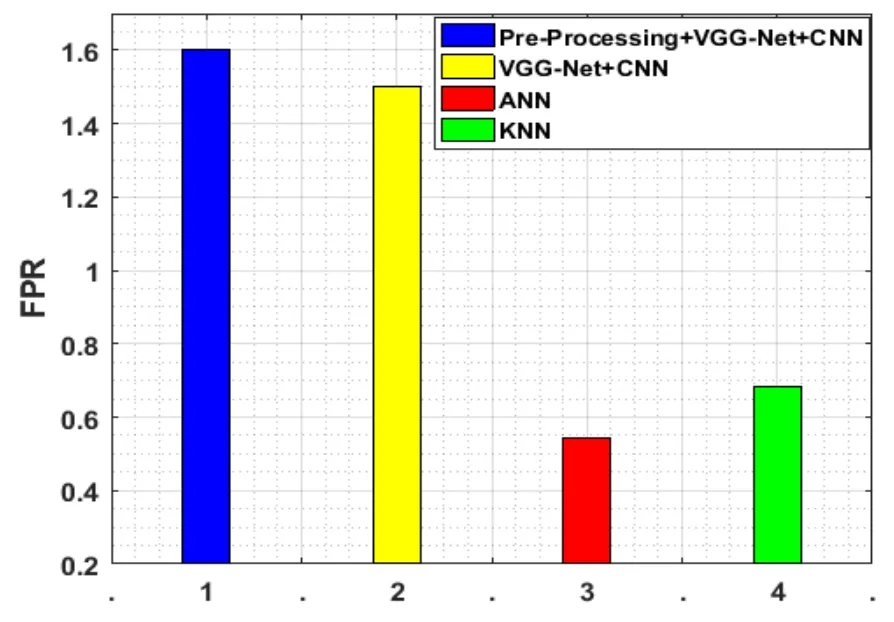
Figure 14:TPR evaluation
For the processing,the true positive rate is measured to discover the positive events that is vividly shown in Fig.14.The true positive rate of the suggested approach is 9167 and for ANN,TPR is 0.6136 and for KNN,TPR is 0.7152.The suggested work has the maximum likelihood of the positive events while contrasting with all these methods.
4.3.10 Negative Predictive Value(NPV)
The negative predictive values(NPV)are the extents of undesirable consequences in measurements and analytical assessments.

In Fig.15,for the effective processing,the negative predictive value should be low is presented.The NPV value of the suggested methodology is 0.8333 and for the current approaches,the values are 1.1973 and 1.39.We can obtain the better categorization if the negative events are diminished.
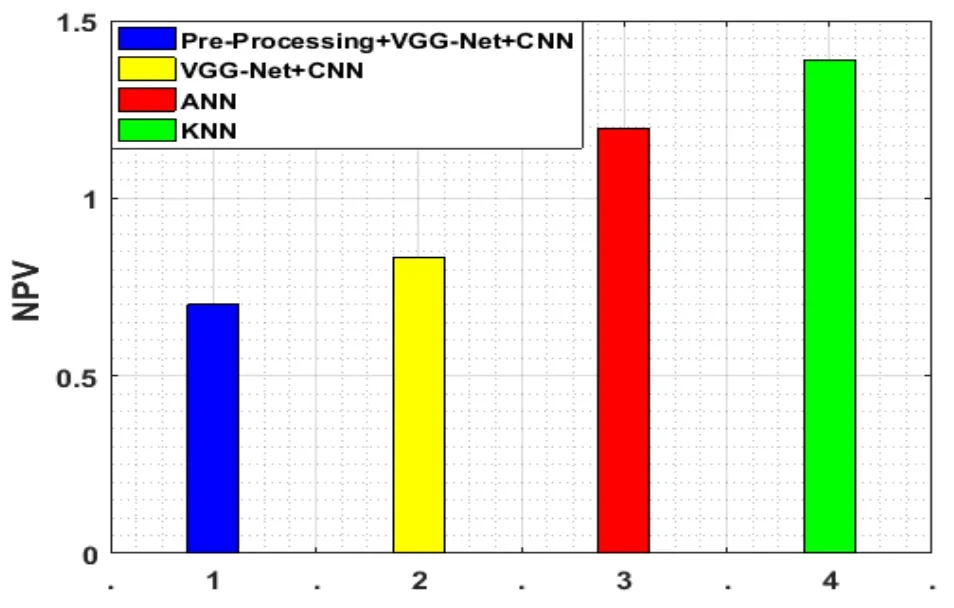
Figure 15:NPV evaluation
4.3.11 False Discovery Rate(FDR)
The false discovery rate(FDR)is some method of intellectualizing the proportion of fault in insignificant postulate challenging while accompanying various evaluations.

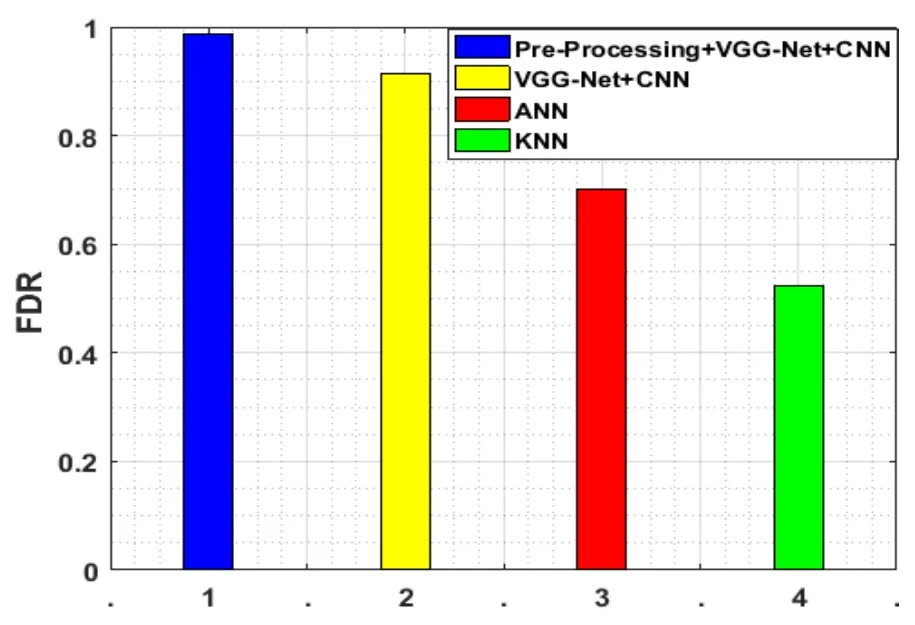
Figure 16:FDR evaluation
Fig.16 shows the false discovery rate estimation of the suggested method.The false discovery rate should be high and the farneback optical flow evaluation algorithm is used in this work.In work,the false detection is removed by the FDR and eventually,the diminished false detection rate can be obtained.Therefore,the suggested work has the highest discovery rate of 0.9167 while contrasting with the two present works.
4.3.12 Mean Square Error(MSE)
The MSE designates the quantity of similarity and the range of distortion in an image and which is given in Fig.17.This also measures the amount of reliability.

where N is the number of pixels within an image andXis the original image andYis the detected image.

Figure 17:MSE evaluation
The Mean Square Error is a risky method which is identical to the predictable rate of the quadratic loss or squared error loss.Only from the arbitrariness,the change has increased because the evaluator is not calculated for the data which could produce other specific evaluation.Here,the MSE is very low(i.e.,0.4171)and which is 54% and 77% better than the current works.
4.3.13 Normalized Mean Square Error(NMSE)
NMSE is a normalized estimator among both measured and the predicted value.

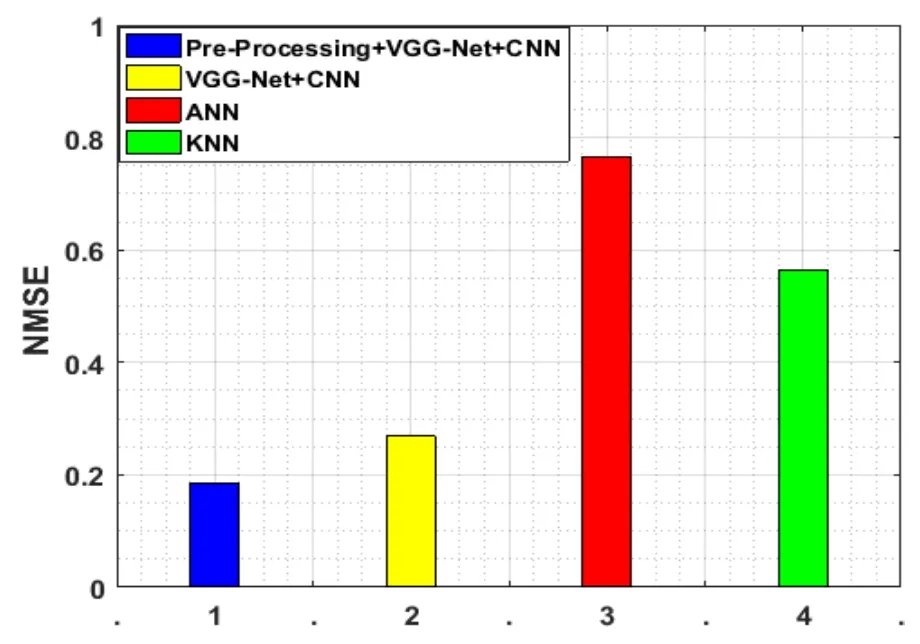
Figure 18:NMSE evaluation
In Fig.18,for MSE,the NMSE has commonly proved that the supreme outstanding variations amid the models are stated.Later,it has attained the lowest time and space intricacy when a model of NMSE is very low. Conversely,the highest NMSE standards are not really denoted that an instance is completely incorrect.This incident could be due to the advanced weight on the NMSE than variations on other standards.Here,for NMSE,the value is 0.2652 but in the event of the current works the value is very low which is 0.7652 and 0.5652.
4.3.14 Balanced Error Rate(BER)
The balanced error rate is the average errors on each class Balanced Error.The rate of BER should lie between zero and one.


Figure 19:BER evaluation
Fig.19 signifies the BER estimation.Our work has obtained less balanced error rate 0.7459 that is low when we contrasted it to the current works.
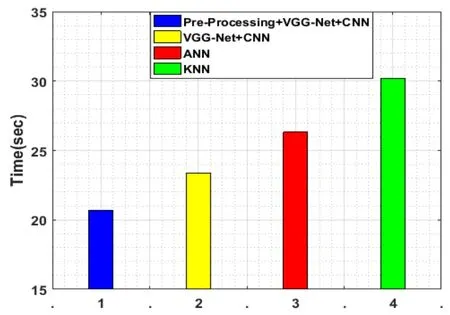
Figure 20:Computational cost evaluation
Fig.20 signifies the BER estimation and here the computational cost is evaluated in terms of processing time.So the proposed work needs 20.666 seconds to complete the detection.The performance estimation graphs are signified in the Figs.5 to 20 and the graphs are estimated concerning the performance effectiveness.Here,we have calculated on the basis of True Positive Rate,False Positive Rate,Root Mean Squared Error,Normalized Root Mean Squared Error,Specificity,Positive Predictive Value,Negative Predictive Value,False Discovery Rate,Matthews Correlation Coefficient,F1-score and Balanced Error Rate.
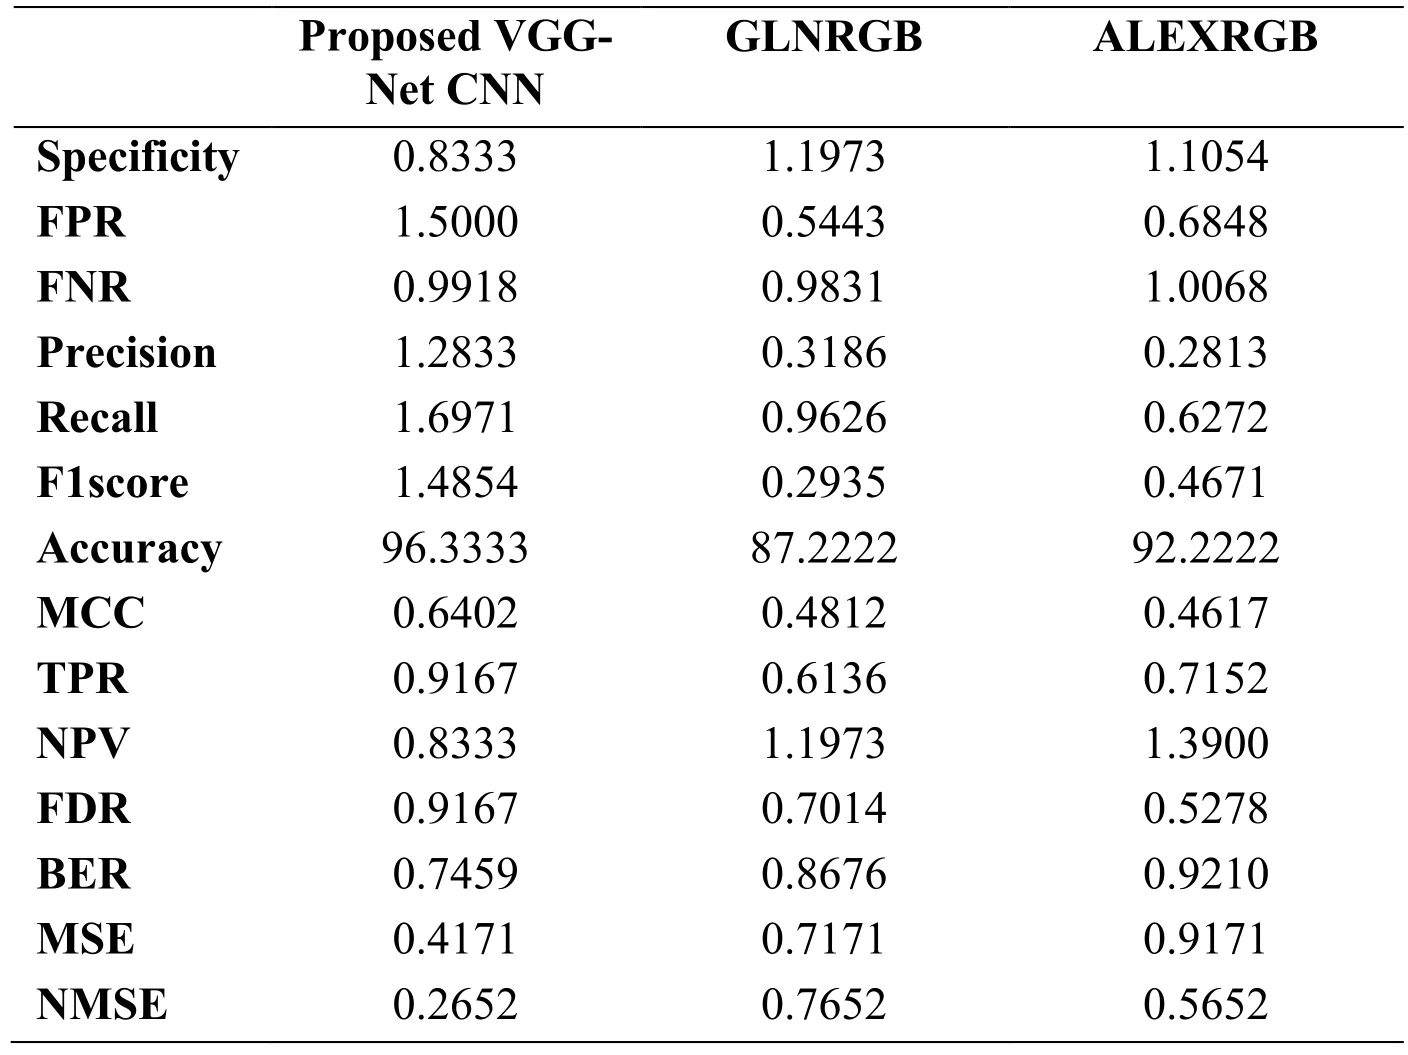
Table 3:Performance comparison of proposed with existing algorithms
The execution of the suggested method and the current works are contrasted and arranged in Tab.3.Here the comparison is given with the recent techniques namely GLNRGB and ALEXRGB[Leibetseder,Primus,Petscharnig et al.(2017)].The precision of the suggested process is 96% but while we contrasting it with the current algorithms it is very low.In the event of the suggested algorithm,the positive events such as TPR,PPV are high but the BER and the NMSE produce better execution.From the time when the suggested VGG-Net CNN has attained minimum value which is 0.73 and in the event of current works it is nearly equal to one.
The investigational outcomes have presented that the suggested method is strong to noise like smoke and subtle variances between the sequential frames contrasted to the earlier investigation.Nevertheless,in an actual life context,decreasing the wrong alarms in the nonsmoke areas and the miss rate in the smoke areas is still required for positive fire detection.
5 Conclusion
For protecting the ecological atmosphere and diminishing the capacity for losses and material damage,the automatic wildfire detection is more significant.In the investigational area,the condition has continuously improved from the time when in a distant area,the camera is a kind of observing method.We have presented a new smoke detection approach in this suggested process that is on the basis of the deep VGG-Net CNN classifier.In order to rectifying slow convergence problem,we have hybrid ABC algorithm in that.Here,with the optical farne-back chaotic evaluation method,the wrong matches are eliminated in which each and every block of the frames is discovered to detect the smoke area.When the small blocks are discovered then the related sections are indicated in the original image.In the end,the implementations are estimated in a MATLAB platform in which the performance are estimated on the basis of True Positive Rate,False Positive Rate,Root Mean Squared Error,Normalized Root Mean Squared Error,Specificity,Positive Predictive Value,Negative Predictive Value,False Discovery Rate,Matthews Correlation Coefficient,F1-score and Balanced Error Rate.In the end,the effectiveness of our work is equated with the two current classifiers such as SVM and ANN.
 Computer Modeling In Engineering&Sciences2019年6期
- Computer Modeling In Engineering&Sciences的其它文章
- An Automated Approach to Generate Test Cases From Use Case Description Model
- A Normal Contact Stiffness Model of Joint Surface Based on Fractal Theory
- Design of Smith Predictor Based Fractional Controller for Higher Order Time Delay Process
- Experimental Study and Finite Element Analysis on Ultimate Strength of Dual-Angle Cross Combined Section Under Compression
- IoT Based Approach in a Power System Network for Optimizing Distributed Generation Parameters
- 3D Bounding Box Proposal for on-Street Parking Space Status Sensing in Real World Conditions
