
Mechanical Response and Energy Dissipation Analysis of Heat-Treated Granite Under Repeated Impact Loading
2019-04-29 03:21:40ZhiliangWangNuochengTianJianguoWangShengqiYangandGuangLiu
Computers Materials&Continua 2019年4期
Zhiliang Wang , Nuocheng Tian, Jianguo Wang, Shengqi Yang and Guang Liu
Abstract: The mechanical behaviors and energy dissipation characteristics of heat-treated granite were investigated under repeated impact loading. The granite samples were firstly heat-treated at the temperature of 20°C, 200°C, 400°C, and 600°C,respectively. The thermal damage characteristics of these samples were then observed and measured before impact tests. Dynamic impact compression tests finally were carried out using a modified split-Hopkinson pressure bar under three impact velocities of 12 m/s,15 m/s, and 18 m/s. These test results show that the mineral composition and the main oxides of the granite do not change with these treatment temperatures. The number of microcracks and microvoids decreases in the sample after 200°C treatment. The mechanical properties of a sample after 600°C treatment were rapidly deteriorated under the same impact velocity. The average of peak stress is much smaller than those after 20°C, 200°C and 400°C treatments. The heat-treated samples have an energy threshold each. When the dissipated energy of a sample under a single impact is less than this threshold, the repeated impacts hardly lead to further damage accumulation even if its total breakage energy dissipation (BED) density is large. Under the same number of repeated impacts, the cumulative BED density of a sample after 600°C treatment is the largest and its damage evolves most quickly. The total BED density of the sample after 200°C treatment is the highest, which implies that this sample has better resistance to repeated impact, thus having less crack initiation and growth.
Keywords: Granite, heat treatment, repeated impact, dynamic response, energy dissipation.
1 Introduction
The influence of high temperature on the mechanical properties of rock has become an important research direction in rock mechanics. Geological engineering activities, such as the safe disposal of nuclear waste material [Sundberg, Back, Christiansson et al. (2009)],underground coal gasification [Roddy and Younger (2010)], geothermal resources extraction [Siratovich, Heap, Villeneuve et al. (2016)], rock drilling [Nasseri, Tatone,Grasselli et al. (2009)] and the underground compressed air energy storage [Ren, Zhuang and Rabczuk (2017); Zhou, Xia, Du et al. (2015); Zhou, Xia, Zhao et al. (2017a)], are related to the thermal-mechanical properties of rock. Therefore, studying the influence of temperature on the physical and mechanical properties of rock is of significance to the design of rock structures and the safety assessment of underground rock engineering.
In the past decades, a number of scientists have studied the mechanical properties [Zhou,Xia and Zhou (2017)], energy dissipation characteristics [Zhuang, Huang, Liang et al.(2014); Xia, Zhou, Zhang et al. (2015)], damage constitutive models [Zhou, Zhuang, Zhu et al. (2018); Zhou, Xia, Zhao et al. (2017b)] and fracture peculiarity [Rabczuk and Ren(2017); Hamdia, Silani, Zhuang et al. (2017)] of rocks under static or quasi-static loading.In particular, [Zhou, Xia, Hu et al. (2015)] investigated the deformation characteristics of basalt rocks subjected to cyclic temperature and uniaxial stress. They found that the basalt broke within a small number of cycles when the maximum stress was 80% of the uniaxial compressive strength (UCS). There was a hardening phenomenon when maximum stress was 65% of the UCS and the highest temperature was 60°C. Rabczuk et al. [Rabczuk, Goangseup, Stephane et al. (2010)] proposed a new particle method for description of crack growth, which was suitable for representing the evolution of cracks in rock materials under static or dynamic loading. In addition, Crosby et al. [Crosby,Gullett, Akers et al. (2018)] investigated the mechanical behavior of salem limestone containing thermally-induced microcracks. They found that microcracks lowered the strength and stiffness of the material at higher strain rates. Although similar incident stress pulses were imparted to the samples, higher strain rates were observed for increasing levels of damage. Dynamic compression tests on Longyou sandstone after 25°C, 250°C, 450°C and 600°C treatments were conducted using split Hopkinson pressure bar (SHPB). It was found that there was an increase in strength at 450°C due to the closure of original cracks/voids caused by the baking effect of clay minerals [Huang and Xia (2015)]. Fan et al.[Fan, Wu, Wan et al. (2017)] reported a negative linear relationship between the dynamic strength of granite and the treatment temperature under the same loading rate. Liu et al.[Liu and Xu (2013)] performed dynamic compression tests on marble with five impact velocities using SHPB. They reported that the peak stress of the sample heat-treated at 100°C showed an upward trend compared with 25°C under the same impact velocity, while the peak stress decreased when the treatment temperature of sample exceeded 400°C. These previous studies have focused on the effect of temperature on the mechanical properties of rock under static or single dynamic load.
In rock engineering practices, such as drilling, cutting, and blasting, rock was subjected to high temperature action and usually destroyed by multiple dynamic loads. Therefore,this study focuses on the thermal damage mechanism, strength and deformation properties along with energy dissipation law of Huashan granite. X-ray diffraction (XRD),X-ray fluorescence (XRF) spectrometry analysis and scanning electron microscope (SEM)observation of the heat treated samples were performed. The mineral compositions of the granite material were measured at different temperatures and the thermal damage mechanism of an uncompressed granite sample was analyzed. Subsequently, the repeated impact tests in a modified SHPB system were carried out on the samples after different temperature treatments. The stress-strain curves were obtained and the variations of the peak stress, peak strain, elastic modulus and energy dissipation of the granite under coupling effects of high temperature and dynamic loading were investigated.
2 Experiment setup
2.1 Sample preparation and heat treatment
The samples for this experiment were made from a fine-grained biotite granite in the Huashan area of Shanxi Province (China). The granite blocks were taken from the same horizon. After coring, cutting and grinding, the blocks were then processed into Φ70×35 mm cylinder samples according to the recommendation of the International Society of Rock Mechanics [Ulusay (2014)]. The depth of parallelism of the two ends of the sample was controlled within ±0.05 mm. Such a quality control can improve the experimental accuracy and reduce the effect of end-face on the test results.
Before heat treatment, the longitudinal P-wave velocities of all samples were measured using an acoustic detector, whose transducer frequency is 50 kHz, sampling interval is 0.1-200 μs, record length is 0.5-4 K, frequency band width is 1-500 kHz, and emission voltage 500/1000 V. Ultrasonic measurements on each sample were completed using the contact transmission technique before and after the heat treatment. Signals from the wave generator were transmitted to the sample at the left end via a sensor and picked up by a second sensor attached to the right end of the sample. Some vaseline was smeared on the surface between the transducers and sample for close contact. The signals were then digitized and saved in a computer for obtaining the ultrasonic P-wave velocity. Those samples with similar P-wave velocities were selected for the heat treatments.
The heating equipment used in this study is a box-type resistance furnace. This stove consists of heating element and thermostat. Its maximal heating temperature is 1000°C.Four temperatures of 20°C, 200°C, 400°C, and 600°C were selected for the heat treatment of the granite samples. The following heating procedure was used for the heat treatment: The sample was placed into the electric heating chamber, and then heated to the target temperature at a rate of 10 °C/min and maintained for 2h at this specified temperature to ensure uniform temperature inside and outside the sample. Finally, the power of the heating equipment was turned off, and the sample was naturally cooled down to room temperature. This obtained the heat-treated samples at different temperatures, as shown in Fig. 1.

Figure 1: Granite samples after different temperature treatments
2.2 Microscopic observation layout
XRD and XRF techniques were used to analyze the mineral composition of granite after different heat treatments. The maximum voltage of the X-Ray diffraction analyzer is 60 kV, the angle reproducibility is ±0.0001°, and the effectiveness is greater than 94%. For the X-ray fluorescence spectrometer, its micro-analysis minimum is 0.5 mm, goniometer is θ/2θ, relative error is less than 0.1%. In addition, SEM (JSM-6490LV) was used for the observation of micro-fractures that were induced as a result of the heat treatment. The SEM point resolution is 3 nm, the acceleration voltage is 0.5~30 kV, and the magnification of 5-300000.
2.3 Principle of SHPB test
The repeated impact tests were conducted using a modified SHPB device, as shown in Fig. 2. This device consists of main body, energy source and measurement systems. Main body mainly contains launch tube, projectile, incident bar, transmitted bar and buffer. The energy source system mainly contains air compressor, pressure vessel. The measurement system contains velocity and dynamic strain measurement setup. The projectile, incident and transmitted bars are made of 48CrMoA and have the elastic modulus of 210 GPa, the density of 7850 kg/m3, and the wave velocity of 5170 m/s. The sampling frequency of dynamic strain amplifier is 1MHz. The resistance strain gauge was used in the tests,whose sensitivity coefficient is 2.08, the gate length is 3 mm, and the acquisition frequency is 2 MHz.

Figure 2: Schematic of modified split-Hopkinson pressure bar
When the projectile strikes the incident bar at a certain velocity, a compressive pulse σi(t)is generated in the incident bar and this pulse propagates along the elastic bars. The magnitude of the pulse is determined by the velocity of the projectile, the duration of the pulse is determined by the length of the projectile, and the shape of the pulse is determined by the shape of the projectile and the material of the shaper. When the pulse reaches to the interface between the incident bar and the rock sample, it is partially reflected to form a tensile pulse σr(t) in the incident bar, and partially transmitted through the sample to generate a compressive pulse σt(t) in thetransmitted bar. The incident wave εi(t), the reflected wave εr(t), and the transmitted wave εt(t) signals can be measured by the strain gauges mounted to the elastic bar. According to the one-dimensional stress wave theory, the average stress, strain and strain rate of the sample are calculated by the following formulae [Zhou, Xia, Li et al. (2012)]:

where c is the wave velocity in bars and lsis the original length of sample; Aeand Asare the cross-sectional areas of bars and sample, respectively; E is the elastic modulus of the bars.According to stress wave theory, the incident energy EI, the reflected energy ERand the transmitted energy ETcan be calculated from the incident wave σi(t), the reflected wave σr(t) and the transmitted wave σt(t) as follows:

where, ρeCeis the wave impedance of the elastic bar and τ is the duration of stress wave.Based on the energy conservation law, the total energy dissipation, EA, is expressed as

The breakage energy dissipation (BED) shares a main proportion (about 90%) in the total energy dissipation [Zhang, Sun, Hao et al. (2000)], thus the friction energy between the elastic bars and sample, the kinetic energy of fragment and others (such as thermal energy and sound energy) can be neglected [Li, Mao, Lu et al. (2014)]. That is, BED is approximately equal to EA.
To reduce the effect of sample size, the BED density (i.e., energy dissipation per unit volume) is defined as


The cumulative BED density is then calculated by in which, Vsis the sample volume; n is the impact number. The cumulative BED density(ω) is just the total BED density (ϖ) when n is equal to the total number of repeated impacts (N).
2.4 Scheme of repeated impact
Three velocities are pre-designed for the repeated impact compression tests on the granite.The first impact velocity is V0=12.0 m/s, the second impact velocity is V0=15.0 m/s and the third impact velocity is V0=18.0 m/s. The granite samples were heat-treated at the temperature of 20°C, 200°C, 400°C and 600°C, respectively. For each treatment temperature and impact velocity, 3-5 samples were tested to ensure at least three effective data. To achieve the repeated impacts with constant amplitude under the same velocity,the pressure and the position of projectile in the pressure chamber keep unchanged. This can ensure the same energy of the incident waves. In order to eliminate the dispersion effect of the incident wave and to achieve uniform stress state in the loading direction of the samples as early as possible, a soft rubber with the diameter of 10 mm and the thickness of 3 mm was adopted as pulse shaper [Frew, Forrestal and Chen (2002)].Meanwhile, both ends of the sample were smeared with vaseline to guarantee that the sample could be in full contact with the elastic bars.
Fig. 3(a) shows the incident, reflected and transmitted waveforms shaped with soft rubber pulse shaper. Each impact has almost the same amplitude and duration of the incident wave, thus the purpose of repeated impact with constant amplitude is basically achieved.Fig. 3(b) shows the typical dynamic stresses on both ends of the sample during impact loading. It can be seen that the sum of incident and reflected waves well match with the transmitted wave before the peak point is reached. This meets the requirement of stress equilibrium on both ends of the sample. Consequently, the test results in this study are reliable and valid.


Figure 3: Typical waveforms and dynamic stresses on both ends of sample
3 Analysis of thermal damage characteristics
3.1 XRD and XRF analysis
Fig. 4 presents the X-ray spectra of the heat-treated granite samples at different temperatures. The main minerals in the granite are recognized as quartz, microcline,plagioclase, and biotite. The mineral composition of the granite kept unchanged with the increase of treatment temperature. In addition, no other minerals appeared during the whole heating treatment.


Figure 4: X-ray diffraction spectra of samples heat-treated at different temperatures
The results of X-ray fluorescence spectrometer in Fig. 5 show that the main oxides hardly change with temperature. This indicates that the fracturing of covalent bonding or metallic bonding has not yet taken place. It may be inferred that the crystal structure and chemical composition of the main minerals were relatively stable as the treatment temperature increased from 20°C to 600°C.
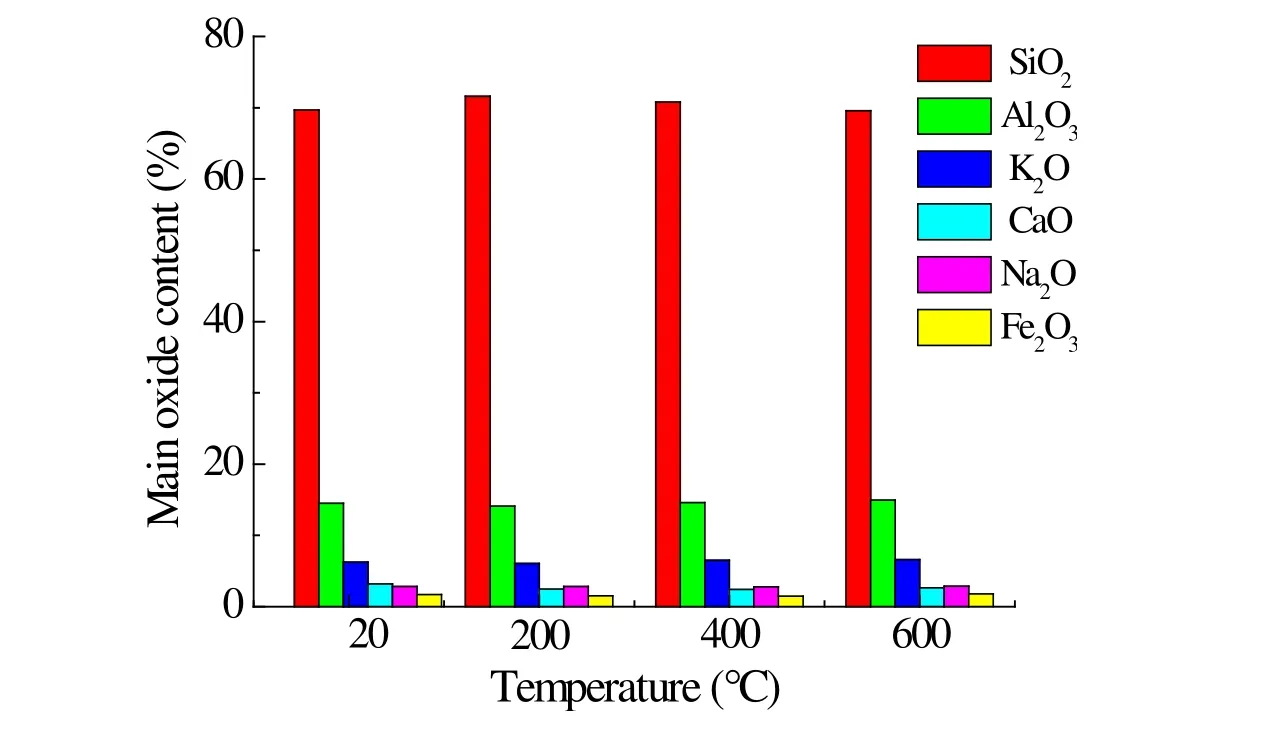
Figure 5: Variations of mineral element content of granite with treatment temperature
3.2 SEM study
Fig. 6 shows the microscopic images of rock samples at different treatment temperatures.There were randomly distributed flaws (microcracks and microvoids) in the sample at room temperature of 20°C (see Fig. 6(a)). According to Fig. 6(b), the number of microcracks and microvoids did not increase or even decreased in the sample after 200°C treatment (or,simply, the 200°C sample). This is because the expansion of mineral grains results in crack/void closure, improving the contact between internal particles [Huang, Yang, Tian et al. (2017); Ding, Ju, Song et al. (2016)]. Compared with the 200°C sample, the width of cracks in 400°C sample increased slightly (Fig. 6(c)). It is due to the damage of mineral crystalline structure owing to the loss of constitution water and crystal water [Zhang, Sun,Hao et al. (2016)]. As for the 600°C sample, the cracks coalesced and its width increased significantly (e.g., Fig. 6(d)). The destroy of mineral framework and phase transition of quartz [Glover, Baud, Darot et al. (1995)] contributed to this phenomenon.

Figure 6: SEM observations of granite after different high-temperature treatments
4 Analysis of strength and deformation characteristics
The basic parameters of representative samples in the tests are listed in Tab. 1. T1, T2, T3and T4denote that these samples were treated at 20°C, 200°C, 400°C and 600°C,respectively. The -1, -2 and -3 represent the first impact velocity (12.0 m/s), the second impact velocity (15.0 m/s), and the third impact velocity (18.0 m/s), respectively. For the same heat-treated samples, the total number of repeated impacts (N) decreases with the increase of impact velocity. Under the same impact velocity, the total number of repeated impacts is the largest for the 200°C sample and the smallest for the 600°C sample.However, the samples after 20°C and 400°C treatments have very close total number.Therefore, both impact velocity and treatment temperature control the N value of the sample. The longitudinal wave velocity is more sensitive with the increase of temperature.As seen in Tab. 1, the longitudinal wave velocity gradually shows a decrease along with the rising temperature.

Table 1: Parameters and test results of rock samples
4.1 Shape of repeated impact stress-strain curve
The stress-strain curves under repeated impacts with different velocities are shown in Fig.7 for the 400°C treated sample. This figure shows that both peak stress and peak strain(the maximum strain on the stress-strain curve) of the sample at the 1stimpact increase with the increase of impact velocity. It is observed that stress-strain curves vary with velocity and exhibit a significant loading rate effect. The stress-strain curves at the 1st-9thimpacts gradually rise under the impact velocity of 12.0 m/s. Further, the stress-strain curves gradually move to the right with impact number (see Fig. 7(a)). However, the peak stress and the elastic modulus at the 11thimpact are still greater than that at the 1stimpact.This indicates that the repeated impacts under low impact velocity do not cause the significant damage of rock. This is probably because the applied load does not reach the crack initiation stress threshold [Eberhardt, Stead and Stimpson (1999)]. Under the impact velocity of 15.0 m/s, the stress-strain curves rise during the initial impacts, and then gradually move to the right, see Fig. 7(b). The peak stress and the elastic modulus increase first and then decrease. The stress-strain curves do not appear to rise under the impact velocity of 18.0 m/s, which reflects the constant deterioration of rock strength.

Figure 7: Stress-strain curves of the same temperature treatment samples under different impact velocities
The dynamic stress-strain curves of the samples after 20°C and 200°C treatments show the similar characteristics with impact velocity. The total number of repeated impact of the 600°C treated sample under the impact velocity of 12.0 m/s is 3, while the corresponding impact numbers of the samples after 20°C, 200°C and 400°C treatments are 18, 24 and 12, respectively. It indicates that the damage of the 600°C treated sample increases rapidly and the crack initiation stress threshold is significantly lower than those of the 20°C, 200°C and 400°C treated samples.
The stress-strain curves of the heat-treated samples under the striking velocity of 15.0 m/s are shown in Fig. 8. Combined with Fig. 7(b), the stress-strain curves of the samples after 20°C, 200°C, and 400°C treatments are similar. Their stress-strain curves rise firstly and then move to the right with the increase of impact number. However, the stress-strain curves of the 600°C treated sample are obviously different. With an increase in impact number, the stress-strain curves shift rightward and no rising phenomenon is observed.The averaged strain rate (the ratio of the strain at peak stress to the time required to reach the peak stress) is also significantly larger than those of the other three. These differences indicate that the treatment temperature has significant effects on the responses of sample under repeated impacts.

Figure 8: Stress-strain curves of different temperature treatment samples under the same velocity
4.2 Variation of peak stress, peak strain and elastic modulus
The analyses of both reliability and long-term stability of rock engineering are closely tied to the structural safety and damage. Therefore, the mechanical properties of rock structures under high temperature and high loading rate conditions have become a focus in practical engineering. The peak stress of the samples after different temperature treatments changes with impact number. Fig. 9(a) shows this change when the striking velocity is 15.0 m/s. The peak stresses of the samples after 20°C, 200°C, and 400°C treatments increased firstly and then decreased with the increase of impact number. The compaction effect in the first several impacts makes the peak stress increase, while the impact-induced damage softening effect in the later impacts makes the peak stress of the sample be continuously reduced until failure. The peak stresses of the samples after 20°C and 400°C treatments have similar trends, whose peak stress increases at the 2ndimpact.The peak stress of the 200°C treated sample shows an increasing trend at the 1st-5thimpact. However, the peak stress of the 600°C treated sample is significantly smaller than those of the other three at the 1stimpact. No increase is observed in peak stress, showing faster deterioration characteristics of strength.

Figure 9: Variation of mechanical parameters during repeated impact
The peak strains of the samples after 20°C, 200°C and 400°C treatments are slightly reduced at the initial impacts, as shown in Fig. 9(b). The reason is that the compaction effect counteracts or even outstrips the damage softening effect, resulting in the closure of partial microcracks and the enhancement of sample densification. With an increase in impact number, the damage softening effect plays a dominant role and leads to the gradual increase of peak strain. The peak strain of the 600°C treated sample is obviously larger than those of the other three and increases with the increase of impact number. This indicates that the damage-softening effect is dominant during the whole repeated impacts and the compaction has little effect.
The secant slope between the two points on the ascending section of stress-strain curve is taken to calculate the elastic modulus of sample as [Liu and Xu (2015)]

where σ1and σ2are the stresses equal to 40% and 60% of the peak stress, respectively,while ε1and ε2are the corresponding strains.
The elastic modulus of the heat-treated samples with impact number under the velocity of 15.0 m/s is shown in Fig. 9(C). The difference among the elastic moduli of the 20°C,200°C, and 400°C samples is not significant at the 1stimpact, but the elastic modulus of the 600°C treated sample is much lower than those of the other three. This indicates that the deformation resistance of the 600°C treated sample reduces greatly [Wang and Hao(2017)]. For the samples after 20°C, 200°C, and 400°C treatments, the elastic moduli increase at the initial impacts due to compaction, and then decrease because of the damage-softening effect. Being different from the other three, a rapid decline is observed in the elastic modulus of the 600°C treated sample. This shows a significant weakening phenomenon induced by temperature. It is obvious that the elastic modulus of the 200°C treated sample decreases slowest compared to the other samples.
The variations of average peak stress, peak strain and elastic modulus with treatment temperature are shown in Fig. 10. It is seen that the average peak stress and elastic modulus increase slightly at the temperature of 200°C, and then decreases as the temperature rises. The average peak strain shows a contrary trend, and its value at 600°C increases by 100.6% compared to that at 20°C.

Figure 10: Variations of average mechanical parameters as a function of heat treatment temperature
5 Analysis of energy dissipation characteristics
5.1 Effect of loading rate on energy dissipation
Fig. 11 shows the relationship of total BED density (ϖ) with impact velocity. The total BED densities of the samples after 20°C, 200°C and 400°C treatments under the impact velocity of 12.0 m/s are greater than those under the impact velocities of 15.0 m/s and 18.0 m/s. The previous analysis of stress-strain curves shows that no obvious damage is observed in the samples heat-treated at 20°C, 200°C, and 400°C under the impact velocity of 12.0 m/s. It is due to the small applied stress. However, the dissipated energy during the repeated impacts is mainly used for the accumulation of internal damage of rock. This means that a larger total BED density does not necessarily represent the increase in rock damage. Therefore, it is not completely accurate to measure the internal damage of sample by using the total BED density under the condition of repeated impact loading.

Figure 11: Relationship of total BED density with impact velocity
In order to accurately reflect the effect of loading rate on energy dissipation, the averaged BED density (ϖN), the ratio of total BED density to the total number of repeated impacts) is adopted herein. Fig. 12 shows the change of the averaged BED density with impact velocity for all samples. The averaged BED density increases with the increase of impact velocity. Although the total BED densities of the 20°C, 200°C and 400°C samples under the impact velocity of 12.0 m/s are larger, their averaged BED densities are smaller than those under the impact velocities of 15.0 m/s and 18.0 m/s because of more impact number. From the perspective of damage, a crack initiation stress threshold may exist for the sample after each thermal treatment. Similarly, an energy threshold may exist for the heat-treated sample accordingly because the dissipated energy is mainly used for the increase of internal damage of rock. That is to say, even though the total BED density of the sample is larger, the repeated impact does not cause a significant increase of internal damage to sample when the energy dissipation of the sample under a single impact is less than its energy threshold. On the contrary, the internal damage continues to increase until failure and the total BED density of the sample increases with the increase of impact velocity.

Figure 12: Relationship of average BED density with impact velocity
Being different from the samples after 20°C, 200°C and 400°C treatments, both total and averaged BED densities of the sample after 600°C treatment increase with the increase of impact velocity. It is also noted that the crack initiation stress threshold of this sample is lowest and its internal damage increases under the impact velocity of 12.0 m/s. Therefore,the BED density of the 600°C treated sample under the impact velocity of 12.0 m/s is greater than its energy threshold, which results in an increase in the total BED density and a corresponding decrease in total number of repeated impacts with the increase in impact velocity.
The total BED density increases with the increase of impact velocity after the heat-treated samples reach their respective energy thresholds. At the same time, the larger the total BED density, the larger the amount of damage is. As shown in Figs. 13(a) and 13(b), the sample after 200°C treatment exhibits an axial splitting failure under the velocity of 15.0 m/s and a mixed failure mode of axial splitting and crushing under the velocity of 18.0 m/s. The final damage degree of the 600°C treated sample also increases with the increase of impact velocity, as shown in Figs. 13(c) to 13(e). Its failure mode is an axial splitting under the impact velocity of 12.0 m/s and a mixed failure mode under the impact velocities of 15.0 m/s and 18.0 m/s. However, the pieces and debris increase significantly with a more serious failure degree under the impact velocity of 18.0 m/s compared to the impact velocity of 15.0 m/s. When the velocity continues to increase, the BED density increases, the damage degree of sample becomes severer, and the corresponding gradation of fragments is better [Hong, Zhou, Yin et al. 2009].

Figure 13: Failure modes of heat-treated samples under different impact velocities
5.2 Effect of temperature on energy dissipation
Fig. 14(a) shows the relationship of BED density (EV) with the impact number under the velocity of 15.0 m/s. Because the compaction effect results in the closure of partial microcracks, and the mechanical properties are enhanced to some extent and the EVvalues of the samples after 20°C, 200°C and 400°C treatments at the 2ndimpact are smaller than those at the 1stimpact, and then increase with an increase in impact number.The continuous impacts lead to constant accumulation of internal damage of the samples.For the same impact number, the BED density of the 600°C sample is significantly greater than those of the samples after 20°C, 200°C and 400°C treatments. No downward trend is observed in the curve.
Fig. 14(b) shows the change of the cumulative BED density (ω) with impact number under the velocity of 15.0 m/s. For the same impact number, the sample has the smallest ω after 200°C treatment and the largest ω after 600°C treatment. Under the same incident energy and impact number, a greater cumulative BED density implies a lower energy transfer efficiency. This means that more energy is dissipated by the sample for the initiation and growth of internal cracks. This is confirmed by the macroscopic morphology of the samples after different temperature treatments at the 2ndimpact (see Fig. 15). After the 2ndimpact, the longitudinalbut not penetrating crack appears at the lateral sides of the 20°C and 400°C treated samples. There are no visible cracks at the ends of the 200°C treated sample, but the 600°C treated sample is noticeably damaged after the 2ndimpact with a small amount of pieces and debris.Under the same impact velocity, the total BED density (ϖ) reflects the difficult or easy degree of sample failure. Tab. 1 and Fig. 14(b) show that the total BED density of the 200°C treated sample is the largest, which is 3.53 times and 3.17 times that of the samples after 20°C and 400°C treatments, respectively. This indicates that the initiation and growth of cracks of the 200°C treated sample is more difficult. It has a stronger resistance to repeated impact, illustrating a significant microcrack restoration/healing effect. The value of the 600°C treated sample is the smallest which is only 24% that of the 200°C treated sample. This is because the heat treatment of 600°C results in a decrease in cohesion between the minerals and the evolution of internal damage becomes easier, which can be proved from the experimental results of SEM.

Figure 14: Evolution of BED density and cumulative BED density during repeated impact

Figure 15: Failure modes of heat-treated samples at the 2nd impact
6 Conclusions
In this study, the thermal damage characteristics of Huashan granite before dynamic loading were experimentally analyzed, and the repeated impact tests with a modified SHPB device were carried out on the heat-treated granite samples. The effects of loading rate and treatment temperature on the dynamic stress-strain curves and energy dissipation characteristics of the samples were studied. Following conclusions are drawn based on these studies:
(1) The mineral composition and main oxides of the granite do not change with the increase of treatment temperature. The number of microcracks and microvoids decreases in the 200°C treated sample. The cracking in the 400°C treated sample increases significantly, and many opening cracks can be detected in the 600°C treated sample.
(2) Compared to the samples after 20-400°C treatments, the 600°C treated sample has a lower crack initiation stress threshold and exhibits faster deterioration of mechanical properties. This shows a significant temperature weakening phenomenon. A critical temperature is found to be in the range of 400°C to 600°C for the tested granite.
(3) Each heat-treated sample has an energy threshold. When the energy dissipation under a single impact is lower than this threshold, the damage induced by repeated impacts is not significant though its total BED density is larger. The averaged BED density can well characterize the effect of loading rate on energy dissipation and sample damage.
(4) Under the same impact number, the cumulative BED density of the 600°C treated sample is the highest and the sample is most easily damaged. For a fixed impact velocity,the total energy BED density of the 200°C treated sample is the largest, which has a strong resistance to repeated impact loading, showing a significant restoration/healing effect of microcracks.
Acknowledgments:This study was financially supported by the National Natural Science Foundation of China (51579062, 51379147), which is gratefully appreciated.
 Computers Materials&Continua2019年4期
- Computers Materials&Continua的其它文章
- A Credit-Based Approach for Overcoming Free-Riding Behaviour in Peer-to-Peer Networks
- Image Augmentation-Based Food Recognition with Convolutional Neural Networks
- Artificial Neural Network Methods for the Solution of Second Order Boundary Value Problems
- DPIF: A Framework for Distinguishing Unintentional Quality Problems From Potential Shilling Attacks
- Color Image Steganalysis Based on Residuals of Channel Differences
- Rayleigh-Type Wave in A Rotated Piezoelectric Crystal Imperfectly Bonded on a Dielectric Substrate