
Maximum Inner Product Method for Extracting the Path-Loss Parameters in Primary Transformer Substations
2019-04-22 03:30:28QiangLiHongxinZhangTianyiZhengXueliWangYinghuaLv
China Communications 2019年4期
Qiang Li,Hongxin Zhang, *,Tianyi Zheng,Xueli Wang,Yinghua Lv
1 School of Electronic Engineering,Beijing University of Posts and Telecommunications,Beijing 100876,China
2 Beijing Key Laboratory of Work Safety Intelligent Monitoring,Beijing 100876,China
3 School of Sciences,Beijing University of Posts and Telecommunications,Beijing 100876,China
Abstract: In order to deploy short-range wireless communication devices in the primary transformer substation,a Maximum Inner Product (MIP) Method is proposed to extract the path-loss parameters in 110kV and 220kV primary transformer substations.The maximum inner product of the testing data is calculated to find out the loss index n and the standard deviation σ,and then the pathloss models can be set up.By comparing the MIP with Minimum Mean Square estimation (MMSE) and Cumulative Sum (CUSUM),MIP can match the measured values best.In order to apply the MIP path-loss model,under the initial signal to noise ratio (SNR) at 5 dB and 10 dB,a ZigBee simulation system is constructed to validate the situation that bit error rate (BER) varies with distance.And the Zig-Bee devices with 5 units are tested in a 220kV primary transformer substation.The result of the test proves that the path-loss model is accurate.
Keywords: primary transformer substation;path-loss;ZigBee
I.INTRODUCTION
The smart grid was put forward at the beginning of the 21st century.In order to realize the fast and convenient communication in the smart grid,the wireless devices must be adopted as the end of the information awareness [1].However,the electromagnetic environment in primary transformer substation is very complex.Wireless sensor unit placed in the primary transformer substation will be affected by different degrees of electromagnetic interference.This influence will make communication appear error or packet loss phenomenon,even may cause the interruption of communication [2-5].
Wireless sensor network has been widely used at 430 MHz,470 MHz,and 2.4 GHz frequency bands.There are not enough effective evaluation model and analysis method of the application of the complex electromagnetic environment in the power system [6-9].Otherwise,the curves acquired with the traditional methods,such as MMSE,CUSUM and so on,could not meet the measured result perfectly.The disadvantage of MMSE is that the residual of the estimated value and sample value cannot guarantee equal to zero [10].The disadvantage of CUSUM is that it is difficult to fit sudden large deviation [11,12].So we propose a new method to calculate the pathloss parameters.
In this paper,the maximum inner product algorithm is proposed to model the path loss in the substation.The value of the loss indexnand the standard deviation σare changed within a certain range and the received power is calculated.By calculating the inner product of the measured power and the calculated power,and find the maximum value of the inner product,the optimum path loss indexnand standard deviation σare obtained.The algorithm traverses the loss indexnand the standard deviation σ,and compared with the traditional method,it can ensure that the loss indexnand the standard deviation σare the best.
The structures of this paper are as follows.In section 2,the measurement methods of wireless channel are described briefly.In section 3,the theory of path-loss modeling is introduced and the MIP method is deduced.In section 4,we use MIP,MMSE and CUSUM to set up the path-loss model of 430 MHz,470 MHz and 2.4 GHz in 110 kV and 220 kV primary transformer substations,and compare the measurement data with the results of three different methods.In section 5,taking ZigBee system for example,the relationship of BER varies with distance are simulated in two cases of the initial SNR at 5 dB and 10 dB respectively using the MIP model,and the ZigBee system with 5 units is tested in 220kV primary transformer substation.In section 6,we draw a conclusion and give some advice about the short-range wireless communication devices decorated in the primary transformer substation.
II.MEASUREMENT SCHEME
The wireless channel measurement can be divided into three methods: direct pulse measurement,spread spectrum sliding correlator measurement,and frequency domain measurement [13].The disadvantage of direct pulse measurement is that the synchronization request of source and receiver is very high [14,15].The disadvantage of spread spectrum sliding correlator measurement is that it is more complex for circuit implementation technology [16-18].The characteristic of frequency domain measurement is simple and feasible,the frequency domain response of the whole band can be got by means of frequency sweep [19-22].In this paper,the frequency domain measurement method is adopted.
110 kV and 220 kV primary transformer substations are chosen in a certain city to conduct the measurement.The measurement point layout is shown in figure 1.
Ten points are set at each substation showing in figure 1,the point 1 to point 10 are receiving antenna places,each point is three meters apart.
Transmitting devices are placed in the communication room of the primary transformer substation shown in figure 2.The transmitting antenna is 1.5 meters high apart from the ground.
The transmitting devices are composed of the signal source and antennas.AV1441A radio frequency signal source is used to generate transmitting signals with 0 dBm power and 2.4 GHz monopole antenna and 200 MHz - 2 GHz log periodic antenna are used as transmitting antennas.
In figure 3,the receiving devices are placed near the main sensitive equipment in the primary transformer substation.The receiving antenna is 1.5 meters high apart from the ground and is 3 meters away apart from the sensitive equipment such as transformer,switcher etc.
Receiving devices are composed of N1996A spectrum analyzer produced by Keysight and log periodic antenna (DS-3300) produced by Ainfoinc Company,with the bandwidth coverage from 30 MHz to 3 GHz.
Because wireless communication has to be assigned different up and down channel,each channel needs a certain amount of bandwidth.The sweep frequency signal is transmitted instead of the actual communication signal.The power of sweep frequency signal is set as 0 dBm,and the frequency sweep is from 423 MHz to 435 MHz at 430 MHz frequency band with the step interval as 240 kHz;455 MHz to 475 MHz at 470 MHz frequency band with the step interval as 200 kHz;and 2.395 GHz to 2.485 GHz at 2.4 GHz frequency band with the step interval as 5 MHz.As shown in fi gures 4 and 5 are the receiving power of different spectrums at the third survey site in 110 kV and 220 kV primary transformer substations.
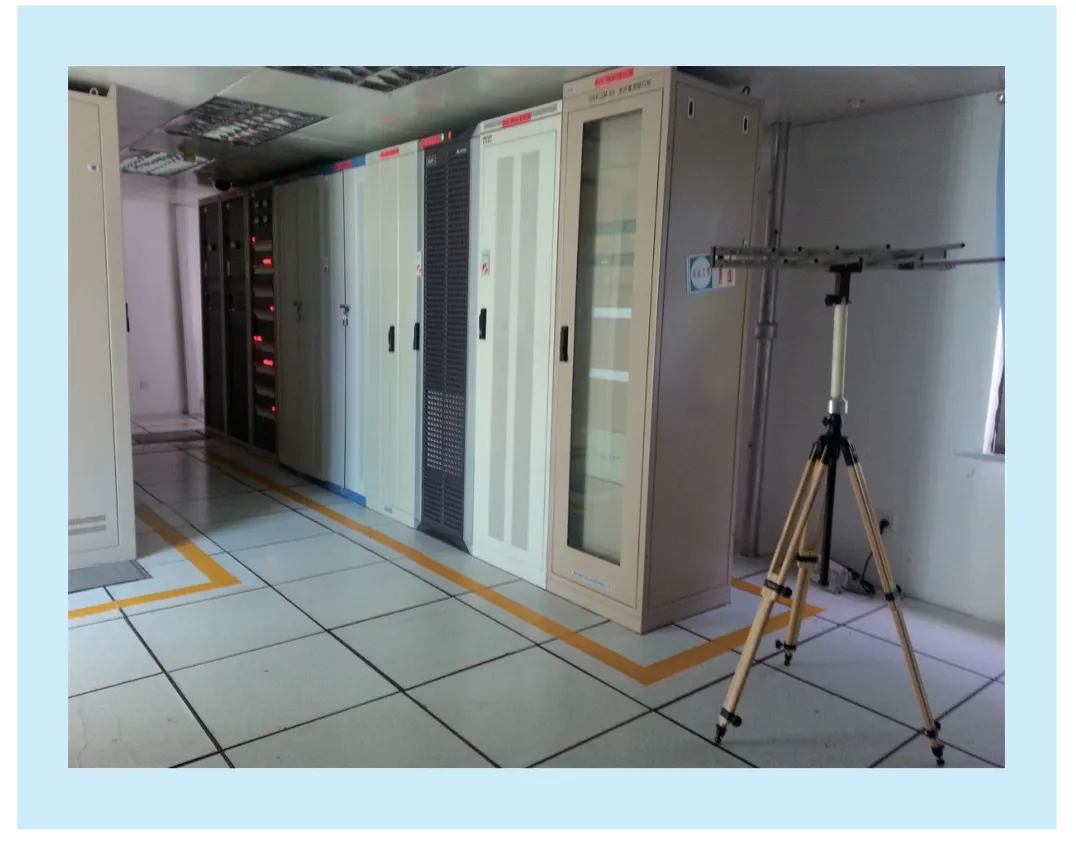
Fig.2.Transmitting antenna in the communication room.
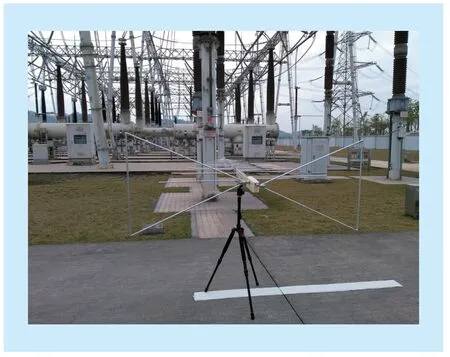
Fig.3.Receiving antenna in the primary transformer substation.
III.PATH-LOSS MODELING
The commonly used path loss models are 3GPP and winner models and logarithmic distance models.The 3GPP and winner models use a three-parameter floating-intercept [Alpha-Beta-Gamma (ABG)] large-scale path loss model,which lacks fixed physical meaning due to its widely varying (fl oating) modeling parameters [23].The logarithmic distance path loss model is superior to the ABG model in terms of stability and prediction accuracy and is suitable for outdoor environments [23,24].Therefore,the logarithmic distance path loss model is used in this paper,and the formula [25,26] is:

In the formula,nis the path-loss index,which indicates the path-loss rate with the increase of distance.It relates to the surrounding environment and building shape [10,13];Xσis Gaussian random variable with zero mean and the standard deviation is σ;PL(d) is the path-loss between the transmitting site and the receiving site,and the unit is dB;dis the distance between the transmitting and the receiving antenna;d0is the distance between the transmitting antenna and the reference site;PL(d0) is the loss value at the reference site.PL(d0) can not only be obtained by measurement but also can be determined by using the free space loss formula:

In the formula,λ=c/f,that is,the wavelength of the electromagnetic wave λ equals the speed of lightcdivided by frequencyf.The fi rst measurement point is set as the reference site,the distance between the transmitting antenna and the reference sited0is equal to 3 m.
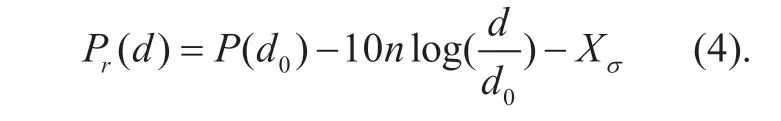
SupposePtis the power of the transmitted signal;Pris the power of receiving signal;P(d0) is the power of receiving signal at the reference site,then:
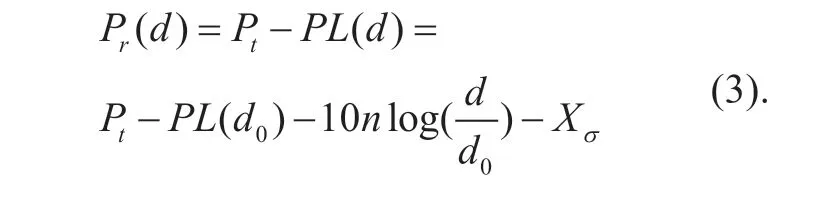

Fig.4.Receiving power at 3rd survey site in 110 kV primary transformer substation.

Fig.5.Receiving power at 3rd survey site in220 kV primary transformer substation.
Suppose the power of receiving signal at reference site isPt-PL(d0)=P(d0),Pr(d) can be expressed as:
It is not possible to directly obtain the loss indexnand standard deviation σ by the measuring instrument,usually,it needs to use the parameter estimation method based on measuring data.This paper calculates the inner product of test data and estimation data and then find out the loss indexnand standard deviation σwhich are associated with the maxi-mum inner product.
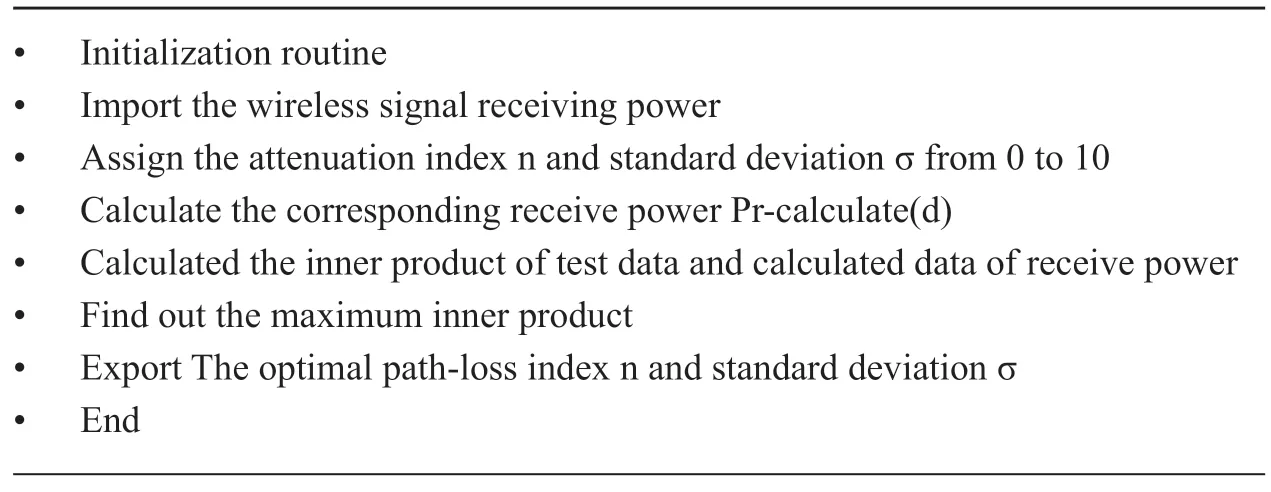
Table 1.MIP algorithm.
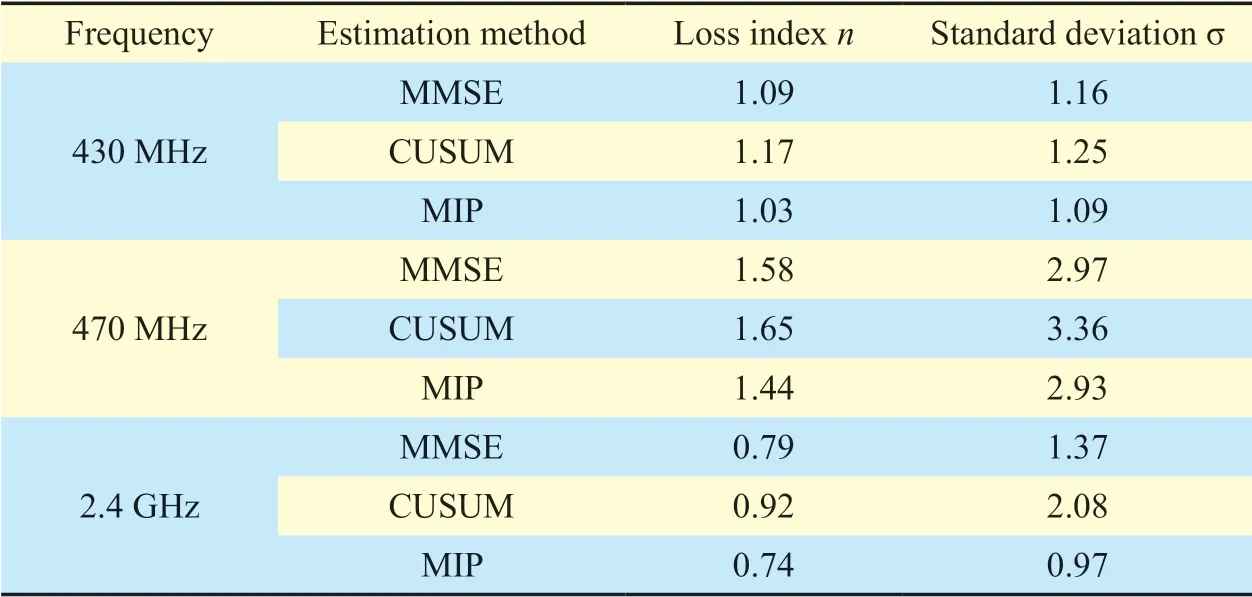
Table II.110 kV primary transformer substation parameters data.
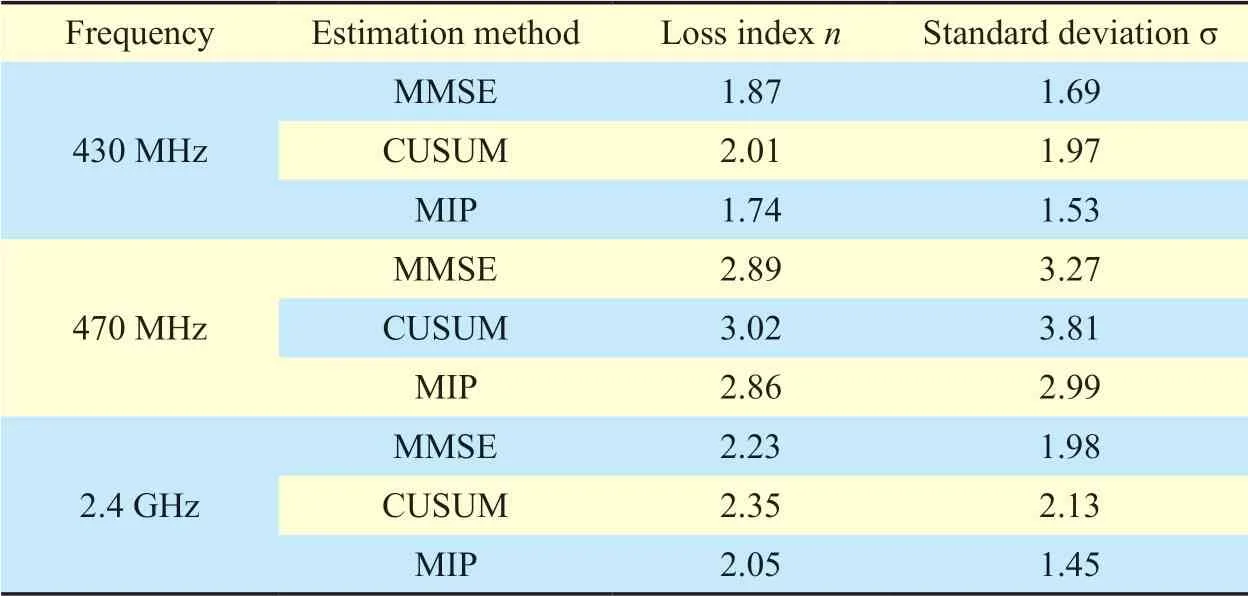
Table III.220 kV primary transformer substation parameters data.
The measurement data are denoted as Pr-mea-sure{Pr-measure(3),Pr-measure(6),……,Pr-measure(d)},wheredis the distance between transmitting antenna and receiving antenna,we measure a point every 3 meters,sod=3,6,……,30.
Normally,loss indexnranges from 2 to 5 [27],and standard deviation σranges from 4 to 10 [28].To find the bestnand σ,we expand the search range,the values ofnand σare in the range of 0 to 10,respectively.
The value of indexnand standard deviation σ is changed from 0 to 10 respectively,whose step value is set as 0.01,and use the receiving power model as formula (4) to calculatePr-calculate.
For each change in loss indexnor standard deviation σ,the receiving power is calculated once time as follows:

Take distancedequals to 3,6,……,30.Arrange thePr-calculate(d)in ascending order of distance,and form a vector: Pr-calculate{Pr- calculate(3),Pr- calculate(6),……,Pr- calculate(30)}.
Then,we normalize Pr-calculateand Pr-measureto P*r-calculateand P*r-measure,and calculate the maximum inner product of them.

Because
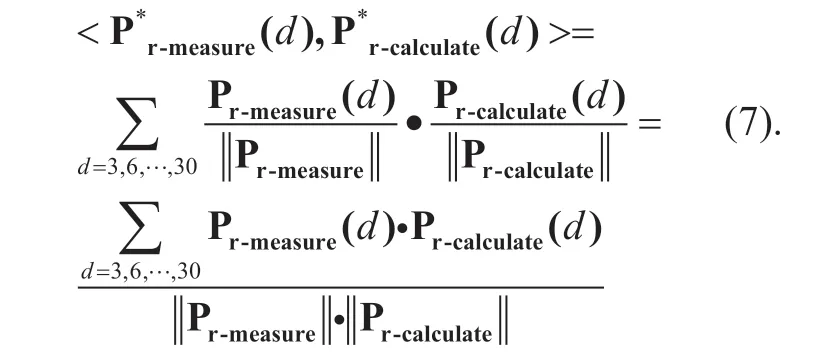
We can see that the normalized inner product is equal to the cosine of the angle between the two vectors.The bigger the cosine is,the more similar the two vectors are [29].So the optimal loss indexnand standard deviation σ can be find out.
The flow chart of the algorithm is shown in the table1 below.
IV.NUMERICAL RESULT
The path-loss parameters are extracted from the measurement data by using MIP,MMSE and CUSUM methods respectively.And calculate the loss indexnand standard deviation σas shown in table 2 and table 3:
Then the loss indexnand standard deviation σare taken into the path-loss model formula.The comparison of the measurement data discrete points and path-loss curves are shown in fi gure 6 and fi gure 7:
We can see from the curves shown in figures 6 and 7,there are some differences of path-loss calculated by the MIP compared with MMSE and CUSUM methods.And the MIP's result meets the measurement data best,especially in the model of 2.4 GHz in 220 kV primary transformer substation.
In order to compare those methods,the deviation ratio of sample value and the estimated value is defi ned as follow:

In the formula,sis the measured value,eis the estimated value.According to this formula,the MIP,MMSE,and CUSUM were compared,shown as in Figure 8 and 9.
The curves in fi gure 8 and fi gure 9 indicate the proportion of error to the measured value.It refl ects the deviation degree of estimation.The smaller the deviation degree is,the more accurate the estimated value is.Otherwise the faster the curves tend to 0,the better the method convergence is.
The curves in figures 8 and 9 indicate the deviation ratio changes with the distance of three methods.We can see the comparative result from the fi gures above,no matter which frequency of 430 MHz 470 MHz and 2.4 GHz,the MIP method is the best,and the deviation ratio of MIP method is the lowest.

Fig.6.The comparison of measurement data and the calculative curve in 110 kV primary transformer substation.
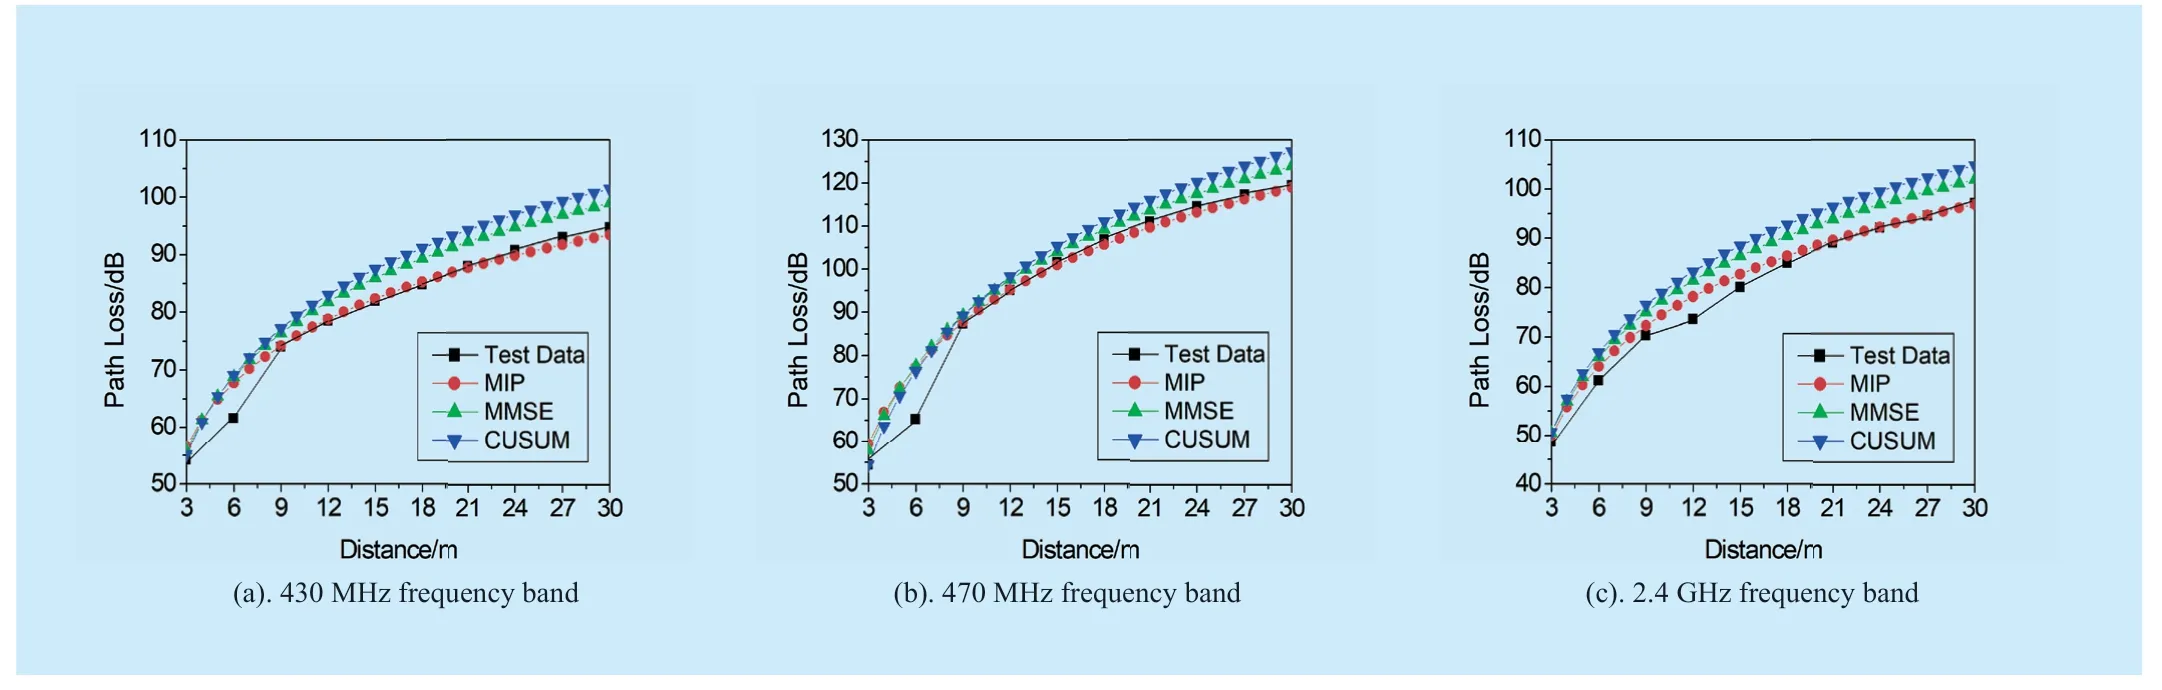
Fig.7.The comparison of measurement data and the calculative curve in 220 kV primary transformer substation.
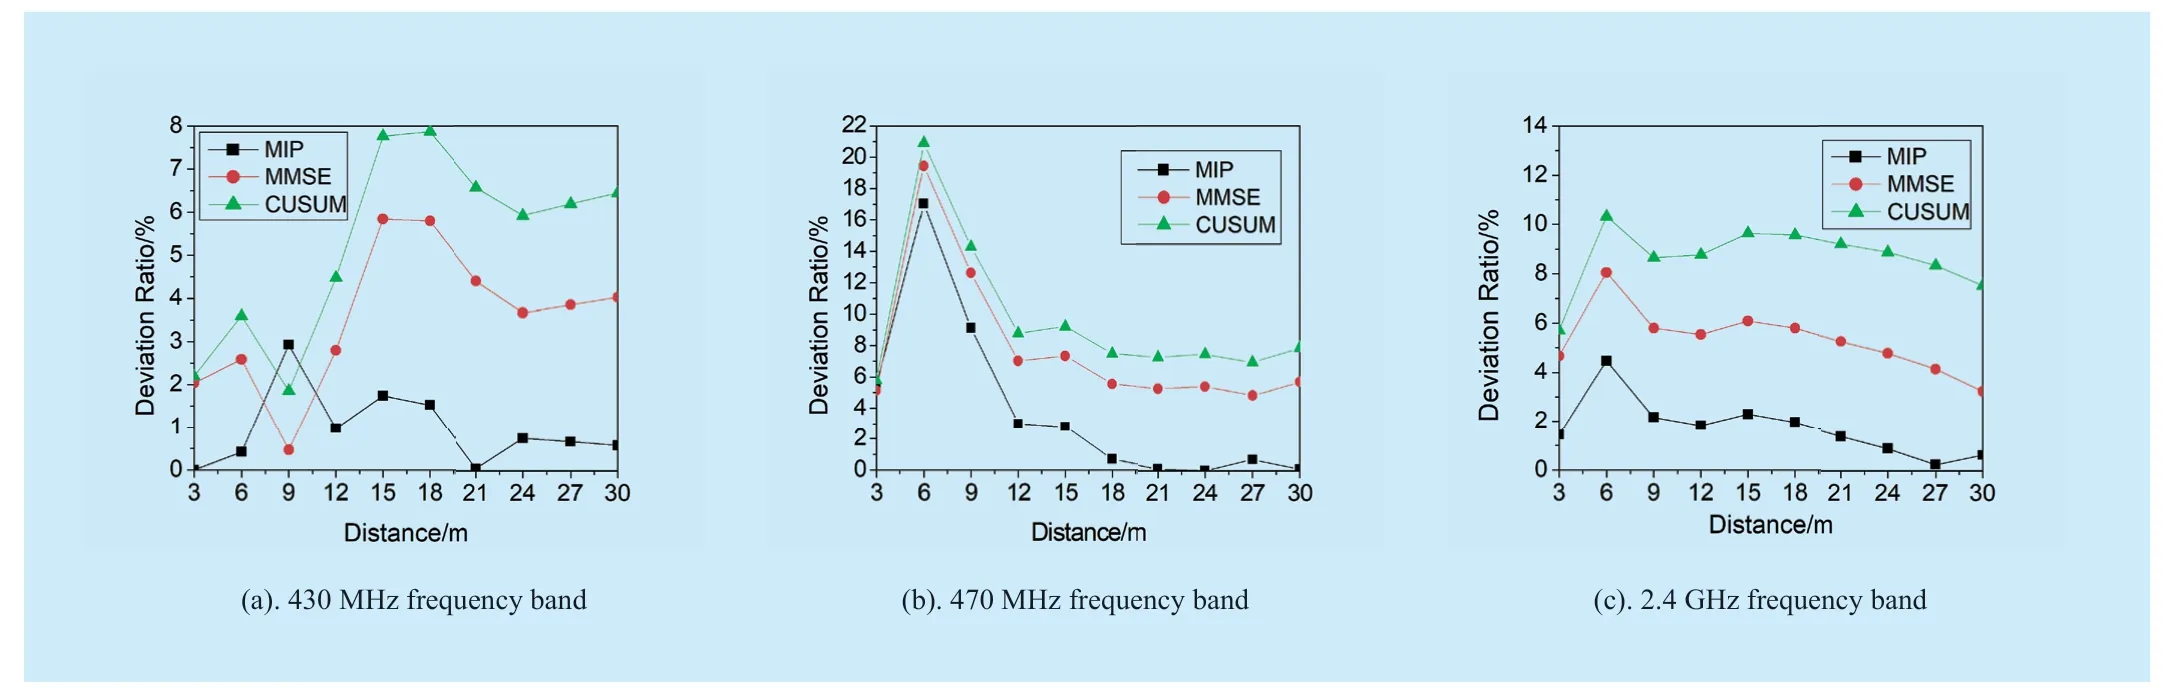
Fig.8.The comparison of deviation ratio in 110 kV primary transformer substation.
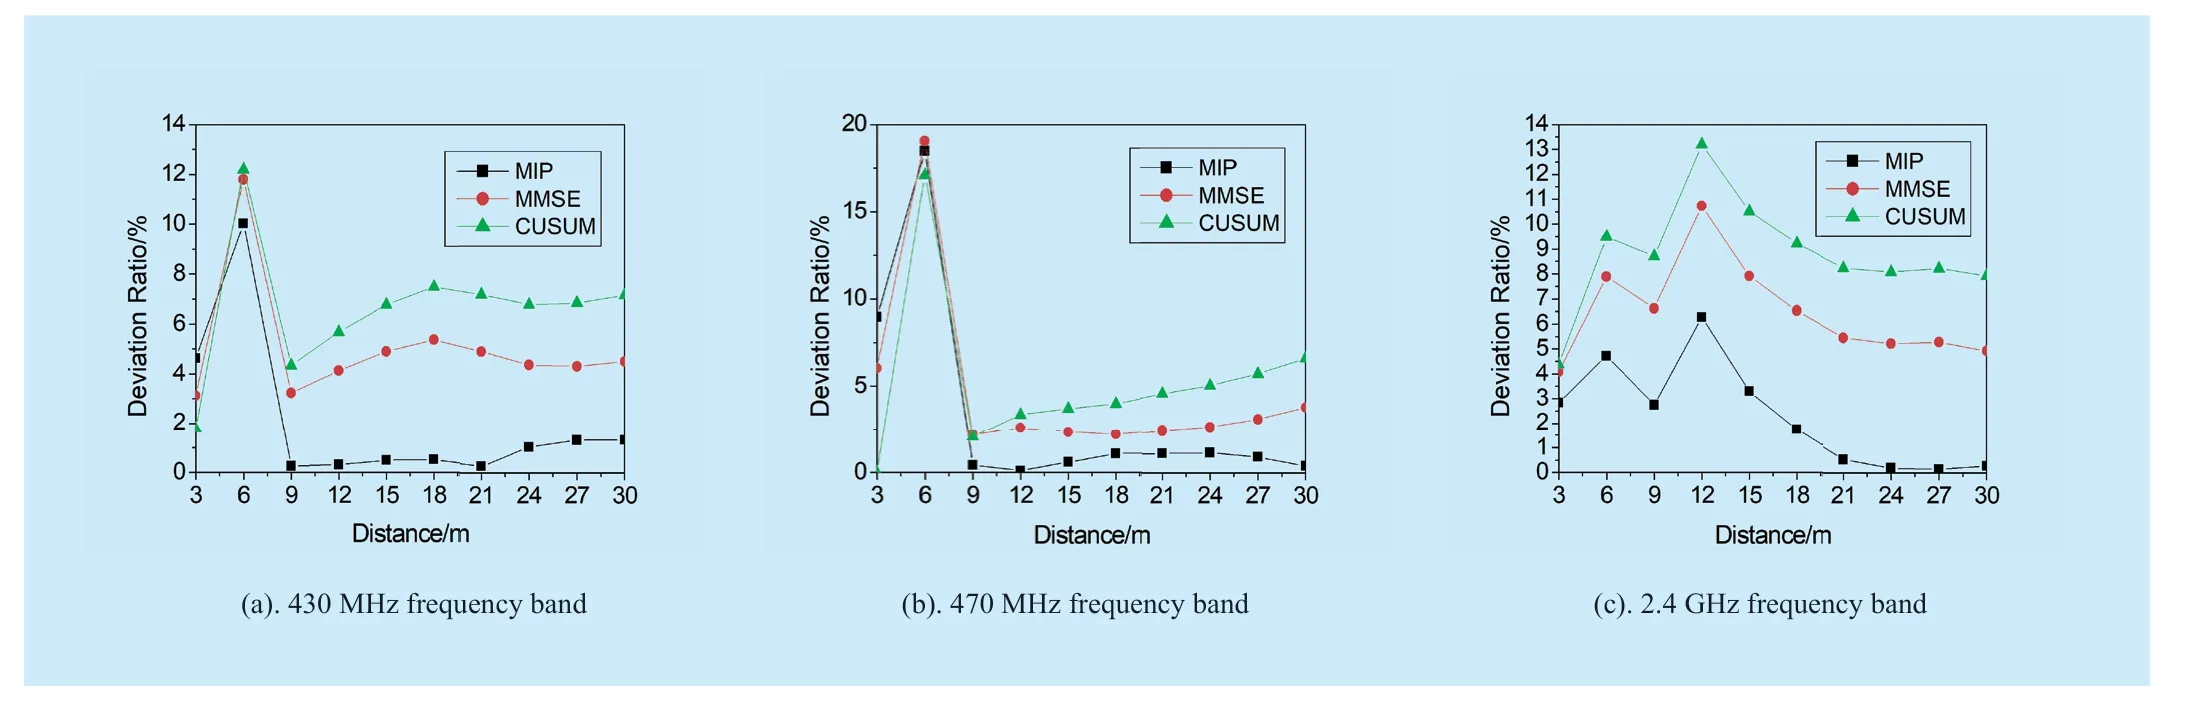
Fig.9.The comparison of deviation ratio in 220 kV primary transformer substation.

Fig.10.BER change with distance.
V.COMMUNICATION SIMULATION AND TEST
A ZigBee communication system is constructed which includes transmitter module,receiver module,and channel module.The transmitter power is set as 0 dBm,keep a steady noise and set initial SNR as 5 dB and 10 dB respectively.According to the path-loss model of 2.4 GHz above,the relationships are simulated which BER change with the distance in two SNR conditions,the curves are shown in fi gure 10 as follow.
We can see from the simulation result above.In the ideal channel conditions,the BER of the system will be increased with the distance increased sharply.Compare to both cases of initial SNR,which is 5 dB and 10 dB respectively,the greater the SNR is,the better the communication quality is.In other words,the higher the transmission power is,the farther the transmission distance is.But it is not clear to increase the transmit power for improving the communication quality when exceeding a certain distance.
A ZigBee system with 5 units is tested in 220 kV primary transformer substation.We set a star network which 4 ZigBee nodes in the corner of the primary transformer substation and one gateway node at the communication room.The deployment is as fi gure 11:
The transmit power of ZigBee is 4.5 dBm.The area of the primary transformer substation is 150 m × 100 m.The distance between Zig-Bee node at point 4 and gateway node at communication room is less than 180 m.In the test,the gateway at communication room can receive the signal from ZigBee at point 4,but the communication situation is intermittent,with high packet loss rate.From another way,the test results in the primary transformer substation which can prove the simulation of fi gure 10 is right,it is not clear to increase transmit power when exceeding a certain distance.The path-loss model has guiding signifi cance.
VI.CONCLUSION
This paper adopted frequency measurement method to get the path-loss data at 430 MHz,470 MHz and 2.4 GHz frequencies of 110 kV and 220 kV primary transformer substations in a certain city,and set up the path-loss models based on measurement data.A new method is proposed to calculate the loss index and the standard deviation.In the end,the path-loss parameters calculated by MIP,MMSE,and CUSUM were compared with the measurement data.The results show that the estimation values calculated by MIP could match the measurement data closely,and the deviation ratio is the lowest.
The electromagnetic environment of primary transformer substation is very complex.It is very important to set up the path-loss model,to estimate the coverage and to evaluate the performance of the communication system.This paper provides a research basis and guidance for decorated short-range wireless communication devices in the primary transformer substation.
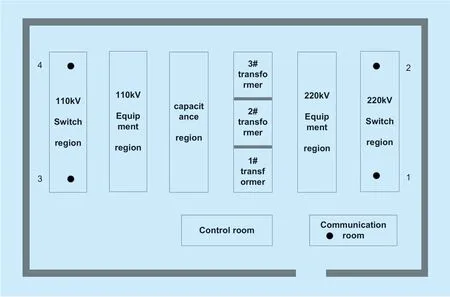
Fig.11.ZigBee test in 220 kV primary transformer substation.

Fig.12.ZigBee node at point 2.
ACKNOWLEDGMENTS
The authors would like to thank the scientifi c project supported by the National Natural Science Foundation of China (No.61571063) and supported by the Beijing Municipal Natural Science Foundation (No.3182028).

- China Communications的其它文章
- A Bandwidth-Link Resources Cooperative Allocation Strategy of Data Communication in Intelligent Transportation Systems
- UP-TreeRec: Building Dynamic User Profiles Tree for News Recommendation
- A Fuzzy Decision Based WSN Localization Algorithm for Wise Healthcare
- Bistable Stochastic Resonance Enhanced 4-ary PAM Signal Detection under Low SNR
- Tensor Completion for Recovering Multichannel Audio Signal with Missing Data
- A PCA-Based Internet Delay Space Dividing Algorithm