
A Novel Objective Quality Assessment Method for Video Conferencing Coding
2019-04-22 03:30:18ZhenyuGuanHanzhengLvYuanMaJingzeZhang
China Communications 2019年4期
Zhenyu Guan,Hanzheng Lv,*,Yuan Ma,Jingze Zhang
1School of Cyber Science and Technology,BeiHang University,Beijing 100191,China
2 School of Electronic and Information Engineering,BeiHang University,Beijing 100191,China
Abstract: Most recently,due to the demand of immersive communication,region-of-interest-based (ROI) high efficiency video coding (HEVC) approaches in conferencing scenarios have become increasingly important.However,there exists no objective metric,specially developed for efficiently evaluating the perceived visual quality of video conferencing coding.Therefore,this paper proposes a novel objective quality assessment method,namely Gaussian mixture model based peak signal-tonoise ratio (GMM-PSNR),for the perceptual video conferencing coding.First,eye tracking experiments,together with a real-time technique of face and facial feature extraction,are introduced.In the experiments,importance of background,face,and facial feature regions is identified,and it is then quantified based on eye fixation points over test videos.Next,assuming that the distribution of the eye fixation points obeys Gaussian mixture model,we utilize expectation-maximization (EM) algorithm to generate an importance weight map for each frame of video conferencing coding,in light of a new term eye fixation points/pixel (efp/p).According to the generated weight map,GMM-PSNR is developed for quality assessment by assigning different weights to the distortion of each pixel in the video frame.Finally,we utilize some experiments to investigate the correlation of the proposed GMM-PSNR and other conventional objective metrics with subjective quality metrics.The experimental results show the effectiveness of GMM-PSNR.
Keywords: visual quality assessment;perceptual conferencing video coding;immersive communication
I.INTRODUCTION
Nowadays,video conferencing becomes prevailing in immersive communication [1].It allows two or more locations [2] to communicate with each other by simultaneous two-way video and audio transmissions.Unfortunately,video conferencing applications,with a deluge of data,are causing bandwidth bottleneck.HEVC significantly reduces bit rates over the preceding H.264 standard but at the expense of extremely high encoding complexity [3].Although HEVC [4] offers a possible solution to overcome the bandwidth bottleneck,the demand of bandwidth for video conferencing applications at high resolutions (e.g.1920 × 1080,4k × 2k or even 8k × 4k1For video coding,4k × 2k and 8k × 4k stand for the ultra HD videos with the resolutions being 3840 × 2160 and 7680 × 4320,respectively.) has never been greater.It is because the ultimate goal of immersive communication is the natural experience of face-to-face meeting.In other words,video conferencing applications still pose the bandwidth-hungry challenge.In fact,there still remains much perceptual redundancy in video coding,as human attention does not focus on the whole scene,but only a small region of fixation called ROI region.Perceptual video coding [5] aims at reducing distortion in ROI regions at the expense of more quality degradation in the other regions.It thus offers an efficient solution towards bandwidth-hungry challenge by removing the perceptual redundancy to improve the coding efficiency of video conferencing,especially at high resolutions.A max-min optimization problem has been formulated and solved in an iterative way to address the problem of fairness-oriented precoding design [7].The outage performance in rain fading channel was studied and an efficient power allocation algorithm was proposed to address the issue of min-max fairness [8].
Visual quality metrics are indispensable in evaluating the coding efficiency of video conferencing sequences compressed by different video coding approaches [9].On the other hand,visual quality metrics can optimize perceptual video conferencing coding in turn.This was also pointed out by British Physicist William Thomson,as he said“If you cannot measure it,you cannot improve it”.So,visual quality metrics play a key role in perceptual video coding.Visual quality metrics for perceptual video coding may be classified into two categories [10]: either subjective or objective assessment.Since humans are the final ends of videos,subjective visual quality assessment is the most accurate and reliable way to evaluate video coding.Unfortunately,it requires extensive manual efforts to measure perceived visual quality.Such a kind of subjective assessment thus leads to low efficiency and high expense.On the contrary,objective visual quality metrics may be simple and practicable.The goal of objective assessment is improving the correlation with the visual quality perceived by human observers,in order to accurately measure visual quality.Most widely used objective metric is peak signalto-noise ratio (PSNR),which is based on the power of reconstruction errors.Objective visual quality assessment has seen enormous advances over the past decade including structural similarity (SSIM) [11],visual signalto-noise ratio (VSNR) [12],visual quality metric (VQM) [13],and MOtion-based Video Integrity Evaluation (MOVIE) [14].Besides,several PSNR-based metrics,such as foveal PSNR (FPSNR) [15],have been proposed to consider the distortion in ROI regions with more importance.However,all the above metrics focus on generic videos,and there exists no objective metric sophisticatedly developed for video conferencing,in which the face can be seen as ROI regions.
In this paper,we therefore propose an objective visual quality assessment method for evaluating the perceived quality of video conferencing coding.To be more specific,we first present a real-time ROI identification technique,which applies the face alignment algorithm [16],to extract face and facial features.Then,we use the results of eye tracking experiments to investigate how many eye fixation points fall into the extracted face and facial features.Thereafter,assuming that the distribution of eye fixation points obeys Gaussian mixture model (GMM),an importance weight map is generated to endow ROI regions (i.e.face and facial features) with unequally great importance.Given the generated weight map,GMM based PSNR (GMM-PSNR) is then obtained through a linear combination of the distortion of pixels2The distortion is in terms of mean square errors.with their corresponding weights.Finally,we validate the efficiency of the proposed GMM-PSNR by exploring its correlation with subjective metrics.
The main contributions of this paper are twofold:
·With the eye tracking experiments,the importance of ROI regions in video conferencing is first analyzed through the acquired eye fixation points over the test videos.Then,we introduce a new term,namely eye fixation points/pixel (efp/p),to quantify the varying importance of the regions of background,face,and facial features.Such a term can be utilized to set up a novel perception model,for the objective visual quality assessment of video conferencing coding and even for the implementation of perceptual video conferencing coding.
·In light ofefp/pfor different regions,a novel objective visual quality assessment method is proposed for video conferencing.That is,a weight map is generated by combining GMM andefp/ptogether,and then GMMPSNR can be computed via a linear combination of the distortion of pixels with the weights of the generated weight map.Therefore,the proposed GMM-PSNR takes into account both the distortion and quantified importance (efp/p) for each pixel within a unified formulation such that it has high correlation with the subjective metrics.
The rest of this paper is organized as follows.In Section II,we briefly review the related work of visual quality assessment.In Section III,we introduce a real-time technique of ROI identification for objective quality assessment.Section IV presents our eye tracking experiments,and then it proposes the novel objective quality assessment method based on eye tracking results.Section V shows the experimental results and Section VI concludes this paper.
II.LITERATURE REVIEW OF VISUAL QUALITY ASSESSMENT
Visual quality assessment can be classified into subjective and objective assessments.Subjective visual quality assessment refers to obtaining the observers' view of the visual quality,whereas objective assessment normally utilizes machines to automatically measure the visual quality.
For subjective visual quality assessment,there needs a standard [17] [18] to specify the environment,the material used for testing,the rating criterion,and etc.The most popular method for measuring quality scores is mean opinion score (MOS) [19] proposed by International Telecommunication Union (ITU) in 1996,which evaluates the visual quality by asking human observers for their opinions.Normally,MOS is expressed as an integer ranging from 1 to 5 or 1 to 100,with 1 and 5 (or 100) being the lowest and highest perceived visual quality,respectively.Furthermore,differential mean opinion score (DMOS) [20] has been developed to evaluate the subjective distortion between the reference and processed videos.After computing the difference of MOS scores between those two videos for each observer,the DMOS can be obtained by averaging Z-scores,which is estimated based on the mean and standard deviation of MOS difference of all observers.Subjective quality metrics are accurate in predicting the perceived visual quality.However,the subjective visual quality assessment is costly,time-consuming and impractical for real-time ap- plications.These issues [21] trigger the demand to develop reliable objective quality metrics that can automatically assess the visual quality.
Objective visual quality assessment can be further divided into three categories [22] according to the availability of the reference (original) videos: full-reference (FR),reduced-reference (RR),and no-reference (NR) metrics.FR metrics perform a frame-byframe comparison between the reference and processed videos,and they thereby require the availability of the entire reference video.In comparison with RR and NR metrics,FR metrics [23] have been studied for a long time,thus being relatively mature for evaluating video quality.Therefore,the scope of this paper mainly concentrates on the FR metrics.
A commonly used FR metric is PSNR,which is based on the mean squared errors (MSE) between the reference and processed videos.It has been well studied from the mathematical perspective.However,PSNR cannot well reflect the subjective visual quality perceived by human visual system (HVS),as it does not consider the image content at all.For example,the subjective quality is increased by means of increasing PSNR in ROI regions.However,as the cost,the PSNR of the whole region may be decreased.In other words,PSNR is not always in complete agreement with the subjective quality.Thereby,from the viewpoint of subjective assessment,PSNR is not well suitable to assess the visual quality for perceptual video coding.
In order to better correlate with subjective visual quality,many advanced PNSR-based methods [15] [24] [25] [26] [27] [28] [29] [30] have been proposed to improve the existing PSNR mechanism by taking into account the importance of each pixel.For example,based on the foveation response of HVS,foveal PSNR (FPSNR) [15] was proposed to utilize a non-uniform resolution weighting metric with the distortion weights decreasing along with eccentricity.Peak signal-to-perceptible noise ratio (PSPNR) [27] and foveated PSPNR [30] were presented to consider distortion only when the errors are larger than just-noticeable-distortion (JND) thresholds.Similarly,semantic PSNR (SPSNR) [28] and eye-tracking-weighted PSNR (EWPSNR) [29] were raised based on the form of PSNR as well.EWPSNR performs in a fairer way to evaluate the visual quality according to the real-time detected eye fixation points,but it is impractical as it requires the expensive eye trackers available when assessing visual quality.
To better agree with HVS,several other cutting- edge objective visual quality assessment methods,either from RR or FR aspect,have been proposed.These methods include SSIM [11],video SSIM (VSSIM) [10],visual signal-to-noise ratio (VSNR) [12],visual quality metric (VQM) [13],and MOtion-based Video Integrity Evaluation (MOVIE) [14].Among these methods,SSIM is most extensively employed for objective visual quality assessment due to its simplicity.By computing the mean and covariance of small patches inside an image and then combining them into a distortion map,SSIM aims to find the degradation of structure information,to which human observers are more sensitive,for estimating the visual quality.VSSIM [10] was proposed to incorporate motion estimation in SSIM for estimating the objective quality of a video.Besides,National Telecommunications and Information Administration (NTIA) [13] developed an automatic quality rating method,namely VQM,to measure the visual quality of videos for digital video systems.In VQM,several features extracted from reference and processed videos are compared with each other to rate the visual quality of videos [31].To deal with different video scenes,NTIA offers several quality assessment models for VQM,such as the television,general,and the video conferencing models.Most recently,by combining both spatial and temporal aspects of distortion together,Seshadrinathan and Bovik proposed MOVIE metric [14] for objective visual quality assessment.For spatial distortion assessment,the errors between the reference and processed videos are normalized by masking coefficients,defined as a function of the local energy content.For temporal distortion assessment,the temporal distortion at each pixel is measured,using the motion information from optical flow fields of the reference video along with the spatio-temporal Gabor decompositions.The final MOVIE index for the video sequence is computed as the product of spatial and temporal distortion indices.
Perceptual video coding for video conferencing has been extensively studied in [32] [33] [34],since face is an evident cue for ROI regions.However,to our best knowledge,there is no objective visual quality assessment specially developed for video conferencing.In [32] [33],authors simply measured the distortion of ROI regions (i.e.facial regions) in terms of PSNR,without any analysis of its correlation with subjective quality assessment.Aiming at satisfying subjective metrics,we propose in this paper an objective quality assessment method that specifically focuses on evaluating the visual quality of video conferencing coding.
III.EXTRACTION OF FACE AND FACIAL FEATURES
Before introducing our GMM-PSNR approach,it is necessary to first identify the ROI regions in video conferencing applications.Here,the same technique is used in [35].Towards this end,the face and its facial features are extracted as ROI regions,using the procedure of Figure 1.As shown in this figure,after face detection [36],several key feature points are located in a video frame by combining the local detection (texture information) and global optimization (facial structure) together.Next,the contours of the face and its facial features are obtained via connecting the related feature points.Finally,the regions of face and facial features are extracted upon their contours.Indeed,the detection of feature points is a vital issue for extracting the regions of face and facial features.Benefiting from the recent success on computer vision,we employ a real-time face alignment method [16] to track the key feature points in face.An example of the detection results can be seen in Figure 1.In the following,we briefly review the work of the face alignment method [16].
For global optimization,the point distribution model (PDM) of key feature points needs to be coined before tracking these points in a video.Assume that {pt}Tt=1is the set of 2D coordinates for each key feature point.Then,the PDM is able to parameterize the deformable face on the basis of mean positionsby
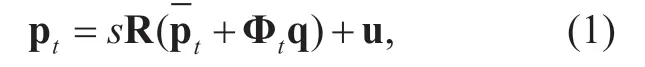
with the parameters of scales,rotationR,translationu,and a set of non-rigid parametersq.In Equation (1),is the set of candidates of non-rigid facial variation.Seeing the PDM of Equation (1) as the prior,we can select the key feature points from PDM to favor the locally detected feature points in each video frame,using the least-square fit:

Where p′tdenotes the coordinates of thetth feature point output by the local feature detector.Here,p′tcan be obtained via mean-shift algorithm [37].After iterating over mean-shifted update (computing p′t) and PDM parameterization (computing pt) until convergence,feature pointscan be finally output.For more details,see [16].In this paper,we utilize 66-point PDM [16] to extract the contours of face and facial features.See Figure 1 for an example.As seen from this figure,the 66-point PDM can well sample the key points of face and facial features,and accordingly these points can be connected to precisely extract the contours and regions of face and facial features.Therefore,the 66-point PDM is applied in our approach to extract face and facial features.
IV.THE PROPOSED METHOD ON OBJECTIVE VISUAL QUALITY ASSESSMENT FOR VIDEO CONFERENCING
In this section,a novel objective visual quality assessment method,namely GMM-PSNR,is proposed to effectively predict its correlation with subjective quality of video conferencing applications.In Section IV-A,using the eye tracking experiments,we find out the amounts of eye fixation points falling into the extracted face,facial features,and back- ground.In Section IV-B,GMM-PSNR is proposed according to the eye fixation points of different regions.
4.1 Experiments of human eye tracking
In [5],the authors have shown that face draws a majority of human attention over videos in conversational scenarios.It is thus interesting to further quantify unequal importance of background,face and facial features according to human attention.To obtain the values of such unequal importance,we conducted some eye tracking experiments on conferencing related videos.This section mainly concentrates on the eye tracking experiments and their results.
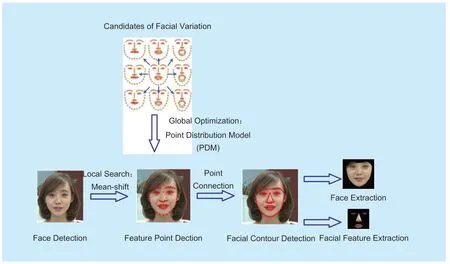
Fig.1.Overall procedure for face and facial feature extraction [35].
For the eye tracking experiments,18 conferencing related video clips (resolution: 720 × 480) were collected and each of them was cut to 750 frames (30 seconds,25 fps).Among the 18 video clips,six of them were collected from movies,another six were collected from video conferencing applications and the others were captured by Nikon D800 camera with different scales at frame rate of 25 fps.There are 6 categories of people in the video clips: male child,female child,young man,young woman,old man,old woman.Background includes indoor and outdoor scenes,in which the indoor scenes mainly contain meeting room,prison,laboratory,and news studio,and the outdoor scenes generally include grass,woods,and buildings.Then,the 18 video clips were combined together in a random manner to reduce the influence of video playing order on the eye tracking results.Furthermore,a blank period of 5 seconds was inserted between each video clip so that the subjects can have a proper rest time to avoid eye fatigue,thus improving the accuracy of the eye tracking results.
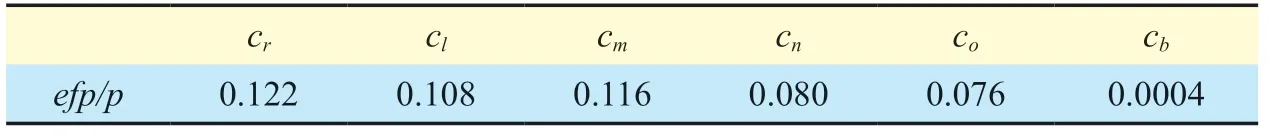
Table I.The number of efp/p of different regions.
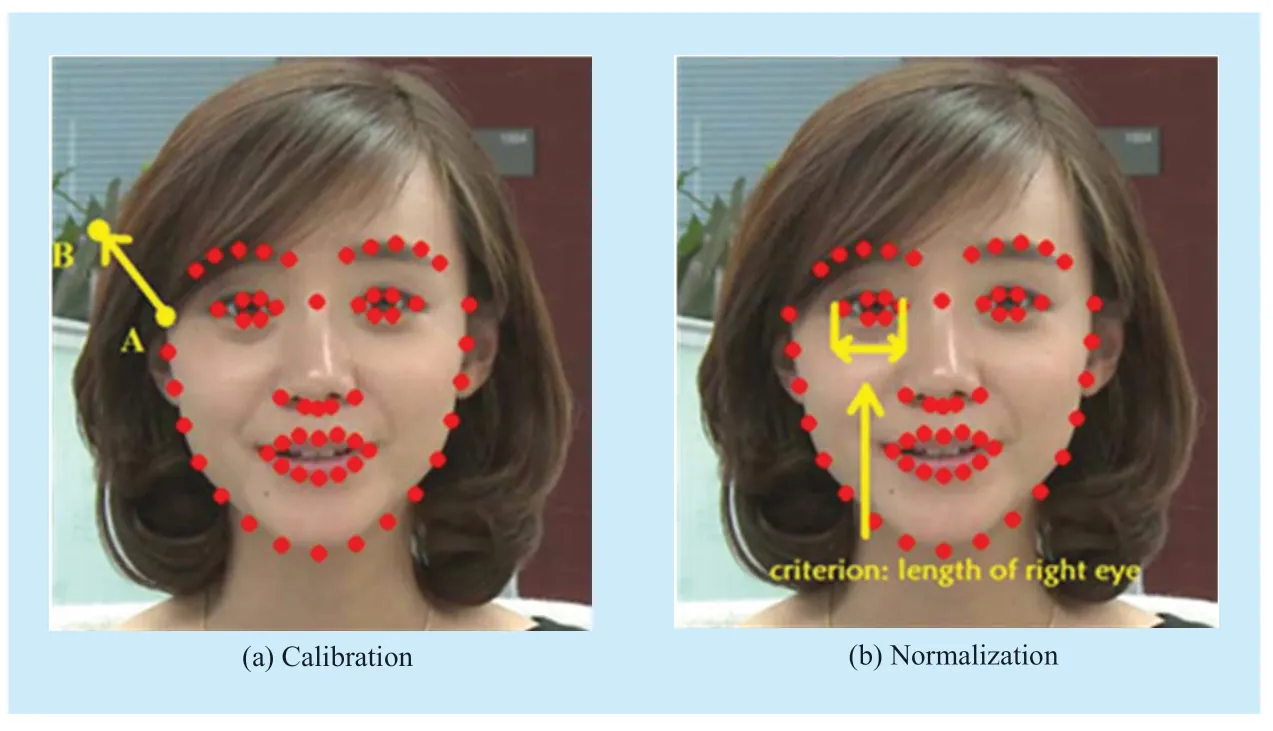
Fig.2.Example of preprocessing eye fixation points.The red points indicate the 66 points from PDM of Section III.(a): Point A denotes the upper right point in the 66-point PDM,and Point B stands for the original point for calibration.Note that original point B is the location of the upper right point of the 66-point PDM in the reference video clip.Then,the locations of eye fixation points for each video can be calibrated along with the coordinate translation (i.e.the translation from Point A to Point B).(b): The length of right eye (the distance between right and left points of right eye in the 66-point PDM) is used as the criterion for a normalized unit.
There were 24 subjects involved in the eye tracking experiments,and their eye fixation points were recorded over frames by Tobii® T60 Eye Tracker.The recorded eye fixation points represent the attention of the subjects,and therefore the eye-tracking results can be used to generate the subjective attention model for video conferencing.
The 24 subjects (14 males and 10 females,aging from 22 to 32) were chosen from Beihang University.They were all naive to the purpose of the eye tracking experiment and had never seen the test video clips before.Also,they did not have any background in subjective attention theory and video compression theory.Tobii® T60 Eye Tracker is integrated with an LCD display connected to a Windows computer.Subjects were seated on an adjustable chair with 60 cm viewing distance,ensuring that their horizontal sight is in the center of the screen.Before the test,subjects were instructed to perform the eye tracker calibration work,in which subjects stare at the intersection of two straight red lines appearing in the screen for one second and then click the mouse to see the next line intersection.
Finally,the eye fixation points of all subjects were recorded3We have put some of the detailed eye-tracking results over the test video clips online: http://buaamc2.net/html/Databases_Codes.htmlover frames of each clip by Tobii® T60 Eye Tracker.Some examples of eye tracking results can be seen in Figure 3.After the eye tracking experiments,fr,fl,fm,fn,fo,andfbwere counted,to indicate the numbers of eye fixation points belonging to right eye,left eye,mouth,nose,other parts in face,and background.Given the counted eye fixation points of different regions,we introduce a novel term,efp/p,to reflect the degree of attention at pixel level in these regions.Here,we have the values forefp/pin the following
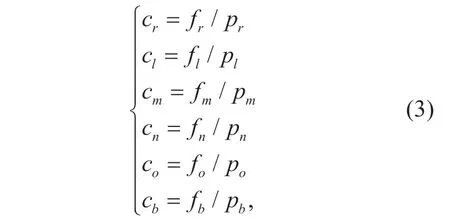
wherecr,cl,cm,cn,co,andcbare the values ofefp/pfor the regions of right eye,left eye,mouth,nose,other parts in face,and background;pr,pl,pm,pn,po,andpbare defined as the numbers of pixels in these regions.The values ofefp/pcomputed after the statistical analysis of our eye tracking experiments are reported in Table I.We can find out from Table I that the regions of eyes and mouth receive more human attention than nose and other facial regions,and that the background attracts far less attention than the face.
4.2 The proposed GMM-PSNR
After obtaining the results from the above eye tracking experiments,we now utilize them to train GMM for yielding an importance weight map of each video frame.Thereafter,GMMPSNR can be calculated to evaluate the objective quality of video conferencing given the corresponding weight map.
First,let us look at the way to train GMM.Before training GMM,preprocessing has to be conducted to calibrate and normalize the eye fixation points obtained in the above subsection.For more details of preprocessing eye fixation points,see Figure 2.As seen from Figure 2-(a),the eye fixation points were calibrated via the coordinate translation (i.e.the translation from Point A to Point B).This way,the ambiguity of different positions of human face in videos can be avoided.As shown in Figure 2-(b),the calibrated eye fixation points were then normalized based on the length of the right eye such that they are adaptive to varying numbers of pixels representing face and facial features.Afterwards,we used expectation-maximization (EM) algorithm [38] to train the following GMM on the calibrated and normalized eye fixation points.
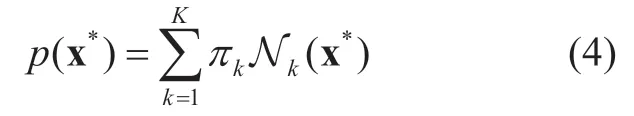
The GMM can be written as a linear superposition of Gaussian components in the form:
and
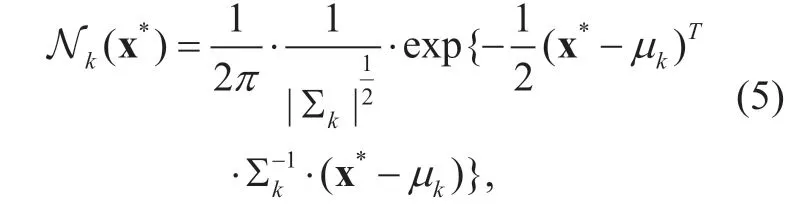
where πk,µk,and Σkare the mixing coefficient,mean and variance of thekth Gaussian component,and x∗denotes the two-dimensional calibrated and normalized eye fixation point.K stands for the number of Gaussian components for GMM.Since the amount of eye fixation points of nose is much less than those of eyes and mouth (as can be seen in Table I),we here set the value of K to 3 for the number of Gaussian components,each of them corresponding to right eye,left eye and mouth.The EM algorithm for training GMM in our method is summarized as follows:
(1) Initialization:Set meansto be the calibrated center of the right eye,the left eye and the mouth respectively,and mixing coefficients πkto be 1/3.
(2) E step:Evaluate the responsibilities using the parameter values of the current iteration:

where γnkis the responsibility that thekth Gaussian component takes for explaining thenth eye fixation point x*n.
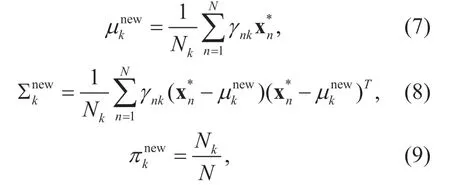
(3) M step:Re-estimate the parameters for the next iteration using the currently estimated responsibilities:
and
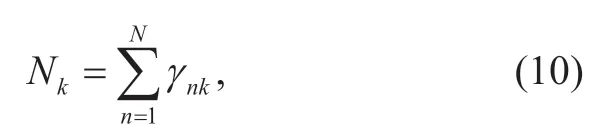
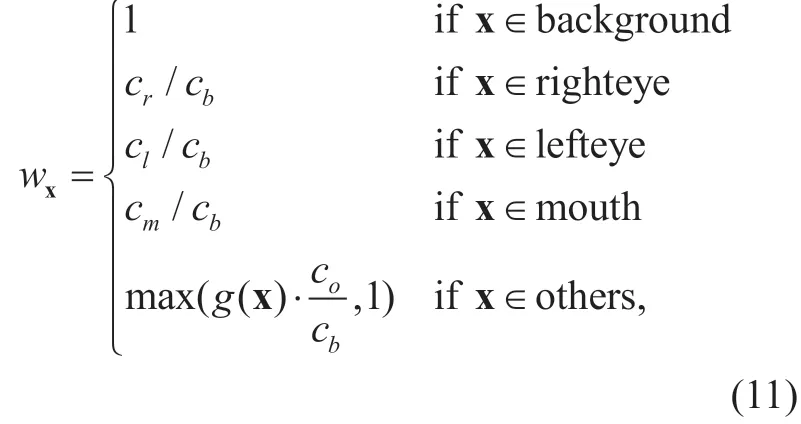
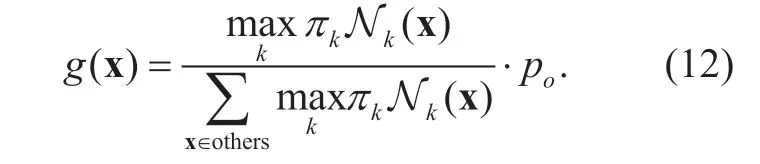
Whereµknew,Σnkew,andπkneware the mean,variance and mixing coefficient of thekth Gaussian component for the next iteration;Nkdenotes the effective number of eye fixation points assigned to thekth component andNstands for the total number of eye fixation points.
Then,upon the calibrated and normalized eye fixation points,GMM can be obtained via running EM several iterations until convergence.The values of parameters πkand Σkfor the obtained GMM are reported in Table II.Besides,µkis simply set to be the normalized centroid of each facial feature.Given the parameters of GMM in Table II,we can calculate the weight map to establish objective metric GMM-PSNR as follows.
Assuming that the background weight is 1,we can estimate the weight map of a video frame on the basis of theefp/pin Table I:
where
x = (i ,j) stands for the two-dimensional position of each pixel in the video frame that needs to be assessed.Note that x has been calibrated and normalized for calculating Equation (12),using the same way as x∗.Also,note that for Equation (11),the pixels of each video frame x are classified into regions of right eye,left eye,mouth,other facial regions,and background,by applying the extraction technique of Section III.Besides,“others”in Equation (11) denotes the pixels falling into other facial regions.Their weights obey the GMM distribution,as Nk(·)can be acquired using Equations (4) and (5) with the parameters of Table II.Figure 4 shows an example of the weight map for a video frame,which is output by our method.
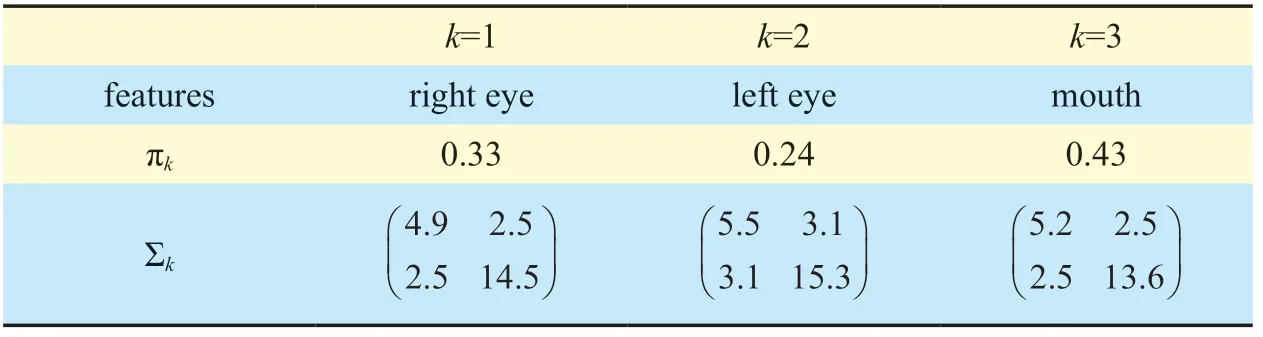
Table II.The parameters of Gaussian mixture model.
Finally,with the obtained weight mapwx,GMM based MSE (GMM-MSE) can be calculated:
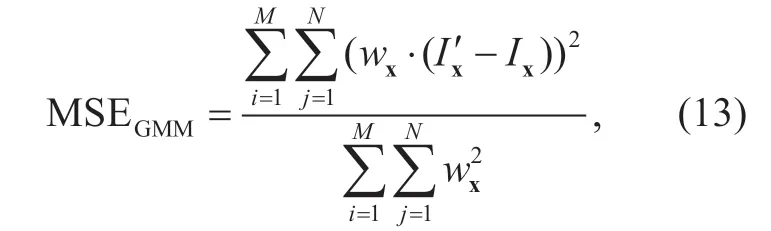
whereIx′ andIxare the values of pixel x in the processed and original video frames,respectively.MandNare the numbers of pixels along vertical and horizontal directions.According to the definition of PSNR,GMMPSNR can be computed in light of Equation (13):
wheren( = 8) is the bit depth.From Equations (13) and (14),we can see that if pixel valueIx′ in ROI regions is endowed with large weightwx,the corresponding distortion will be emphasized,and vice versa.Therefore,GMMPSNR,as the objective visual quality assessment method,is in accord with HVS that pays more attention to ROI regions.
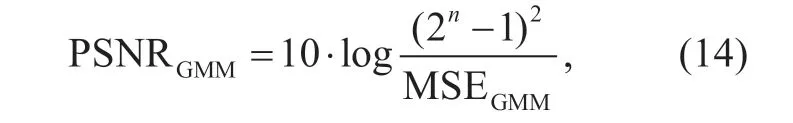
Algirthm 1 summarizes the proposed GMM-PSNR method for objective visual quality assessment.
V.EXPERIMENTAL RESULTS
In this section,we focus on the experiments to verify the effectiveness of our GMM-PSNR method.In Section V-A,we present the details of the test video sequences used for the visual quality assessment.In Section V-B,the experiments on subjective visual quality assessment over the test video sequences are introduced.In Section V-C,we investigate the correlation of the results of subjective visual quality assessment with those of the proposed GMM-PSNR and other conventional objective metrics.

Fig.3.Example of eye tracking results.The blue circles show the positions of eye fixation points and their sizes represent the staying duration of eye fixation points.

Fig.4.Example of weight map.The large (bright) intensities in (b) and (c) indicate high-valued weights.
Algirthm 1.The summary for GMM-PSNR.
5.1 The test video sequences
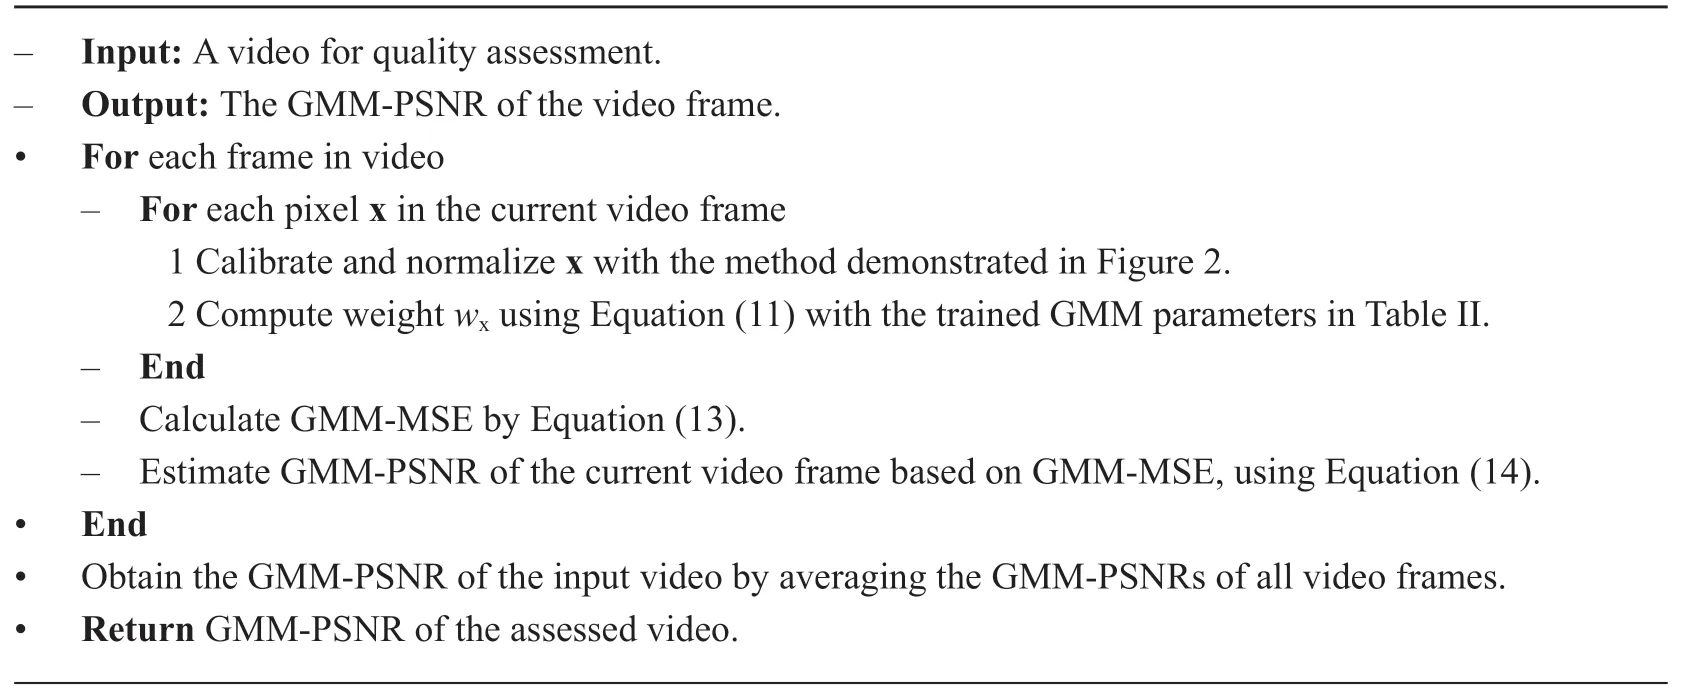
Since there is no video conferencing sequence at 1080p high definition (HD) resolution (1920 × 1080) from the VQEG FRTV Phase I database [39] and LIVE Video Quality Database [40],we captured five reference video conferencing sequences at 1920 × 1080 resolution with 150 frames,using a Sony XDCAM-PDW-700 camera.In such a camera,PowerHAD FX CCDs,featuring a signal processing ASIC with 14-bit A/D converters,enabled the capture of very high quality images.After video capture,camera data,with 1080p HD video clips at 25 fps,were stored in MXF-format files.Afterwards,with audio component being removed,we cut each video clip to 150 frames,and then converted them into color images in BMP format with RGB components (8 bits per component).Finally,all the BMP images were assembled into a video sequence in YUV format with 4:2:0 sampling.Here,we show the captured video sequences in Figure 5.Note that some of the videos were captured in dark room with poor illumination,in order to validate the robustness of the proposed quality assessment method.The videos can be freely downloaded at
http://buaamc2.net/html/Databases_Codes.html.
With the captured reference video sequences,we obtained other distorted video sequences at varying distortion,by compressing the reference sequences using HEVC (HM 9.0 [41]) and the ROI-based HEVC approach [35] at various bit-rates: 100 Kbps,200 Kbps,300 Kbps,500 Kbps,and 1 Mbps.Then,the total number of distorted video sequences is 50,corresponding to five reference video sequences.Note that the distortion of facial regions in the ROI-based HEVC approach [35] is reduced over HM 9.0 at the cost of more quality degradation in other regions.As pointed out in [35],although the PSNR of a video compressed by the ROI-based HEVC approach may be slightly less than that of HM 9.0,its subjective visual quality (DMOS) is significantly superior to HM 9.0.Thereby,some of test video sequences may have better subjective visual quality,even with low PSNR values.Next,the way of evaluating the subjective visual quality on all the test video sequences is presented.
Fig.5.The reference video conferencing sequences.Only one randomly selected video frame is shown above.
5.2 Subjective video quality assessment
The subjective assessment experiment was con- ducted on the above test video sequences using IVQUEST software [42].After viewing each sequence,the observers had enough time to set scores via dragging the scoring bar.The IVQUEST software displayed the remaining video sequences at a random order.Here,we adopted a single stimulus continuous quality scale (SSCQS) procedure of Rec.ITU-R BT.500 [43],to rate subjective quality.The scores available for observers are: excellent (100- 81),good (80-61),fair (60-41),poor (40-21),and bad (20-1).
For the experiment,47 observers (aging from 20 to 45) were selected from Beihang campus,including 13 females and 34 males.All these observers are of normal or corrected-to-normal vision.Note that the observers were totally different from the subjects involved in eye tracking experiments.Then,the reference and distorted video sequences were displayed at a random order.Before each test,the observers were required to view 5 training videos4The 5 training videos are from an original videos with different distortion.Note that these videos were not part of the test videos.with different quality levels,in order to help them better understand the subjective quality assessment.A 24”SAMSUNG S24B370 LCD monitor at 1920 1080 resolution was used to display the videos such that they are displayed at their original resolutions,avoiding the distortion of scaling operations.The viewing distance was set to be approximately three times of the video height for rea-sonable evaluation.
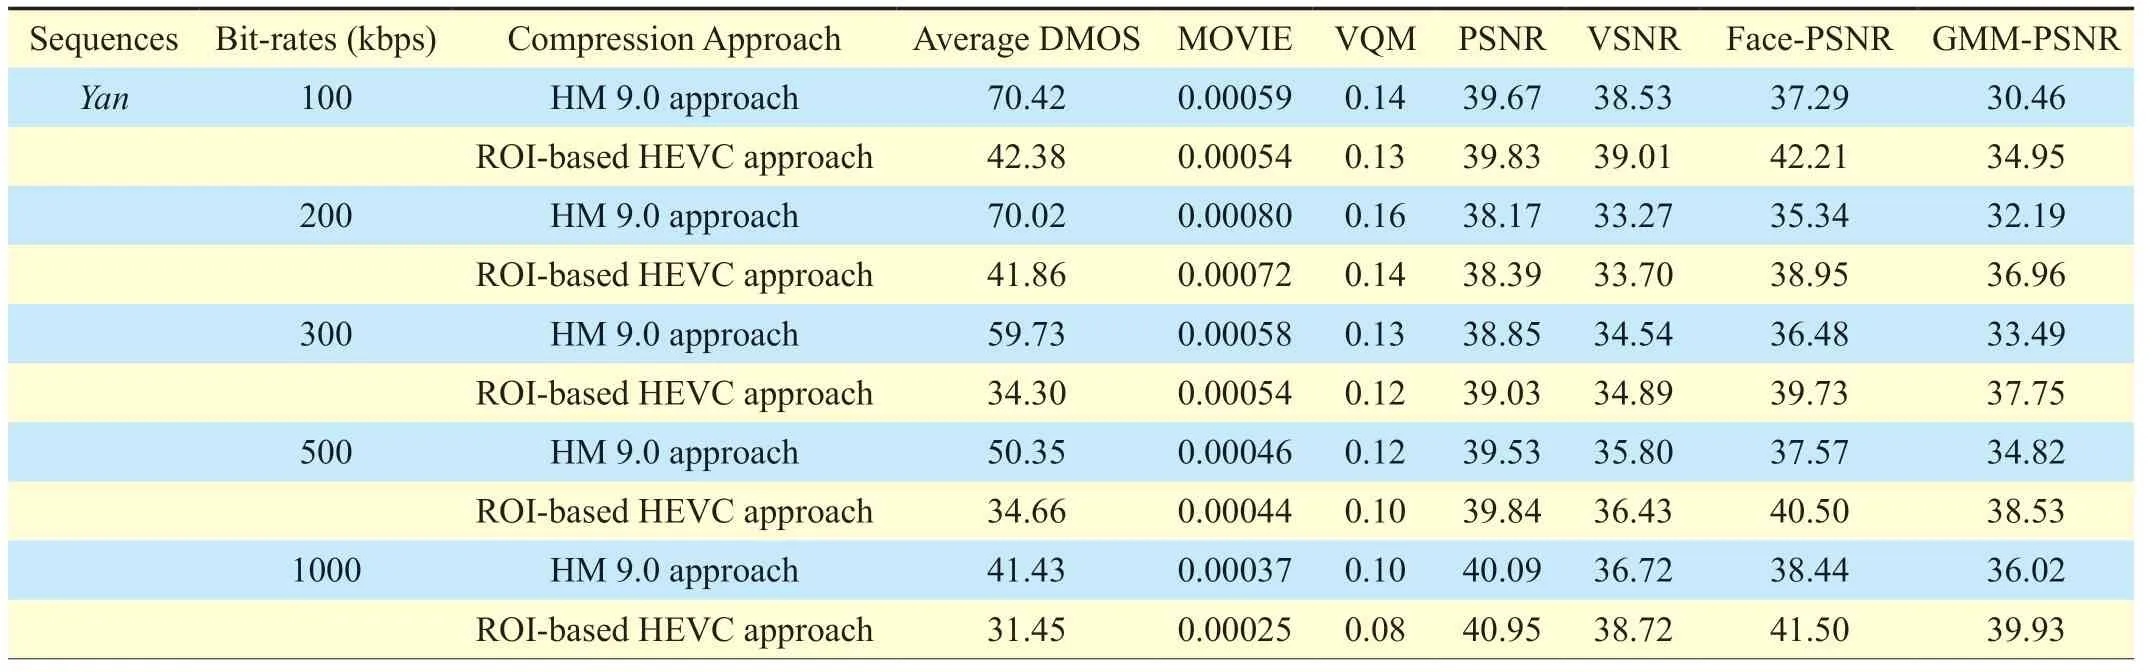
Table III.Results of dmos and other objective metrics.
After the evaluation tests,we obtain raw subjective scores.Then,those raw scores were converted to DMOS using the method in [44],indicating the visual difference between the reference and distorted video sequences.Next,the mean and standard deviation of the DMOS values of all 47 observers were calculated,for each of the 50 distorted video sequences.For one distorted video sequence,the obtained DMOS results outside the range of twice the standard deviation are considered as outliers.The outlier numbers were then computed for every observer.We found out that they range from 0 to 11 among all the 50 distorted video sequences.Here,we simply excluded the observers whose outlier numbers exceed 5 in order to ensure the robustness of subjective metric.As a result,38 observers were selected for the calculation of final DMOS.The final DMOS results are reported in Table IV.
5.3 Performance analysis of the proposed GMM- PSNR
The objective metrics,including MOVIE [14],VQM [13] (video conferencing model),PSNR,VSNR [12],Face-PSNR (PSNR of facial regions) [32] [33],and the proposed GMM-PSNR,were implemented for all video sequences.Here,all PSNR-related metrics were calculated on Y component and averaged over all video frames.The results of these objective metrics are listed in Table IV.Note that we used the ROI-based HEVC approach [35] to obtain the results in table 3.
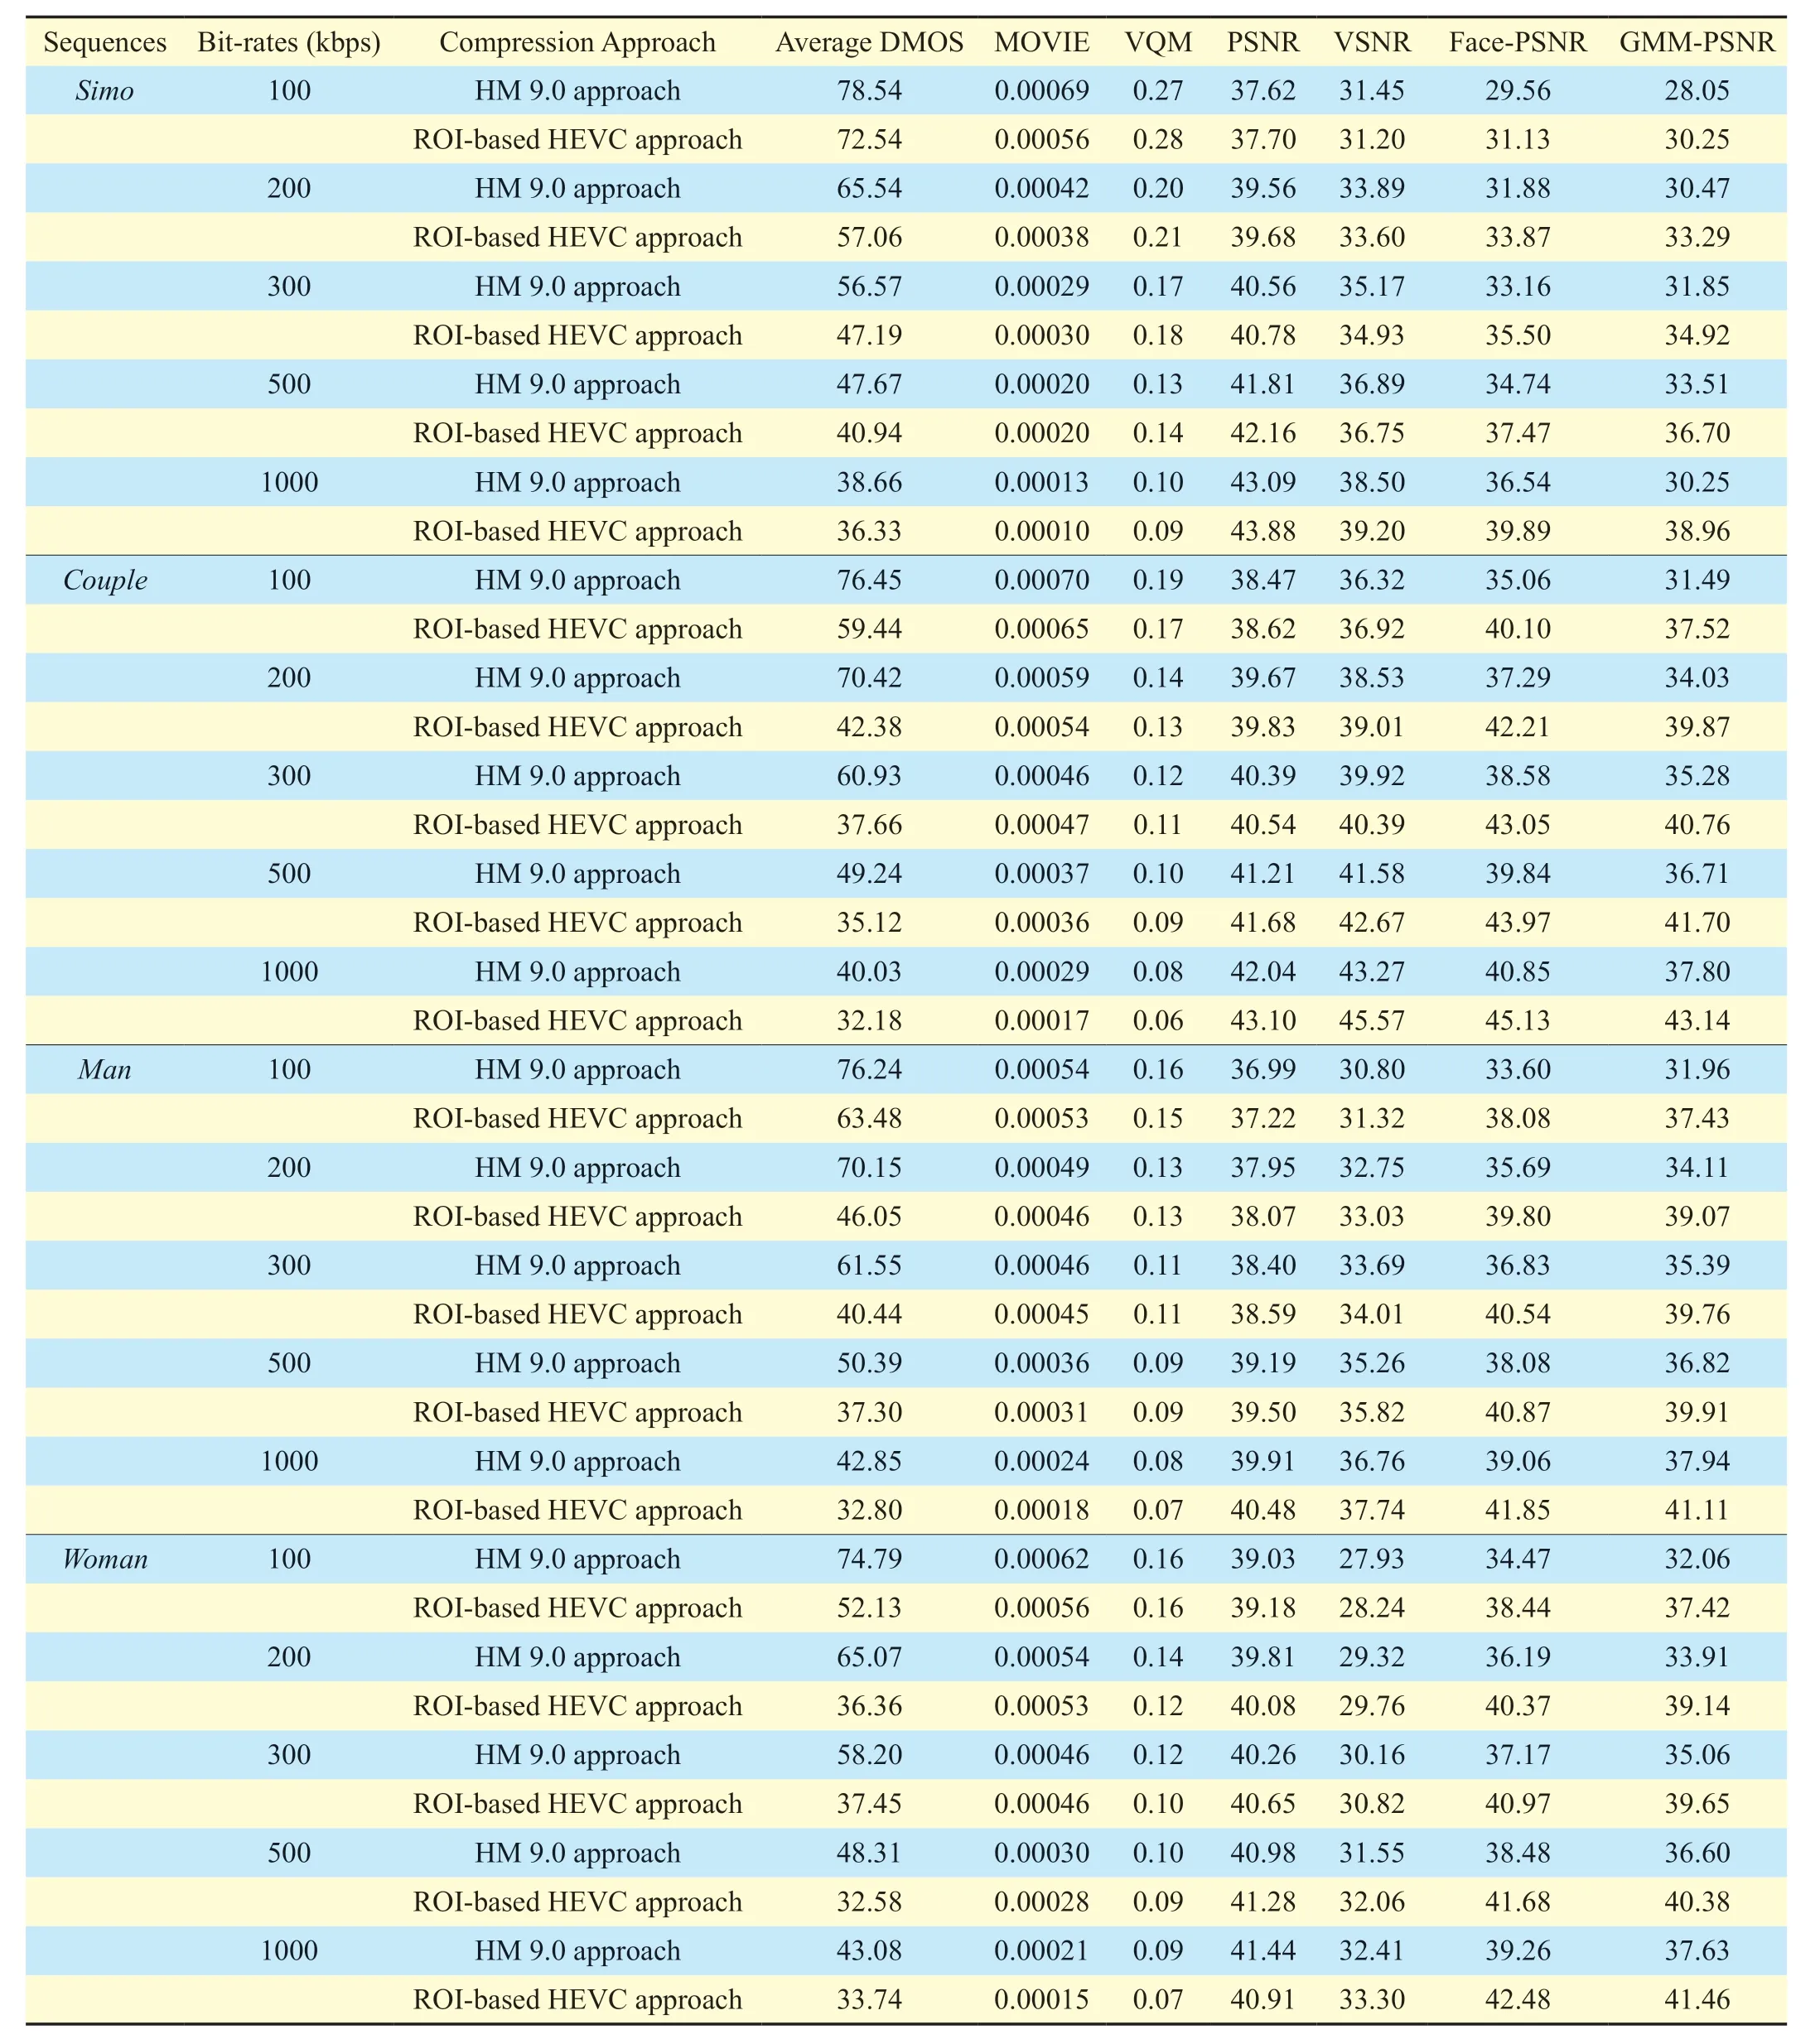
SequencesBit-rates (kbps) Compression Approach Average DMOS MOVIE VQM PSNR VSNR Face-PSNR GMM-PSNR Simo 100 HM 9.0 approach 78.54 0.00069 0.27 37.62 31.45 29.56 28.05 ROI-based HEVC approach 72.54 0.00056 0.28 37.70 31.20 31.13 30.25 200 HM 9.0 approach 65.54 0.00042 0.20 39.56 33.89 31.88 30.47 ROI-based HEVC approach 57.06 0.00038 0.21 39.68 33.60 33.87 33.29 300 HM 9.0 approach 56.57 0.00029 0.17 40.56 35.17 33.16 31.85 ROI-based HEVC approach 47.19 0.00030 0.18 40.78 34.93 35.50 34.92 500 HM 9.0 approach 47.67 0.00020 0.13 41.81 36.89 34.74 33.51 ROI-based HEVC approach 40.94 0.00020 0.14 42.16 36.75 37.47 36.70 1000 HM 9.0 approach 38.66 0.00013 0.10 43.09 38.50 36.54 30.25 ROI-based HEVC approach 36.33 0.00010 0.09 43.88 39.20 39.89 38.96 Couple 100 HM 9.0 approach 76.45 0.00070 0.19 38.47 36.32 35.06 31.49 ROI-based HEVC approach 59.44 0.00065 0.17 38.62 36.92 40.10 37.52 200 HM 9.0 approach 70.42 0.00059 0.14 39.67 38.53 37.29 34.03 ROI-based HEVC approach 42.38 0.00054 0.13 39.83 39.01 42.21 39.87 300 HM 9.0 approach 60.93 0.00046 0.12 40.39 39.92 38.58 35.28 ROI-based HEVC approach 37.66 0.00047 0.11 40.54 40.39 43.05 40.76 500 HM 9.0 approach 49.24 0.00037 0.10 41.21 41.58 39.84 36.71 ROI-based HEVC approach 35.12 0.00036 0.09 41.68 42.67 43.97 41.70 1000 HM 9.0 approach 40.03 0.00029 0.08 42.04 43.27 40.85 37.80 ROI-based HEVC approach 32.18 0.00017 0.06 43.10 45.57 45.13 43.14 Man 100 HM 9.0 approach 76.24 0.00054 0.16 36.99 30.80 33.60 31.96 ROI-based HEVC approach 63.48 0.00053 0.15 37.22 31.32 38.08 37.43 200 HM 9.0 approach 70.15 0.00049 0.13 37.95 32.75 35.69 34.11 ROI-based HEVC approach 46.05 0.00046 0.13 38.07 33.03 39.80 39.07 300 HM 9.0 approach 61.55 0.00046 0.11 38.40 33.69 36.83 35.39 ROI-based HEVC approach 40.44 0.00045 0.11 38.59 34.01 40.54 39.76 500 HM 9.0 approach 50.39 0.00036 0.09 39.19 35.26 38.08 36.82 ROI-based HEVC approach 37.30 0.00031 0.09 39.50 35.82 40.87 39.91 1000 HM 9.0 approach 42.85 0.00024 0.08 39.91 36.76 39.06 37.94 ROI-based HEVC approach 32.80 0.00018 0.07 40.48 37.74 41.85 41.11 Woman 100 HM 9.0 approach 74.79 0.00062 0.16 39.03 27.93 34.47 32.06 ROI-based HEVC approach 52.13 0.00056 0.16 39.18 28.24 38.44 37.42 200 HM 9.0 approach 65.07 0.00054 0.14 39.81 29.32 36.19 33.91 ROI-based HEVC approach 36.36 0.00053 0.12 40.08 29.76 40.37 39.14 300 HM 9.0 approach 58.20 0.00046 0.12 40.26 30.16 37.17 35.06 ROI-based HEVC approach 37.45 0.00046 0.10 40.65 30.82 40.97 39.65 500 HM 9.0 approach 48.31 0.00030 0.10 40.98 31.55 38.48 36.60 ROI-based HEVC approach 32.58 0.00028 0.09 41.28 32.06 41.68 40.38 1000 HM 9.0 approach 43.08 0.00021 0.09 41.44 32.41 39.26 37.63 ROI-based HEVC approach 33.74 0.00015 0.07 40.91 33.30 42.48 41.46
Based on the assessment results of Table IV,we draw the scatter plots of various objective metric scores versus DMOS,as shown in Figure 6.The horizontal axis of each plot represents an objective metric and the vertical axis stands for the corresponding DMOS score.The plot was produced by curve fitting of objective assessment and DMOS scores with second order polynomial model.In general,intensive scatter points close to the regression curve indicate an effective objective assessment.Therefore,we can see from Table IV that GMM-PSNR and Face-PSNR perform far better than the other metrics.Besides,GMM-PSNR outperforms Face-PSNR with more intensive points.
Next,it is worth quantifying the correlation between the results of DMOS and objective metrics.Thereby,Pearson correlation coefficient (PCC),Spearman rank order correlation coefficient (SROCC),root-mean-squared error (RMSE),and mean absolute error (MAE) were computed.They are all shown in Table V.Note that large-valued PCC and SROCC,or small-valued RMSE and MAE,indicate high correlation between objective and subjective metrics.The results in Table V reveal the efficiency of Face-PSNR,which has been used as a visual quality evaluation method in [32] and [33] (but its correlation with subjective quality was not verified before).Besides,both Face-PSNR and GMM-PSNR are far better than other objective metrics,in terms of all kinds of correlation with DMOS.Furthermore,our GMM-PSNR is superior to Face- PSNR so that it can be used as a more efficient objective metric for evaluating visual quality of video conferencing coding.
After analyzing from Figure 6 and Table V,we can conclude that our GMM-PSNR is better than other objective algorithms,due to its high correlation with subjective visual quality assessment.It is hence in accord with HVS.
VI.CONCLUSIONS AND FUTURE WORK
A novel objective quality assessment method,called GMM-PSNR,has been proposed in this paper for evaluating the perceived quality of video conferencing coding.Towards GMM-PSNR,we first developed a technique to extract the regions of face,facial features,and background in light of a real-time face alignment algorithm.Then,the eye tracking experiments were carried out to identify eye fixation points of these regions,andefp/pwas introduced upon identified eye fixation points,to qualify the importance of each pixel over a video frame.Benefitting from theefp/p,a weight map was yielded upon GMM to represent different importance of each pixel in a video frame.Next,GMM-PSNR was achieved via assigning different penalties to the distortion of each pixel for a video frame,according to the yielded weight map.This way,the pixel importance can be taken into account when evaluating the objective quality for video conferencing.At last,the experimental results validated the superior performance of the proposed GMM-PSNR by investigating its correlation with the DMOS results of subjective quality assessment.
Our work at its present form only concentrates on the distortion in terms of PSNR weighted over each pixel.There is a future work for the more efficient objective quality metrics,which may offer improved results by incorporating some state-of-the- art objective metrics in our approach,such as SSIM or even VQM.Moreover,3D video conferencing applications are the promising trend in immersive communication.Thus,GMM related objective quality assessment for the emerging 3D video conferencing requires research efforts for the future work.

- China Communications的其它文章
- A Bandwidth-Link Resources Cooperative Allocation Strategy of Data Communication in Intelligent Transportation Systems
- UP-TreeRec: Building Dynamic User Profiles Tree for News Recommendation
- A Fuzzy Decision Based WSN Localization Algorithm for Wise Healthcare
- Bistable Stochastic Resonance Enhanced 4-ary PAM Signal Detection under Low SNR
- Tensor Completion for Recovering Multichannel Audio Signal with Missing Data
- A PCA-Based Internet Delay Space Dividing Algorithm