Maternal serum level of resistin is associated with risk for gestational diabetes mellitus:A meta-analysis
Shi-Min Hu,Meng-Shi Chen,Hong-Zhuan Tan
Abstract
Key words: Resistin; Gestational diabetes mellitus; Meta-analysis; Gestational age
INTRODUCTION
Gestational diabetes mellitus (GDM) is defined by varying degrees of glucose intolerance that is first detected during pregnancy[1].In recent decades,the prevalence of GDM has been increasing and fluctuates from 1.7% to 11.6%[2].Poorly controlled GDM is associated with an increase in the incidence of gestational hypertension,preeclampsia,polyhydramnios,fetal macrosomia,birth trauma,operative delivery,and neonatal hypoglycemia[3-5].During pregnancy,insulin resistance is enhanced physiologically,which parallels the growth of the fetoplacental unit and facilitates the diversion of glucose to the fetus.When the compensatory increase in insulin is not sufficient to maintain glycemic homeostasis,pregnant women develop GDM.
Resistin,which was named after its insulin resistance ability by Steppanet al[6]in 2001,is a hormone with a molecular weight of 12.5 kDa that consists of 108 amino acids.Steppanet al[6]found anti-diabetic drugs called thiazolidinediones,which markedly lowered serum resistin levels in mice during treatment.The immunoneutralization of endogenous resistin improved blood glucose and insulin action in this model of type 2 diabetes.The treatment of normal mice with recombinant resistin impaired glucose tolerance and insulin action.Insulin-stimulated glucose uptake by adipocytes was enhanced by neutralization of resistin and reduced by resistin treatment[6].The association between elevated circulating resistin and insulin resistance in patients with type 2 diabetes has also been revealed[7-11].
The results of studies on the association between resistin and GDM risk vary greatly.Some studies have suggested that elevated circulating resistin is a risk factor for GDM[12-26],while some have suggested that elevated circulating resistin is a protective factor[27-30],and others have suggested that resistin circulating level is not associated with GDM risk[31-52].Variations in gestational age at sample collection,assay methods,fasting state,sample size,ethnicity,diagnosis criteria,severity of GDM,and definitions of controls could account for the considerable differences of the results of these studies.In a study performed by Steppanet al[6],they found that resistin expression was adipocyte-specific.However,recent reports suggest that resistin is also expressed in multiple other tissues,such as pancreatic islets,skeletal muscles,mononuclear cells,placenta,and liver cells[51,53,54].During pregnancy,the placenta synthesizes and secretes resistin into the maternal circulation[55,56].One study found that resistin protein expression in placental tissue was much higher than that in subcutaneous adipose tissue in pregnant women’s abdomens,suggesting that the placenta is a major contributor of resistin in pregnancy[57].Several studies have shown that the maternal circulating level of resistin gradually increases with gestational age and decreases significantly after delivery[17-19,23,37,40,42,44].This process of change is consistent with the growth and delivery of the placenta.
Notably,a previous meta-analysis published in 2013 that included 10 papers showed no association between circulating resistin levels and GDM[58].However,the authors suggested that these results should be interpreted with caution owing to the large heterogeneity among the studies.Since 2013,there have been many high-quality articles on serum resistin levels and GDM.Therefore,we think it is necessary to conduct another meta-analysis,and since there is a sufficient number of articles,we can perform a meta-regression analysis and subgroup analysis to explore possible influencing factors.The purpose of this study was to review the literature on the association of resistin and GDM risk,and attempt to find potential influence factors to interpret the considerable differences of the results of these studies.
MATERIALS AND METHODS
Literature search
The databases MEDLINE,EMBASE,and Web of Science (all databases,including Web of Science Core Collection,BIOSIS Citation Index,etc.) were searched up to October 11,2018 to find articles focused on the relationship between the risk of GDM and serum resistin level.The following keywords were used in PubMed and Web of Science:(“Diabetes,Gestational” [Mesh] OR “GDM” OR “gestational diabetes” OR“gestational diabetic” OR “diabetic pregnancy”) AND (“resistin” [MeSH] OR resistin OR RETN OR ADSF OR RSTN OR XCP1 OR FIZZ3 OR RETN1).The following keywords were used in EMBASE:(“pregnancy diabetes mellitus”/exp OR“gestational diabetes” OR “gestational diabeti” OR “diabetic pregnancy” OR “gdm”)AND (“resistin”/exp OR “resistin” OR “RETN” OR “ADSF” OR ”RSTN” OR ”XCP1”OR ”FIZZ3” OR ”RETN1”).We manually searched all the reference lists of the included studies and relevant reviews to find additional eligible studies.
Eligible studies,data extraction,and quality evaluation
This meta-analysis included eligible studies that:(1) investigated the relationship between the risk of GDM and serum resistin; (2) included GDM cases and controls without GDM; (3) diagnosed GDM according to the oral glucose-tolerance test; (4)were performed in humans; (5) were published as full text articles in English; and (6)provided data with median and quartile range,median and minimum and maximum values,or mean and standard deviation (SD).We excluded the studies with overlapping data.Information of the first author,study location (country),study design,year of publication,diagnostic criteria,number of patients and controls,gestational age at the time of blood sampling,assay methods,need for insulin in GDM patients,and the mean and SD of serum resistin levels was extracted.The quality of each included study was evaluated based on the Newcastle-Ottawa Scale(NOS) recommended by the Agency for Healthcare Research and Quality of the US[59].Comparability of cases and controls on the basis of the design or analysis was evaluated based on whether the gestational age and body mass index (BMI) at blood sampling matched.The NOS total score of the literature included had to be greater than or equal to 5 points.Disputes were resolved by discussion with a third author during data extraction and quality evaluation.The equationwas used to calculate SD from the standard error of the mean (SEM).If we need to merge the data of subgroups,we used the following equations:andThe equation “SD=interquartile range/1.35” was used to calculate SD from interquartile ranges.And we treated the medians as means[61].However,if we were provided with the minimum and maximum values,we calculated means and SDs according to the equations in the study of Hozoet al[62].When serum resistin levels were measured in both nonfasting and fasting blood samples at the same gestational age,we chose the fasting result here.
Statistical analysis
The pooled standardized mean difference (SMD) and 95% confidence interval (CI)were used to estimate the relationship between the risk of GDM and serum resistin.Subgroup analyses were performed to detect whether “need for insulin” or“gestational age at blood sampling” influenced the relationship between the risk of GDM and serum resistin.We divided the subjects into four subgroups according to the gestational age at blood sampling (“before 14 wk”,“14-28 wk”,“after 28 wk”,and“postpartum”).If the gestational age of the included study did not completely overlap with the gestational age of the subgroup,we would assign the study into the subgroup with the most overlap with the gestational age of the study.The study of Kuzmickiet al[14]was assigned to the “14-28 wk” subgroup.The studies of Kralischet al[39],Siddiquiet al[25],and Paliket al[17]were assigned to the subgroup of “after 28 wk”.Additionally,based on the “need for insulin in GDM patients”,the subjects were divided into three subgroups:(1) need for insulin; (2) no need for insulin; and (3) no information.TheZtest was used to determine the significance of the pooled SMD,with α set at 0.05.
TheQtest and theI2statistic were used to estimate the heterogeneity across studies[63,64].IfP< 0.1 in theQtest,andI2> 50%,we used the random effects model to pool the data; and meta-regression with restricted maximum likelihood estimation(REML) was performed to assess the potentially important covariate exerting substantial impact on between-study heterogeneity.The following covariates were included in the meta-regression analysis:need for insulin (no need for insulin,need for insulin,OR no information; dummy variable),assay method (ELISA OR others),and maternal age distribution (similar between cases and controls OR different between cases and controls) in each study.Begg’s funnel plot and Egger’s test and sensitivity analysis were used to assess the publication bias and the stability of the results.STATA 12.0 software (Stata Corporation,College Station,TX) was the only analysis software in this meta-analysis.The statistical methods of this study were reviewed by Jun-Xia Yan from Department of Epidemiology and Health Statistics,Central South University,China.
RESULTS
Study selection
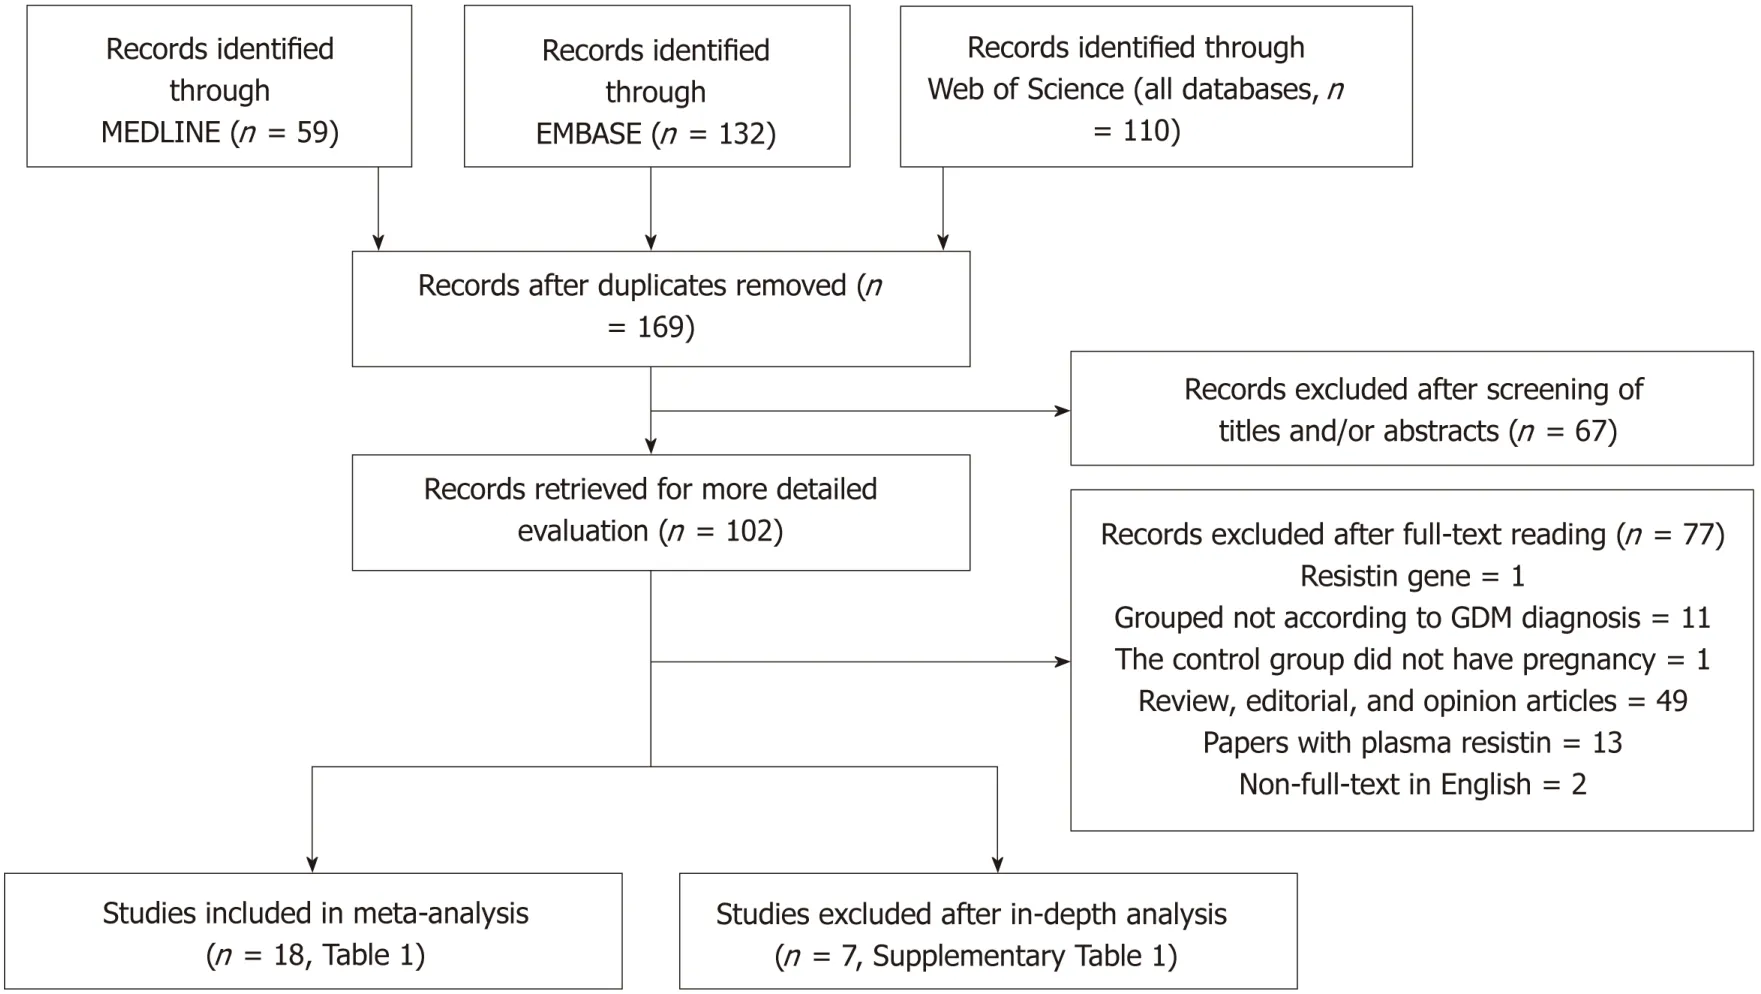
The process of study selection is shown in Figure 1.Three hundred and one records of potentially relevant studies were identified.Of these,199 records were excluded based on their title and/or abstract (“repetitive publications”:n=132; “conference abstracts”:n=18; “reports of animal studies”:n=6; “reports of studies that investigated outcomes irrelevant to this meta-analysis”:n=31; “adipokines other than resistin”:n=1; “studies of which the biological material was not maternal blood”:n=11).A further 77 full-text articles were excluded because these were:(1) review,editorial,and opinion articles (n=49); (2) studies in which interviewees were not grouped according to whether they had GDM (n=11); (3) a study in which the controls were not pregnant women and had never been pregnant (n=1); (4) papers with plasma resistin concentrations reported (n=13); (5) non-full-text articles in English (n=2); and (6)RETNgene study (n=1).After in-depth analysis,seven more studies were excluded.The specific reasons for the exclusion and the detailed information of these seven papers are shown in Supplementary
Table 1.The 18 studies (22 comparisons) that were ultimately selected for our meta-analysis included 1041 cases and 1292 controls (Tables 1 and 2).
Association between the risk of GDM and serum resistin level
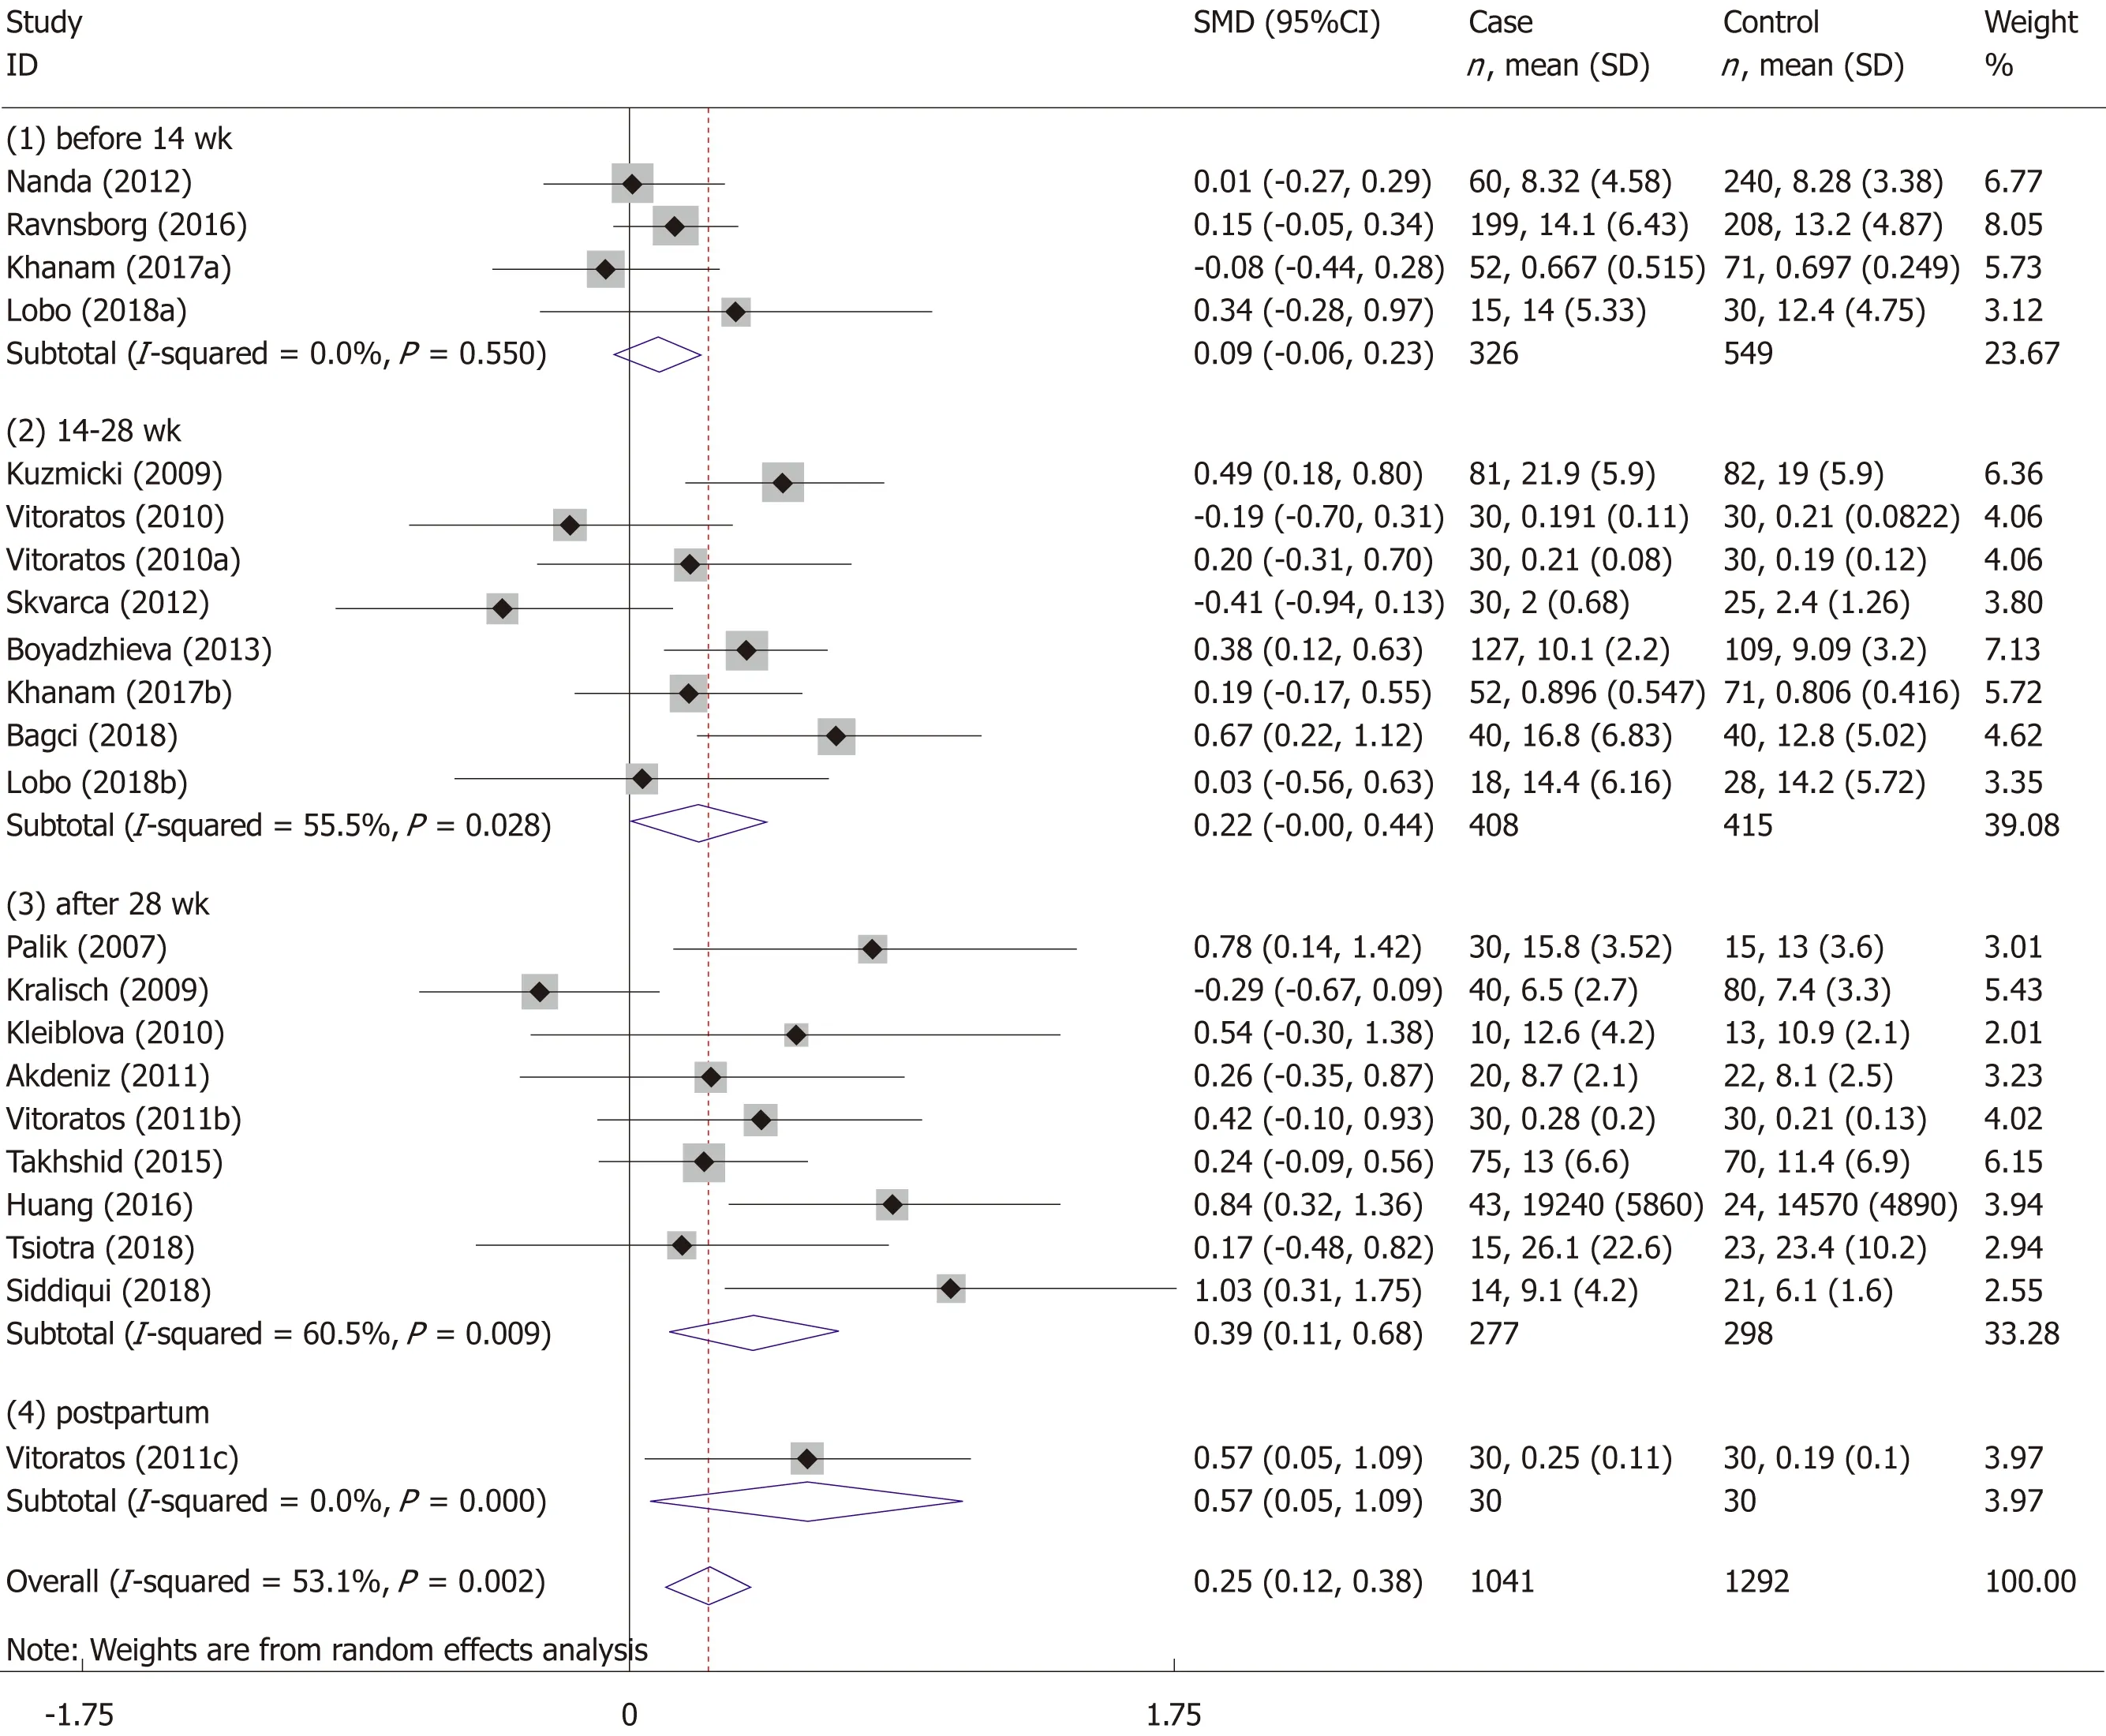
The meta-analysis included 18 studies (22 comparisons) with 1041 cases and 1292 controls.The total results showed that higher serum resistin was associated with the risk of GDM (SMD=0.250,95%CI:0.116,0.384) (Table 3 and Figure 2).The “after 28 wk”,“no need for insulin”,and “need for insulin” subgroups indicated that higher serum resistin was related to the risk of GDM (“after 28 wk” subgroup:SMD=0.394,95%CI:0.108,0.680; “no need for insulin” subgroup:SMD=0.177,95%CI:0.018,0.336;“need for insulin” subgroup:SMD=0.403,95%CI:0.119,0.687).The “before 14 wk”subgroup,“14-28 wk” subgroup,and “no information of need for insulin” subgroup showed a nonsignificant association between serum resistin level and GDM risk(“before 14 wk” subgroup:SMD=0.087,95%CI:-0.055,0.230; “14-28 wk” subgroup:SMD=0.217,95%CI:-0.003,0.436; “no information of need for insulin” subgroup:SMD=0.356,95%CI:-0.143,0.855).The postpartum subgroup included only one study and showed that higher serum resistin level was related to GDM risk (SMD=0.571,95%CI:0.054,1.087) (Table 3,Figures 3 and 4).
Table 4 summarizes results of meta-regression; “no need for insulin in GDM patients”,“age distribution similar between cases and controls”,and ELISA all had asignificant impact on between-study heterogeneity.REML estimate of between-study variance tau2 decreased from 0.0482 to 0.02687,indicating that these variables can account for 44.3% of heterogeneity sources.No association was statistically significant when meta-regression was performed on the three strategies considered one by one.In the sensitivity analysis,no changes were observed in the significance of the results or in the corresponding pooled SMD (Figure 5).In the publication bias analysis,the results of Begg’s funnel plot and the modified Egger linear regression test (Figure 6)showed no publication bias (Z=1.30,P=0.195;t=1.10,P=0.284).

Table 1 Detailed characteristics of all eligible studies for the association between serum resistin levels and gestational diabetes mellitus

Table 2 Quality assessment of the included studies based on scores of Newcastle-Ottawa Scale (case-control study version and cohort version)

Figure 1 PRISMA flow diagram of the study selection process.
DISCUSSION
The results of the studies focused on the association of maternal serum resistin level and GDM risk varied widely due to differences in study design type,ethnicity,diagnostic criteria for GDM,insulin use in GDM patients,inclusion criteria of the control group,the distribution equilibrium of maternal age,BMI,gestational age at sampling,sample size,serum/plasma selection,sample storage methods,and assay methods.To obtain a more reliable meta-analysis result,we set a threshold for the diagnostic criteria of GDM.To explore the possible influencing factors of the results,we performed subgroup analyses according to the gestational age at sampling and need for insulin in GDM patients.The total results showed that serum resistin level was associated with GDM.The results of the third trimester,“no need for insulin”,and “need for insulin” subgroups were consistent with the total result.
The effect of resistin on blood glucose was confirmed in animal studies by highly evidence-based studies[6,65].In a mouse model,Steppanet al[6]found that resistin levels were increased in diet-induced obesity,as well as in genetic models of obesity and insulin resistance.Neutralization of resistin reversibly reduced hyperglycemia in this model of diet-induced insulin resistance.The ability of recombinant resistin to produce glucose intolerance and insulin resistance is consistent with the opposite effects of immunoneutralization of endogenous resistin.Similar effects of resistin,i.e.,decreasing insulin-stimulated glucose uptake,were confirmedin vitroby using 3T3-L1 adipocytes[6].Banerjeeet al[65]studied the mechanism by which resistin regulates blood glucose,and they found that mice lacking resistin exhibited low blood glucose levels after fasting due to the impairment of hepatic glucose output.Resistin normally acts on the liver to inhibit the activation of adenosine monophosphate-activated protein kinase (AMPK).The key gluconeogenic enzymes glucose 6-phosphatase(G6Pase) and phosphoenolpyruvate carboxykinase (PEPCK) genes are both downregulated by activation of AMPK.Gene expression ofG6PaseandPEPCKwas markedly decreased in the liver of the resistin-null mice[65].There have been no animal studies related to circulating resistin level and GDM risk.
The association between elevated serum resistin level and GDM was only found in the third-trimester subgroup when we divided the studies into four subgroups according to the gestational age.This may be because the serum level of resistin increases with gestational age[17-19,23,37,40,42,44],and the gap in resistin levels between GDM and the controls may also increase with increasing gestational age.Figure 3 shows this trend.Therefore,a study focusing on the association between the serum resistin level and GDM risk in the first and second trimesters would require a larger sample size than one focusing only on the third trimester.Choiet al[12]found higher circulating resistin levels in women with pGDM than in women with normal glucose tolerance during pregnancy and one year after delivery,suggesting that in addition to the placenta,other secretory organs such as adipose tissue may also contribute to theoccurrence of GDM.A study on circulating resistin and fat mass compartments in pregnancy revealed that resistin levels are not related to BMI,total body fat mass,or abdominal subcutaneous fat mass but are related to abdominal visceral fat mass[66].In this meta-analysis,the postpartum subgroup included only one study.Further research may be needed to focused on the postpartum.The results of the subgroup analysis,according to the need for insulin,showed that the pooled SMD of “need for insulin in GDM patients” was higher than the pooled SMD of “no need for insulin in GDM patients”,suggesting that the serum level of resistin may be related to the severity of GDM.The research of Huanget al[13]showed that among pregnant women with GDM,the serum resistin levels of women with satisfactory glycemic control were lower than those in women with unsatisfactory glycemic control[13].

Table 3 Summary of different comparative results of serum resistin level with gestational diabetes mellitus risk
Studies onRETN(gene encoded resistin) mRNA and SNPs have also suggested that resistin is associated with GDM risk.The mRNA expression ofRETNwas increased in adipose tissue from GDM when compared to a non-GDM group,was related to insulin resistance level,and could be regulated by adrenomedullin and an adrenomedullin antagonist[13,67,68].RETNrs1423096 and -420 C/G were found to be associated with GDM risk[48,69],and it has been reported that the G allele of -420 C/G in theRETNgene promoter was associated with an increase in circulating resistin[70,71].
In summary,our meta-analysis showed that higher maternal serum resistin level is related to GDM risk and suggested that the serum level of resistin may be related to the severity of GDM.Studies focusing on the association between the serum resistin level and GDM risk in the first and second trimesters would require a larger sample size than ones focusing only on the third trimester.

Table 4 Meta-regression analysis results

Figure 2 Meta-analysis for the association of serum resistin level with gestational diabetes mellitus risk using a random effects model.

Figure 3 Gestational age at blood sampling subgroup analysis using a random effects model.

Figure 4 Need for insulin subgroup analysis using a random effects model.

Figure 5 Results of sensitivity analysis of serum resistin level with gestational diabetes mellitus risk.

Figure 6 Begg’s funnel plot for publication bias test of serum resistin level with gestational diabetes mellitus risk.SMD:Standardized mean difference.
ARTICLE HIGHLIGHTS
Research background
Resistin is most likely involved in the pathogenesis of gestational diabetes mellitus (GDM),but the existing findings are inconsistent.
Research motivation
To explore the sources of heterogeneity in the existing literature,we made the literature heterogeneity within an acceptable range by setting reasonable inclusion criteria.Based on this,we aimed to explore the relationship between serum level of resistin and GDM risk.
Research objectives
This article aims to review the studies investigating the association of GDM risk with serum resistin level.
Research methods
A systematic literature search was performed using MEDLINE,EMBASE,and Web of Science(all databases).We did subgroup analysis according to the need for insulin in GDM patients and gestational age at blood sampling.Meta-regression with restricted maximum likelihood estimation was performed to assess the potentially important covariate exerting substantial impact on between-study heterogeneity.
Research results
The meta-analysis included 18 studies (22 comparisons) with 1041 cases and 1292 controls.The total results showed that the risk of GDM was associated with serum resistin level.The results of subgroup are consistent with the total results.The meta-regression revealed that no need for insulin in GDM patients,age distribution similar between cases and controls,and ELISA all had a significant impact on between-study heterogeneity.
Research conclusions
This meta-analysis supports that the maternal serum resistin level is associated with GDM risk.
Research perspectives
In summary,our meta-analysis showed that higher maternal serum resistin level is related to GDM risk and suggested that the serum level of resistin may be related to the severity of GDM.
 World Journal of Clinical Cases2019年5期
- World Journal of Clinical Cases的其它文章
- Clinical presentation and early predictors for poor outcomes in pediatric myocarditis:A retrospective study
- Safety of an improved patent ductus arteriosus occluder for transcatheter closure of perimembranous ventricular septal defects with abnormally attached tricuspid chordae tendineae
- Adiponectin gene polymorphisms and risk of gestational diabetes mellitus:A meta-analysis
- Docetaxel,cisplatin,and 5-fluorouracil compared with epirubicin,cisplatin,and 5-fluorouracil regimen for advanced gastric cancer:A systematic review and meta-analysis
- Sustained complete response to erlotinib in squamous cell carcinoma of the head and neck:A case report
- Exercise-induced anaphylaxis with an Ayurvedic drug as cofactor:A case report
