Model of CEL for 3D Elements in PDMs of Unidirectional Composite Structures
Tianliang Qin, Libin Zhao , Jifeng Xu, Fengrui Liu and Jianyu Zhang
Abstract: Progressive damage models (PDMs) have been increasingly used to simulate the failure process of composite material structures. To accurately simulate the damage in each ply, 3D PDMs of composite materials have received more attention recently. A characteristic element length (CEL), which is an important dimensional parameter of PDMs for composite materials, is quite difficult to obtain for 3D elements, especially considering the crack directions during damage propagation. In this paper, CEL models for 3D elements in PDMs of unidirectional composite structures are presented, and their approximate formulae are deduced. The damage in unidirectional composite materials can be divided into fiber cracks and inter-fiber cracks. The fiber crack and inter-fiber crack directions are considered in the CEL derivations, and thus, the CELs of 3D elements that have various damage modes and damage directions could be obtained relatively precisely. Static tensile and compressive tests of open-hole laminates were conducted, and the corresponding numerical analyses by the progressive damage method, including the proposed CEL models and those models from the literature, were performed. The numerical results are in good agreement with the experimental results, which proves the fidelity and effectiveness of the proposed CEL models. In addition, the proposed CEL models have better performance in improving the mesh independence of the numerical models.
Keywords: Laminates, finite element analysis (FEA), mechanical testing, progressive damage analysis, CEL.
1 Introduction
Composite materials have been widely used in aircraft, automobiles, ships, etc., due to their significant advantage in reducing the structural weight. However, a composite material has many different damage modes, such as fiber failure, matrix failure,fiber-matrix debonding, delamination, etc. which lead to extreme difficulty in predicting the damage process and the strength of composite structures [Ray, Dong and Atluri(2016)]. Recently, the progressive damage method has increasingly been used to predict the failure of composite structures [Sane, Padole and Uddanwadiker (2018)], and many PDMs have been proposed in published papers. Some use sudden degradation damage models, which are implemented by decreasing the damaged material properties to zero or to a portion of the initial values, to describe the mechanical properties of the damaged materials [Labeas, Belesis and Stamatelos (2008)]. Clearly, the sudden degradation damage models divide the materials into two states: undamaged and completely damaged. In fact,during the damage propagation of the composite materials, the mechanical behavior of the materials exhibits a gradual reduction. As a result, gradual degradation damage models, in which the stresses gradually decrease to zero after the damage onset, are used increasingly in the strength prediction of composite structures [Wang, Liu, Xia et al. (2015)].
In FEA, stress softening in constitutive equations brings about a severe mesh dependency problem [Guo and Nairn (2017)] when the gradual degradation damage model is implemented, which makes the numerical results not objective any more. Bažant proposed a crack band model for the gradual degradation damage models to overcome this problem,which simulates a crack using a layer of damaged elements and spreads the fracture energy of the crack over the full volume of the element [Bažant and Oh (1983)]. A CEL, which characterizes a dimensional parameter of the finite element, is induced into the crack band model to bridge the fracture energy and the computed dissipated energy. The CEL is a key parameter in the crack band model because it ensures the objectivity of the finite element model (FEM) by regularizing the computed dissipated energy.
Overall, an accurate measurement of the CEL is quite complex and difficult, because the CEL of an element is not only associated with the element dimension but also the crack directions, including the transverse and longitudinal directions. In published reports, only a few approximate models were established to determine the CEL for 2D elements.Bažant provided approximate expressions of the CEL for square elements with known and unknown crack directions [Bažant and Oh (1983)]. Maimi proposed an average CEL expression for triangular elements [Maimí, Camanho, Mayugo et al. (2007b)]. However,the CEL expressions for more general elements such as parallelogram elements have not yet been provided. In addition, the existing models cannot characterize the various crack directions in the composite materials, and moreover, in some models, the crack directions are even not accounted for.
With the increasing requirements for reliable failure analysis of composite structures, more accurate stress analysis models are needed, and more damage mechanisms in composite materials should be considered in failure analysis. Establishing a suitable 3D PDM for composite materials has been a major interest and goal of worldwide researchers [Hinton and Kaddour (2012); Zhou, Tian and Zhang (2015); Chowdhury, Chiu, Wang et al. (2016);Vanegas-Useche, Abdel-Wahab and Parker (2018)]. As a result, the CEL for 3D elements is critical for the fidelity of the PDM. However, thus far, there are not proper methods to calculate the 3D CELs while accounting for the various crack directions.
In previous work, a modified maximum stress criterion, which could predict the initiation of the fiber failure and inter-fiber failure of unidirectional composite materials, was proposed and combined with a sudden degradation model to investigate the failure of composite π joints [Zhao, Qin, Zhang et al. (2013); Zhao, Qin, Chen et al. (2014)]. In later work, a 3D gradual degradation model was developed to account for the nonlinear behavior and some damage characters such as the inter-fiber crack orientation, crack closure, etc. [Zhao, Qin, Zhang et al. (2015)]. However, the CEL in the 3D gradual degradation model was determined using a rough model that was simply extended from 2D CEL. In this work, more precise CEL models are proposed to calculate the CELs of 3D elements for the PDMs of composite structures. The fiber crack direction and arbitrary inter-fiber crack direction, which change with the stress variations, are considered in these models to accurately calculate the CELs of the 3D elements. Some damage characteristics and modeling conventions of unidirectional composite materials can facilitate reducing the uncertainties in determining the relative positions of the cracks and the element dimension, which make the deduction of CEL more effective. Further,the models are applied to the 3D progressive damage analysis of open-hole laminates under tension loadings. The advantages of the models are validated by comparing the results with the results obtained by progressive damage analysis using other CEL expressions. Tensile experiments on open-hole laminates were conducted to further validate the numerical results from the proposed models.
2 CEL model for 3D elements in PDMs of unidirectional composites
2.1 Definition of CEL
In composite materials, the damage always initiates from the weakest region such as a rich resin region, micro cracks, etc. The material does not lose all of the load carrying capability suddenly. With the damage propagating and developing into a macro crack,such as a crack shown in Fig. 1(a), the stresses carried by the material decrease to zero gradually. A linear softening model is commonly used in the progressive damage analysis of composite materials [Bandaru and Ahmad (2016)], as shown in Fig. 1(b). Here, σ is the stress component inducing the crack, and ε is the corresponding strain component. When the stress is less than a damage onset stress σ0, it increases linearly with the strain, which is shown as the AB part; when the stress reaches σ0, damage occurs, after which the stress decreases to zero linearly, which is shown as the BC part. Point B corresponds to the damage initiation, and point C is related to the full damage state. The area of the triangle ABC represents the energy dissipated per unit volume due to the damage.

Figure 1: The crack band model: (a) crack in a brick element; (b) linear softening model
In the crack band model [Bažant and Oh (1983)], the fracture is modeled as a blunt smeared crack band. The smeared crack band is simulated by a layer of damaged elements in numerical model, which has strain-softening stress-strain relations. The energy absorbed by each damaged element is used to form the fracture surfaces in it.Therefore, the absorbed energy is equal to the energy consumed by the crack passing through it, as shown in Fig. 1(a). The absorbed energy WDof the damaged element is calculated as follows:

where V is the element volume, and Γ is the energy dissipated per unit volume.
The fracture energy WCconsumed by the crack with area A could be given as

where GCis the fracture toughness of the composite materials, which is constant.
Therefore, the relation between Γ and GCcan be obtained:

Eq. (3) is the smeared formulation of the crack band model. The parameter l*is the CEL.For a cubic element with a regular crack similar to the crack shown in Fig. 1, the CEL is the thickness of the element, which represents the width of the crack band in the model.
In a linear degradation damage model, the Γ can be expressed asSubstituting it into Eq. (3), Eq. (4) is obtained.

Clearly, this equation shows that the energy absorbed by the damaged element of a unit of cracked area equals the fracture toughness, which makes the numerical results independent of the mesh refinement.
2.2 Assumptions of the 3D CEL model for unidirectional composite materials
Accurately calculating the CEL of 3D elements with arbitrary cracks is extremely difficult because determining the crack area in the element is impossible in PDMs in which the crack is not actually modeled. The CEL models here provide only the approximate CEL values. Some assumptions about the damage modes and FE modeling rules of unidirectional composite materials are adopted to simplify the problems.
2.2.1 Damage modes of unidirectional composite materials
The failure mechanism of unidirectional composite materials is quite complex due to their multiscale characteristics and two-component composition. At the meso-scale, the damage in the composite materials includes the fiber breakage, fiber buckling, matrix cracking, interface debonding, fiber bridging, etc. [Maimí, Camanho, Mayugo et al.(2007a); Daniel and Ishai (1994)]. At the macroscale, commonly, five failure modes are concluded: fiber tensile and compressive failure, matrix tensile and compressive failure,and fiber-matrix shearing failure. Under the loading, after the appearance of damage in the composite material, the fiber tensile and compressive failure induce cracks perpendicular to the fiber, while matrix tensile and compressive failure and fiber-matrix shearing failure lead to cracks parallel to the fiber [Puck and Schürmann (1998); Puck and Schürmann (2002)]. Therefore, the CEL model assumes that the unidirectional composite material has two classes of damage: fiber cracks occurring in fiber tensile and compressive failures, and inter-fiber cracks mainly occurring in matrix tensile and compressive failures and fiber-matrix shearing failures, as shown in Fig. 2. A fiber crack is always perpendicular to the fiber. An inter-fiber crack is parallel to the fiber. The angle of the inter-fiber crack in the ply depends on the stresses acting on the material. It can be observed by some researchers’ work [Pinho, Iannucci and Robinson (2006)].

Figure 2: Damage in unidirectional composite materials: (a) fiber crack; (b) inter-fiber crack
2.2.2 FE modeling rules of unidirectional composite materials
To easily obtain the CEL, the crack position relative to the element dimension is preferred to be as simple as possible. Therefore, the CEL model requires that only the hexahedral elements and wedge elements can be used in the FEM of the composite structures, and at least one surface of the elements is parallel to the fiber. As a result, the fiber directions in different elements are inerratic, as shown in Fig. 3. Fig. 3(a) illustrates a hexahedral element with a pair of parallelogram surfaces parallel to the fibers. Fig. 3(b)and Fig. 3(c) show two wedge elements. The former has a pair of triangle surfaces parallel to the fibers, while the latter has one parallelogram surface parallel to the fibers.The principle coordinates of the material are marked in the figures, which is very important for describing the damage directions and calculating the CEL.

Figure 3: 3D element configurations of composite structures
2.3 Formulae of CEL models for 3D elements
The CEL for 2D parallelogram elements is deduced first, from which useful references are expatiated for establishing the CEL model for 3D elements. Then, the formulae of the CEL model for hexahedral elements and wedge elements are deduced.
2.3.1 Formulae of CEL model for 2D parallelogram elements
The accurate deduction of the CEL needs the exact position information of the crack in an element. It cannot be provided by the PDM because the crack is not modeled exactly. As a result, an accurate calculation of the CEL is impossible. The typical position of the crack with its path passing through the center of an element is adopted in this work. The crack angle should be provided with the failure criteria capable of predicting the crack direction.Assume that a crack passes through the center of a parallelogram element with an angle of θcrc, as shown in Fig. 4(a). In the case of θcrc≦∠CAD, the crack length lcrccan be expressed as

According to the definition of the CEL, the following can be obtained from Eq. (6):

When θcrc>∠CAD, the CEL l*is deduced as


Figure 4: A parallelogram element and its equivalent element: (a) parallelogram element;(b) equivalent element
For elements that have the same crack areas, they will have the same CELs when their volumes are the same, such as the elements in Fig. 4. They are called equivalent elements in this work. This finding means that the CEL of an element can be calculated with its equivalent element. It will be easier to calculate the CEL of an arbitrary element by using its equivalent element with a regular shape, especially for 3D elements.
2.3.2 Formulae of the CEL model for 3D elements
For hexahedral elements, assume that the fiber crack and inter-fiber crack pass through the center of the elements when either of them occurs, as shown in Fig. 5(a). Clearly, the fiber crack is always perpendicular to the fiber axis, from which the fiber crack direction is fixed. Because the edges of AE, BF, CG and DH are commonly required to be nearly perpendicular to the top face in the FEM, it is appropriate to replace the derivation of the CEL for fiber crackwith the CEL of parallelogram EFGH, as follows:

For the inter-fiber crack, it is difficult to obtain a concise expression of the CEL, because calculating the crack area in the 3D model is cumbersome. The approximately equivalent model that has a regular shape with respect to the inter-fiber crack is established to obtainin this work. Technically, the equivalent model should have exactly the same crack area and volume as its original model. To simplify the deduction, the crack area is approximately equal to the original area during the element transformation, while the element volume stays constant.
Two steps are adopted to obtain the equivalent model. First, replace the top and bottom surfaces of the original model with rectangle surfaces, whose width is parallel to the fiber crack, as shown in Fig. 5(b). The width and length are equal toand, respectively.
Let the crack pass through the center of the new model. It is easy to know that the model volume equals that of the original model. The change of the crack area in the model is negligible when the side edges are nearly perpendicular to the top and bottom faces. At this time, the crack position in the model is still not easy to obtain. In the next step,project the side surfaces AEH'D' and B'F'G'C' to the plane perpendicular to the fiber and keep the crack through the center of the new model, as shown in Fig. 5(c). The crack area and model volume do not change in the second transformation. As a result, an approximately equivalent model that has a more regular shape is obtained.
The inter-fiber crack angle is defined from inter-fiber crack to the element surface parallel with the fiber in 3D model. Because the inter-fiber crack is parallel with the fiber,it is easy to know that the inter-fiber crack angle can be represented by the anglein Fig. 5(c), which could be predicted with appropriate failure criteria. For the third model,the model volume divided by the crack area equals the face A'EH'D'' divided by the line L''M'', which means that the calculation offor the 3D model degenerates into the CEL calculation of A'EH'D''. The angle ∠EH'D'' could be deduced by the vector calculations, as follows:

The modified maximum stress failure criterion [Zhao, Qin, Zhang et al. (2013)] is used to predict the inter-fiber crack orientation in this work. Once the inter-fiber crack anglerelative to the top surface of the element is gained, the CELcould be given as

For a wedge element, the CEL is obtained by extending a wedge model to a hexahedral model, because a single wedge element could not form a complete crack band in the FEM.As shown in Fig. 6, the formulae of the CEL for wedge elements are established using the same derivation process as in the hexahedral model. To minimize the error during the derivation of the CEL, each surface of the hexahedral model is required to be nearly rectangle. An expected extended model of the wedge element is a cube, which shows that choosing a proper extending surface of the wedge model is beneficial.
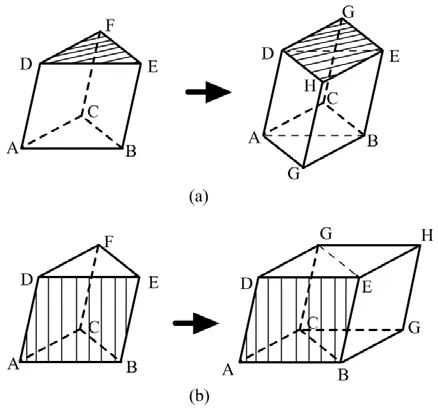
Figure 6: Extension of wedge elements: (a) fiber parallel to top face; (b) fiber parallel to side face
3 Validation of the 3D CEL model in the PDM
As the element CELs mainly affect the PDM’s objectivity when the mesh sizes change,the applicability of the CEL calculation method could be verified by observing the result variations of the PDMs that have different mesh sizes. In this paper, the CEL model of 3D elements is applied to the PDMs for open-hole laminates under tensile and compressive loading. The CEL model, failure criteria and material degradation model are embedded into the software ABAQUS®using the subroutine UMAT. The mesh independence of the numerical model is verified by comparing with the progressive damage analysis using other CEL expressions. Further, static tensile and compressive tests of the open-hole laminates are conducted to validate the numerical results.
3.1 Static tensile and compressive tests
The laminates were made of X850/IM+-190 carbon/epoxy composite materials. Four groups of open-hole plates were tested under tensile loads, which were marked as HPT-1~4. Another group of open-hole plates were tested under compressive loads, which were labeled as HPC.Each group had three specimens. The lay-up of HPT-1 was [45/0/-45/90/45/0/-45/90]s. The lay-ups of HPT-2~4 and HPC were [45/0/-45/0/90/0/45/0/-45/0]s. The thickness of each layer was 0.185 mm. The specimen configurations are shown in Fig. 7. The hole diameters for HPT-1~4 were 4.76 mm, 6 mm, 8 mm and 10 mm, respectively, and those for HPC were 6 mm. The ratio of w/d in each specimen was 6. Strengthening plates were adhesively bonded at the ends of the specimens for the test clamping. They had the same lay-ups as the open-hole laminates.
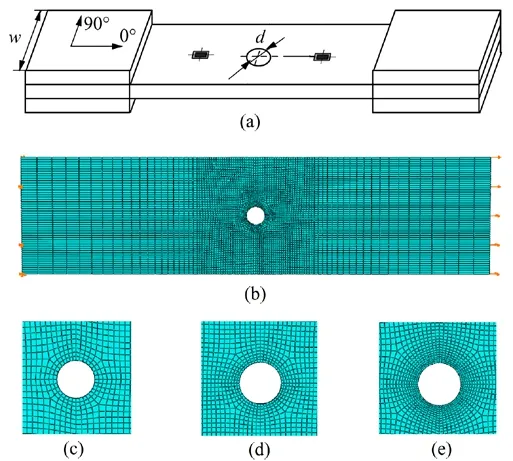
Figure 7: Dimensions and FEM of open-hole laminates: (a) dimensions; (b) global model;(c) local model of Mesh1; (d) local model of Mesh2; (e) local model of Mesh3
The tests were conducted on a 250 kN Instron 8803 testing machine. Two ends of the specimens were clamped by the testing machine. The displacement controlled load, at a rate of 2 mm/min, was applied up to the catastrophic failure of the specimens. The applied load and grip holder displacement were recorded automatically by the computer.
3.2 PDM
The 3D PDM is applied to simulate the failure process of the open-hole laminates under tensile and compressive loading. The modified maximum stress criterion [Zhao, Qin,Zhang et al. (2013)] is adopted to predict the initiation of the fiber crack and interfiber crack. The 3D gradual material degradation model [Zhao, Qin, Zhang et al. (2015)] is used to define the damage evolution and the constitutive equation of the damaged materials.
3.2.1 Failure criteria
The modified maximum criterion [Zhao, Qin, Zhang et al. (2013)] assumes that the fiber failure is mainly affected by the stress component σ11. When the stress component σ11exceeds the longitudinal tensile or compressive strength, the fiber crack onset occurs. The inter-fiber failure is caused by either the maximum tensile/compressive stress in the transversal isotropic planeor the maximum fiber-matrix shear stress.The inter-fiber crack angles are given according to the experiment observations [Maimí,Camanho, Mayugo et al. (2007a); Puck and Schürmann (1998); Puck and Schürmann(2002); Pinho, Iannucci and Robinson (2006)].
Fiber crack initiation

where Xtand Xcare the longitudinal tensile and compressive strength, respectively. The fiber crack is perpendicular to the fiber.
Inter-fiber crack onset
If any criterion among the matrix tensile failure criterion, matrix compressive failure criterion and fiber-matrix shearing failure criterion is satisfied, the inter-fiber crack onset is detected.

The fiber-matrix shearing failure is expressed as follows:

3.2.2 Material degradation model
The material degradation model is established under a local coordinate O-1'2'3' fixed to the cracks [Zhao, Qin, Zhang et al. (2015)], as shown in Fig. 8. The axis 1’ is along the normal direction of the fiber crack P(D1). The axis 2' is along the normal direction of the inter-fiber cracks P(D2) that first occur in the materials. To make it simple, assume the second inter-fiber crack P(D3) is perpendicular to the inter-fiber crack P(D2) and fiber crack P(D1).The axis 3’ is along the normal direction of the second inter-fiber cracks P(D3).

Figure 8: Definition of damage variables and coordinate systems
The material degradation model uses three damage variables, D1, D2and D3, to describe the damage: D1corresponds to the fiber crack; D2to the first inter-fiber crack; and D3to the second inter-fiber crack. The evolution of each crack obeys the linear degradation damage model except for the longitudinal compressive behavior with lateral constraints.The general expression of the damage variable is defined as

For the fiber cracks, the damage variable D1is provided as

For the inter-fiber cracks, the normal stress σN, longitudinal shear stress τLand transversal shear stress τLcould lead to the damage propagation. The most critical stress is assumed to drive the inter-fiber crack without regard to the stress interaction. The damage variable is expressed as

The PDM [Maimí, Camanho, Mayugo et al. (2007b)] has comprehensively considered the effects of the inter-fiber crack orientation, the coupling of fiber failures and inter-fiber failures under longitudinal loads, the closure effect for inter-fiber cracks, longitudinal compressive behaviors under transversal constraints, etc. The effective properties of the damaged materials are given in Tab. 1.anddenote the effective normal damage variables; andanddenote the effective shear damage variables for the inter-fiber damage. The material stiffness matrixDin the global coordinate can be further deduced with the local stiffness matrix D'. The detailed derivations are reported in reference [Zhao,Qin, Zhang et al. (2015)].
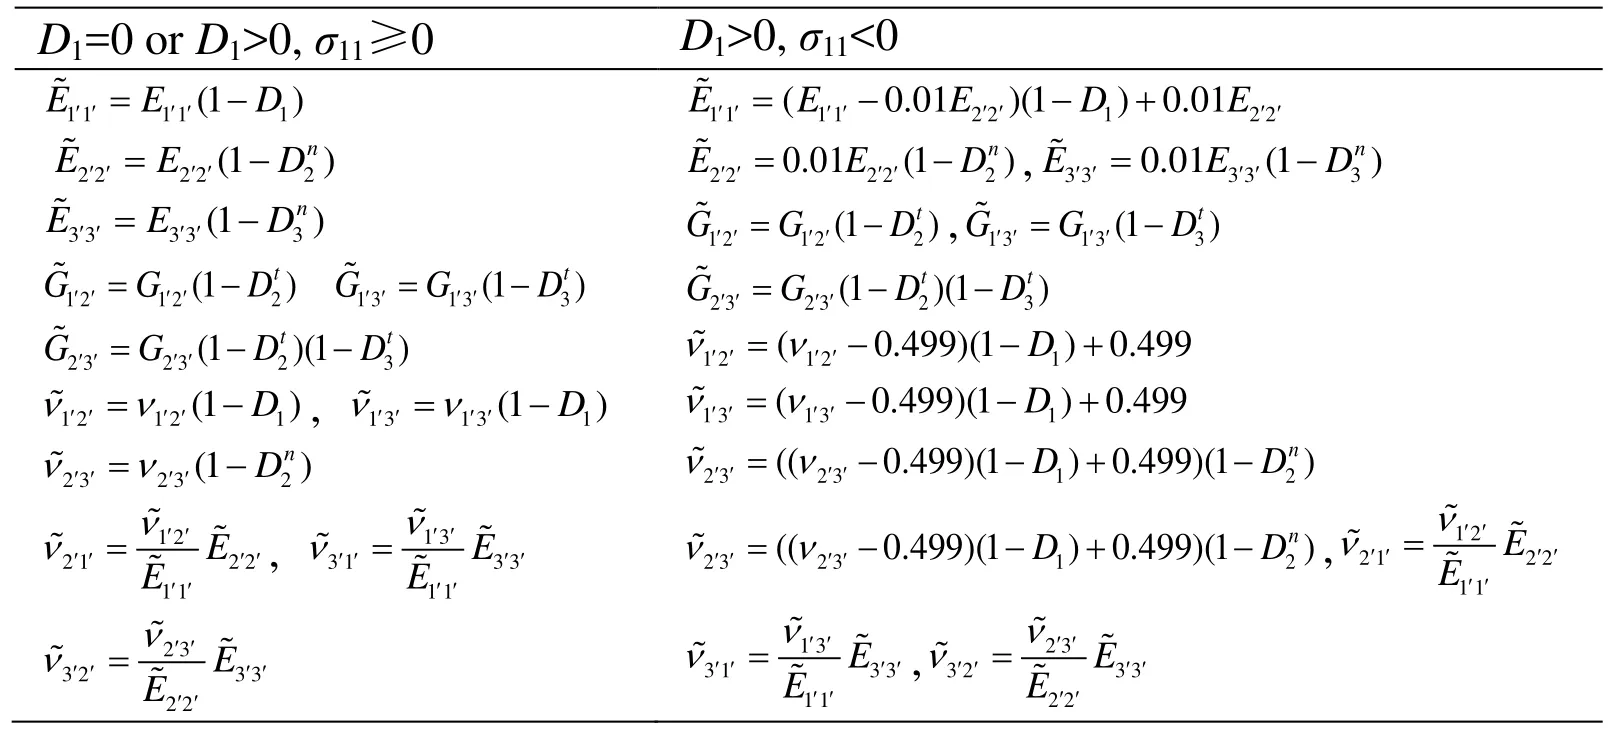
Table 1: Material parameters in 3D PDM
3.2.3 Viscous regularization
To overcome the convergence difficulties caused by the strain-softening constitutive models in the implicit analysis programs, the Duvaut-Lions viscosity model [Duvaut and Lions (1976)] is implemented.
The time derivatives of the damage variable can be defined as

where η denotes the viscous parameter, and Dvdenotes the regularized damage variable.The backward-Euler scheme is used to update the regularized damage variable for the time integration.

Because the viscous parameter will increase the energy dissipated at a material integration point that is undergoing damage evolution, it should be as small as necessary to solve convergence difficulties. A value of 0.001 is adopted in this work.
3.2.4 CELs of the element
In addition to the CEL models proposed in this work, the CEL expressions for 2D elements are simply modified for applications in 3D models. The CEL expression for the square element [Maimí, Camanho, Mayugo et al. (2007b)] is used to calculate the CEL of hexahedral elements.

where A is the average area of the top and bottom surfaces of the hexahedral elements,and θcrcis the angle of the crack direction with the mesh line of the top surface.
The CEL expression for the triangular element [Maimí, Camanho, Mayugo et al. (2007b)]is used to calculate the CEL of the wedge element.

3.3 FEM of open-hole laminates
The FEM of the open-hole laminates is established using C3D8 elements with one element per layer, as shown in Fig. 7. The meshes around the hole are refined due to the large stress gradient. The clamp sections of the laminates are not of concern and are not modeled because they are far enough from the hole. The left end of the FEM is fully restrained, while a tensile displacement in the longitudinal direction of the laminates is applied to the right end of the model. Meanwhile, the clamped areas of up and bottom surfaces are restrained in out-of-plane degree. Three mesh schemes with hole element sizes of about 0.59 mm, 0.39 mm and 0.29 mm are respectively established to evaluate the mesh independence of the PDM, which are marked as Mesh1, Mesh2 and Mesh3, as shown in Fig. 7.
Tab. 2 lists the mechanical properties of the X850/IM+-190 carbon/epoxy composite materials. The out-of-plane elastic modulus and strengths are deduced from the in-plane properties using the transversal isotropic assumption [Qin, Zhao and Zhang (2013)].

Table 2: Properties of X850/IM+-190 carbon/epoxy composite materials
3.4 Results and discussion
Figs. 9(a) and 9(b) provide the predicted load-displacement curves of HTP-1 and HPC by the PDMs using the CELs proposed here and in the literature. Three different mesh schemes are adopted for each case. With the FE model mesh changing, the predicted load-displacement curves are closer for models that use the CELs proposed here in both the tensile and compressive cases. For the laminates that have a lower proportion of 0°plies, such as HPT-1 specimens, the mesh independence improvement by the proposed CELs is more obvious because the inter-fiber damage plays a more important role in the structural failure process. The comparison in both the tensile and compressive predictions indicates that the proposed CEL models can effectively ensure the mesh independence of the PDM.
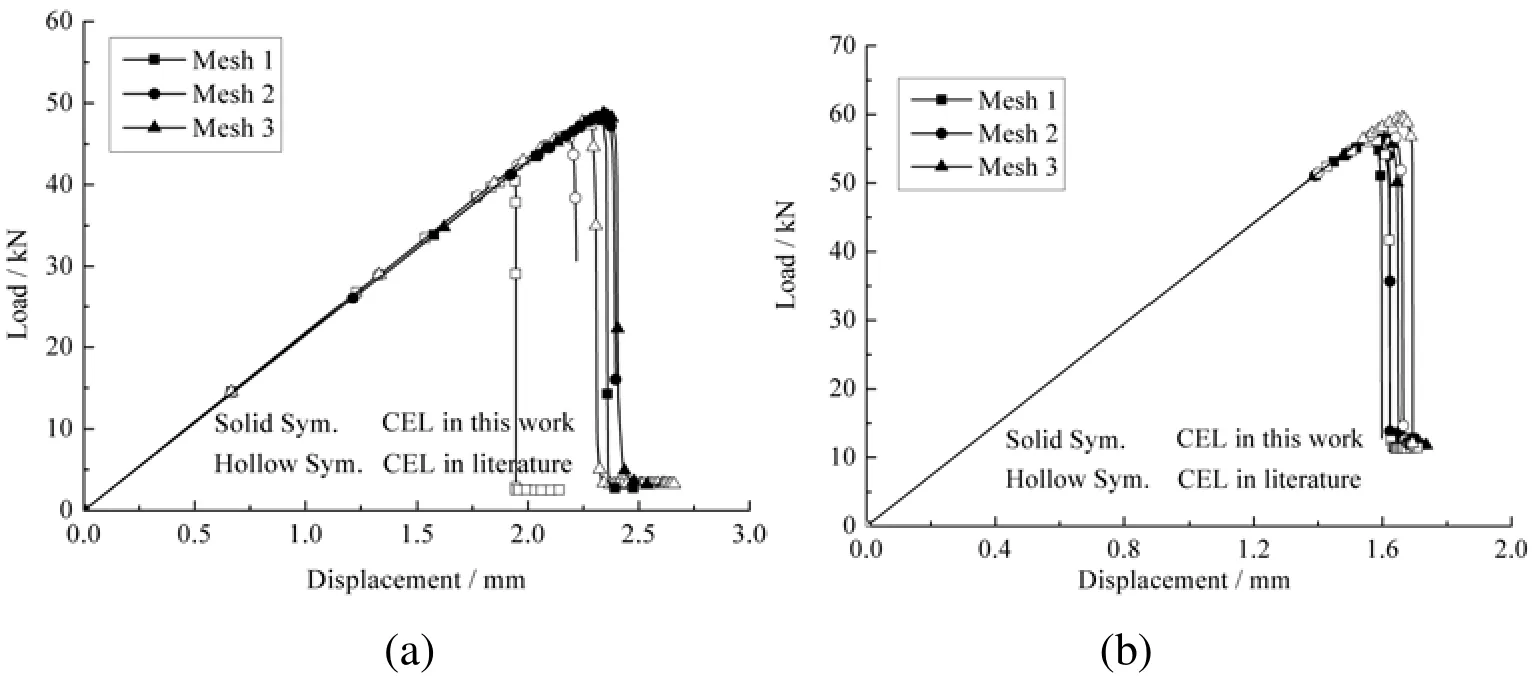
Figure 9: Predicted load-displacement curves of open-hole laminates by PDMs using different CELs: (a) HPT-1; (b) HPC
Figs. 10(a) and 10(b) illustrate the typical experimental and numerical load-displacement curves for open-hole laminates in the tensile and compressive tests. The numerical models predict the plate stiffness changes well under both tensile and compressive loads. Tab. 3 lists the experimental and numerical ultimate failure loads. It can be seen that when the hole diameter, ply sequence and load change, the errors in the numerical results are between-5.9% and 2.3%. The numerical results are very close to the experimental results.

Figure 10: Experimental and numerical load-displacement curves of open-hole laminates:(a) results in tension; (b) results in compression

Table 3: Experimental and numerical ultimate failure loads
Fig. 11 and Fig. 12 show the predicted inter-fiber damage and fiber damage accumulation in HPT-1 under the tensile load. The colored areas represent the damage zone, in which the blue denotes the damage onset and the dark red denotes severe damage. Tab. 4 lists the damagepropagation in different plies of HPT-1.The inter-fiber damage first occurred in the 90° plies at 29.5 kN (1.36 mm of displacement). When the load went up to 40.3 kN(1.88 mm of displacement), new inter-fiber damage occurred in the 0° plies and 45° plies.Meanwhile, slight fiber damage was detected at the hole edge in the 0° plies. Before 43.8 kN (2.05 mm of displacement), the inter-fiber damage propagated slowly along the cross-section of the plate. When the load reached the peak of 48.4 kN (2.32 mm of displacement), serious inter-fiber damage occurred in all of the plies near the hole, and the propagations of fiber damage in the 0° plies were obvious. Little fiber damage appeared away from the hole edge in the 45° plies. Afterward, the load decreased sharply.When the displacement was 2.36 mm, the load decreased to approximately 2 kN. The inter-fiber damage regions in the 0° plies were usually straight along the plate section.However, the inter-fiber damage in the 45° plies and 90° plies spread near the plate edges,which formed the triangle damage zone. For fiber damage, the propagation paths in the 0°plies turned to the 45° direction near the plate edges. The fiber damage in the 45° plies propagated almost straight in the middle regions. Scattered fiber damage in the 45° plies occurred near the plate edges. No serious fiber damage was predicted in the 90° plies.The damage accumulation in all of the plies formed a relatively straight tensile fracture at the middle region and the complex damage zone near the edges.
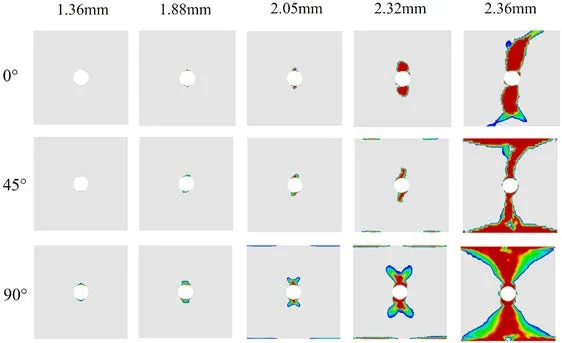
Figure 11: Inter-fiber damage accumulation of HPT-1 in tension
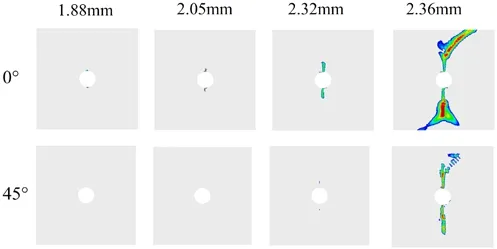
Figure 12: Fiber damage accumulation of HPT-1 in tension
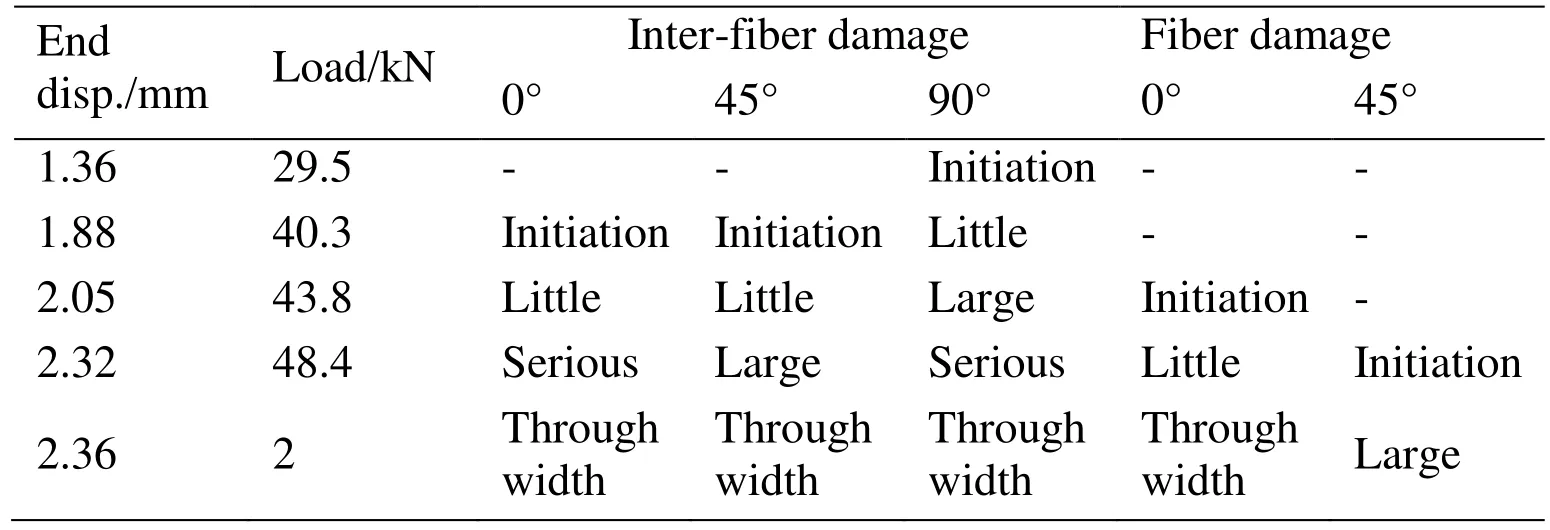
Table 4: Damage accumulation of HPT-1 in tension
Fig. 13 shows the final failure morphologies of HPT-1 predicted by the PDM using the proposed CEL models and obtained from the experiments. Three simulations with different mesh sizes were carried out to investigate the damage propagation in HPT-1 under tensile load. No damage and sounds were found before a sudden failure in the experiments. A dominant fracture crossed the open-hole plate. The outer 45° plies near the plate edges were peeled off, as shown in Fig. 13(a). Similar failure morphologies were predicted by the PDM. The gray areas in Fig. 13(b) describe the severe damage,which exhibits a relatively straight fracture near the hole. Serious inter-fiber damage near the plate edges makes the fracture uneven.
Fig. 14 and Fig. 15 show the predicted inter-fiber damage and fiber damage accumulation in HPC under compressive loads. Tab. 5 lists the damagepropagation in different plies.The inter-fiber damage initiated in the 0°, 90° and 45° plies at 47.9 kN, 49.0 kN and 50.1 kN (1.30 mm, 1.33 mm and 1.36 mm of displacement), respectively. The fiber damage in the 0° plies were at 47.9 kN, and in the 45° plies were at 56.8 kN (1.57 mm of displacement). When the load reached the peak of 57.2 kN (1.60 mm of displacement),the inter-fiber damage in all of the plies and the fiber damage in the 0° plies propagated to a certain distance along the cross section. The development of fiber damage in the 45°plies was slight. The compressive load decreased sharply after the peak point. The inter-fiber damage in all of the plies and the fiber damage in the 0° and 45° plies extended to the plate edges rapidly. Little fiber damage occurred in the 90° plies. The damage accumulation in all of the plies formed relative straight fractures at the middle regions. The final fracture formed by the damage accumulation was relatively straight at the middle regions and turned at a certain angle near the plate edges.
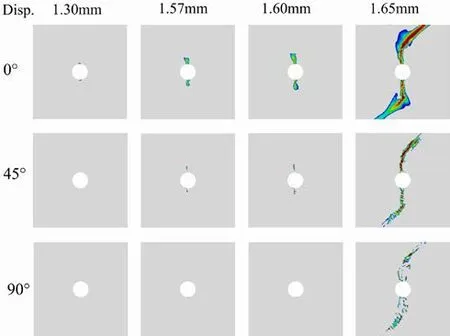
Figure 15: Fiber damage accumulation of HPC in compression
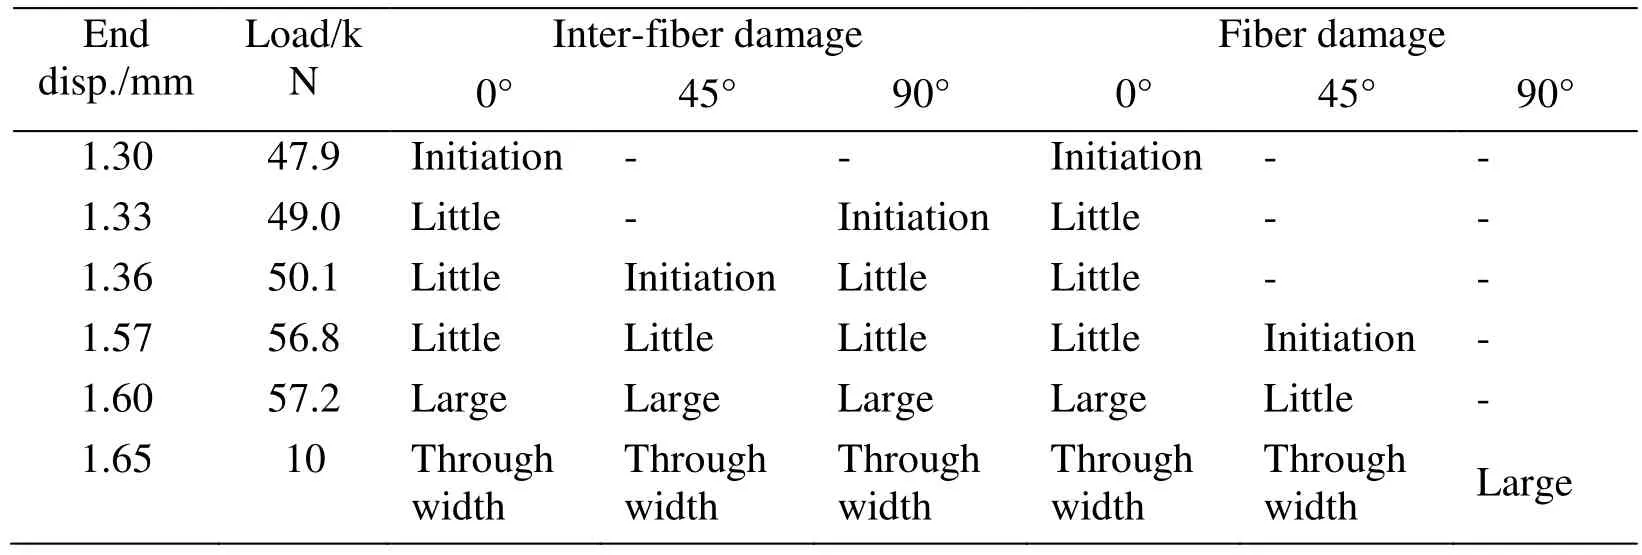
Table 5: Damage accumulation of HPC in compression
Fig. 16 shows the experimental and numerical failure morphologies of HPC. A dominant fracture is observed crossing the open-hole plate in the experiment. In addition, obvious delamination could be found from the side viewpoint. The PDMs provide similar failure morphologies with the experiment results, including the deformation of the delaminated plies, which indicates the good agreement between the numerical and experimental results.

Figure 16: Failure morphologies of HPC in compression: (a) From experiments; (b)From numerical predictions
4 Conclusions
Due to various crack directions in 3D elements for progressive damage analyses, the CEL is difficult to calculate but essential to ensure the objectivity of the progressive damage analyses. The CEL models for 3D elements in progressive damage analyses of unidirectional composite structures are proposed, which account for various fiber and inter-fiber crack directions in the 3D elements to obtain relatively accurate CELs. The PDM of open-hole laminates under tensile and compressive loading was established with the CEL models proposed, which was simply extended from 2D CELs. The numerical results show that the proposed CEL models can better improve the mesh independence of the numerical models. In addition, tensile and compressive tests of the open-hole laminates were conducted. Good agreements between the numerical and experimental results further validate the PDM with the proposed CEL models.
Acknowledgments:This research is supported by the National Natural Science Foundation of China (11772028, 11872131, 11702012, U1864208, 11572058 and 11372020).
 Computer Modeling In Engineering&Sciences2019年1期
- Computer Modeling In Engineering&Sciences的其它文章
- Nonlinear Activation Functions in CNN Based on Fluid Dynamics and Its Applications
- Efficient Solution of 3D Solids with Large Numbers of Fluid-Filled Pores Using Eigenstrain BIEs with Iteration Procedure
- Development of Non-Dissipative Direct Time Integration Method for Structural Dynamics Application
- A Trajectory Planning-Based Energy-Optimal Method for an EMVT System
- LiToTac: An Interactive-Interface Software for Finite Element Analysis of Multiple Contact Dynamics
- Centrifuge Model Tests and Numerical Simulations of the Impact of Underwater Explosion on an Air-Backed Steel Plate
