Flow imbalance in MHD flows in splitting ducts with locally different electric conductivities of the walls *
Yang Luo , Mengqi Zhu , C.N.Kim
1. Department of Mechanical Engineering, Graduate School, Kyung Hee University, Yong-in, Korea
2. Department of Mechanical Engineering, College of Engineering, Kyung Hee University, Yong-in, Korea
Abstract: In this study, three-dimensional liquid-metal magnetohydrodynamic splitting flows in a duct with one inflow channel and two outflow channels with locally different wall electric conductivities (different conductance ratios) are computationally examined.The numerical calculation is achieved with the use of CFX code, with a structured grid system chosen after a series of mesh independence tests.The detailed features of the MHD flows are depicted in a case where the electric conductivities of the two outflow ducts are quite different.Also, the interdependency among the current, fluid velocity, pressure and electric potential is elucidated in order to describe the electromagnetic characteristics of the liquid-metal flows.The result shows that the imbalance of the mass flow rate in the two outflow channels strongly depends on the wall conductivity (i.e., conductance ratio) of each outflow channel.
Key words: Liquid metal flow, splitting duct, flow imbalance, numerical examination, conductance ratio
Introduction
Magnetohydrodynamic (MHD) flow is a field of a great interest in engineering applications, especially important in the design of liquid-metal (LM) cooling system of fusion reactors.In the fusion blanket the liquid metal can serve both as breeder material and as coolant.During several decades numerous works have been carried out on LM MHD flows in the fusion blanket.In order to design a good system for liquid metal flows, pressure drop ought to be minimized, and velocity distribution should be proper for good heat transfer.
Many experimental studies have been performed to investigate the features of liquid metal MHD flows in ducts.Barleon et al.[1]discussed many different issues related to self-cooled blankets and MHD key problems of the Kernforschungszentrum Karlsruhe(KfK) reference concept (KfK has been engaged in the development of a self-cooled liquid-metal blanket whose liquid metal serves both as breeder material and as coolant).Stieglitz et al.[2]experimentally investigated the flow in right-angle bends, in which a flow in a direction perpendicular to the magnetic field is changed to one that is parallel to the field.Kirillov et al.[3]introduced many different experiments on LM MHD flows, and discussed recent progresses on liquid metal magnetohydrodynamic duct flows.Bühler et al.[4]performed experiments to analyse the MHD flows through electrically conducting sudden expansions of rectangular ducts at high Hartmann numbers.Numerous mathematical methods have been presented to investigate the features of the LM MHD flows in an electrically conducting duct.A laminar buoyant MHD flow in vertical rectangular ducts had been solved mathematically by Bühler[5].Cuevas et al.[6]obtained a mathematical solution of fully developed liquidmetal MHD flows in rectangular ducts for laminar and turbulent flows.Asymptotic techniques, which are focused on the analysis of the MHD flows in rectangular ducts with variable cross-sectional areas,had been performed by Walker and Ludford[7].In order to make the analysis of MHD flows in a viscoelatic liquid easier, Siddheshwar and Mahabaleswar[8]adopted a mathematical method with an inertia less approximation.Since experimental works need largesized equipment and mathematical studies may not clearly solve three-dimensional flow characteristics well, numerical studies for three-dimensional MHD flows have been lately performed with various codes developed by respective researchers.Therefore, the numerical method for the analysis of LM MHD flows has been advanced much.Ni et al.[9]implemented a consistent and conservative scheme in a threedimensional code based on a solution method for the electric potential equation.Zhou et al.[10]used structural collocated grids in their computational code that can predict LM MHD flows in rectangular ducts.Albets-Chico et al.[11]established “core-solution approximation” that models liquid metal flows under intensive magnetic field.
Many different numerical approaches have been established in order to investigate the features of LM MHD flows.Piazza and Bühler[12]employed CFX code to present a numerical simulation of buoyancydriven magnetohydrodynamic flows in a duct.Kim et al.[13]performed the code validation for CFX, and reported that CFX can predict the pressure drop well.Reimann et al.[14]performed the assessment of pressure drop in components where strong threedimensional electric current is induced, together with the multi-channel effects in LM MHD duct flows.A three-dimensional numerical simulation for an LM MHD duct flow is performed by Mao and Pan[15].Arshad et al.[16]numerically investigated the LM flows parallel and then perpendicular to the magnetic fields in a curved bend, the results showed that when the liquid metal flows increasingly in the transverse direction of the magnetic field, the MHD pressure drop increases.
Though many analytic, experimental and numerical studies on MHD duct flows have been recently performed, detailed flow characteristics of LM MHD flows in a splitting duct under a uniform magnetic field scarcely have been reported.In the splitting duct flow system the cross-sectional area of the split duct may not closely related to the mass flow rate of coolant in the corresponding split duct since the existence of the side layer near a side wall may contributes much to the mass flow rate in the corresponding split duct.Therefore, the conductance ratio of the multiple split ducts can play a more important role in the determination of the mass flow rates in the multiple split ducts than the crosssectional area of the multiple split ducts.In the current study, three-dimensional MHD flows in a splitting duct under a uniform magnetic field perpendicular to the plane of flow are numerically analyzed by using CFX code, with the aim of examining the effect of the conductance ratio of the split duct on the flow imbalance in the multiple split ducts.
1.Problem formulation and solution method
1.1 Geometry, magnetic field and materials

Fig.1 (Color online) Duct geometry, coordinate system and an applied magnetic field (mm)
Thepresentstudyinvestigatesasteady-state,constant-property and laminar flows of an incompressible and electrically conducting liquid-metal (Pb-17Li) fluid under an external magnetic field.The geometry of the duct is shown in Fig.1.Applied in thex-direction is a uniform magnetic fieldcorresponding to Hartmann number 1 000.The conductance ratio and Hartmann number can be written as follows:
Conductance ratio

Hartmann number

whereσsis the electrical conductivity of the duct wall,tis the thickness of the duct wall,fσis the electrical conductivity of the fluid,Lis the side length of the flow conduit cross-section,B0is the magnetic field strength,Dis the characteristic length, (i.e., 0.05 m, the half-length of a side of the flow conduit cross-section),fμis the dynamic viscosity of the fluid, respectively.In the present study,the detailed information about the flow variables is discussed in a situation with the same Hartmann number and different conductance ratios in the two outflow channels.Properties of the working fluid and the walls are given in Tables 1, 2, respectively.

Table1 Material properties
1.2 Governing equations
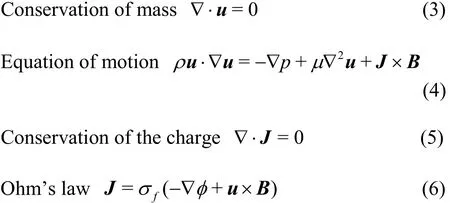
The system of governing equations for a steadystate, incompressible, constant-property, laminar, LM MHD flow includes the conservation of mass, equation of motion, conservation of charge and Ohmʼs law,which can be written as:

whereuis the velocity vector,ρis the fluid density,pis the pressure,μis the dynamic viscosity,Jis the current density vector,σis electric conductivity,Bis the magnetic field intensity vector andφis the electric potential, respectively.
The combination of Eq.(5) and Eq.(6) gives the following equation of Poisson type for the electric potential

Therefore, for a liquid metal magnetohydrodynamic flow, the variables of the pressure, velocity and electric potential can be solved by Eqs.(3), (4) and (7).In addition, because the velocity in the solid region is zero, only Eq.(7) is to be solved with zero source term therein.
1.3 Boundary conditions
At the fluid-solid interface no slip condition is applied.A uniform velocityu=0.01m/s is applied at the inlet, and at the outlets there is no spatial change in the variables (except for the pressure) along the main flow direction.And the pressure value at the outlets is considered to be zero.It is presumed that the whole system including the fluid and duct walls are electrically insulated from the outside.
1.4 Numerical method
A structure grid system with 4 150 852 grids is used for the simulation.Finer grids are employed in the fluid region near the walls and in the transition segment.For discretized equations Multigrid-accelerated Incomplete Lower Upper factorization technique[17]is used.Rhie-Chow Interpolation method[18]is employed for the pressure-velocity coupling.Under-relaxation is utilized in the iteration procedure for the coupled governing equations.The second-order upwind scheme is applied to discretize the convective terms,and the central difference scheme is adopted for diffusion terms.For the validation of the present numerical modelling with the use of CFX code, Ref.[19]can be consulted.

Table2 Cases with different conductance ratios

Table3 Mass flow rate
2.Results and discussions
2.1 Mass imbalance for cases 1-4
The effect of the conductance ratio on the distribution of mass flow rate in the two outflow channels in cases 1-4 (see Table3) is investigated.In the three cases (except case 1), the mass flow rate in the right outflow channel with lower electric conductivity is relatively higher than that in the left outflow channel, showing a meaningful imbalance in the mass flow rate.When the conductance ratio of the right outflow channel is smaller (with the same Hartmann number in the inflow channel), the mass flow rate in the right outflow channel is larger (i.e.,the difference in the mass flow rate between the left and right outflow channels is larger).
2.2 Analysis of case 4
In the present situation, the electric conductivity of the inflow channel and left outflow channel is 107S/m,while that of the right outflow channel is 4×10⁶S/m.The characteristics of the flow field will be examined in several local regions (that is, in the inflow channel,in the transition segment, and in the outflow channels),and then the features of the pressure in the whole region will be discussed.
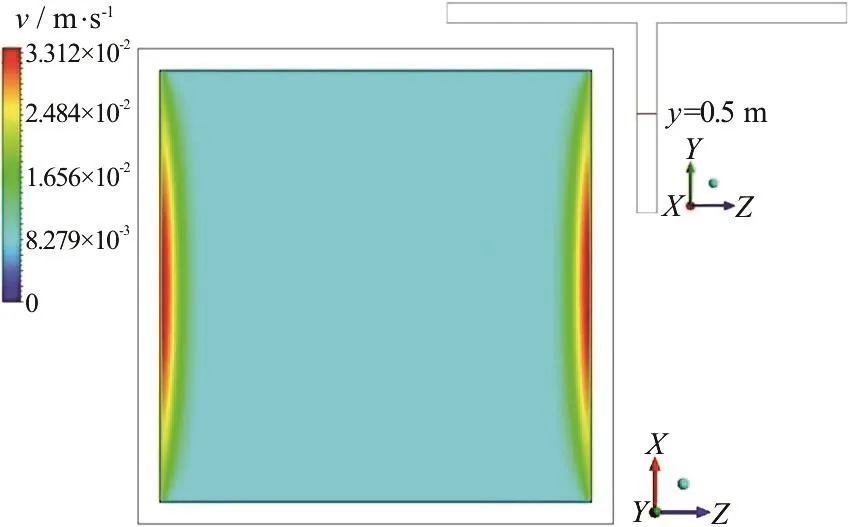
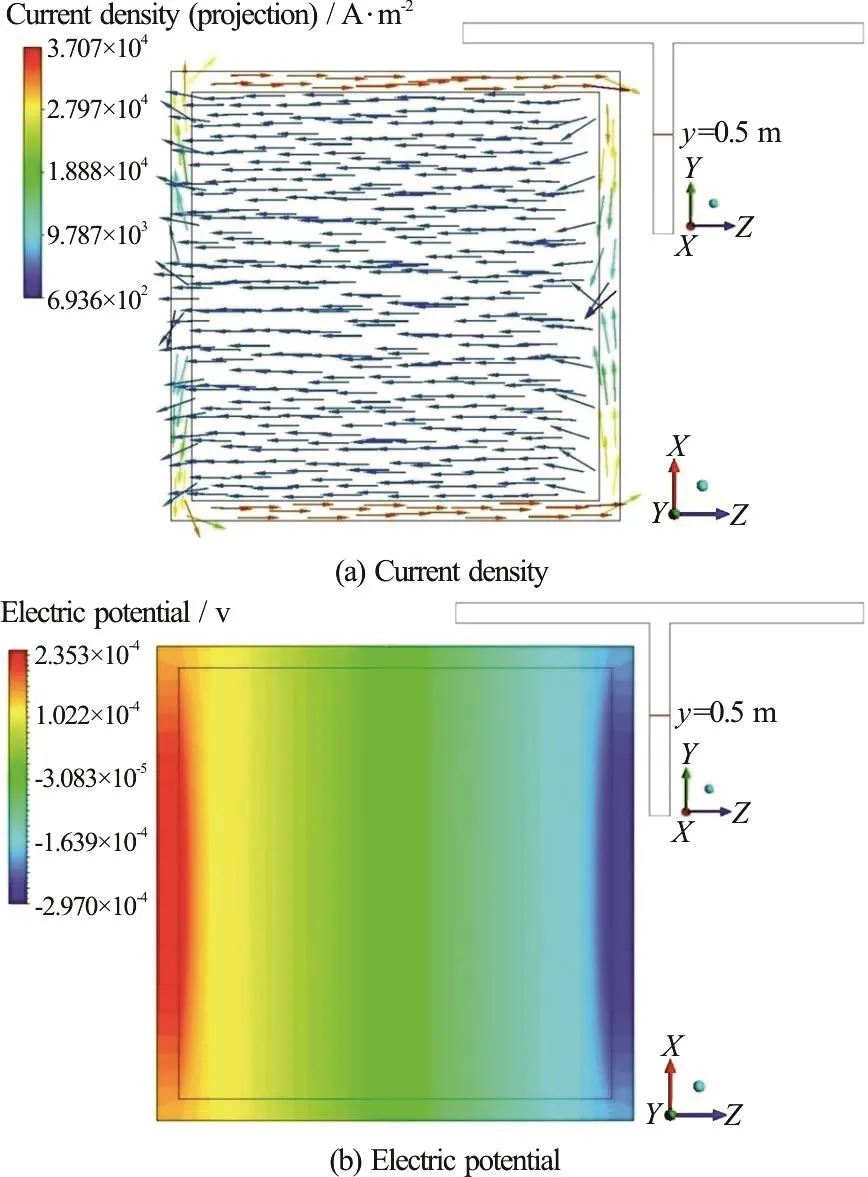
The distribution of axial velocity in thez-xplane aty=0.500m in case 4 is shown in Fig.2,where higher axial velocities are observed in the side layers, forming “M-shaped” profile.Figure 3 displays the distributions of the current density and electric potential in thez-xplane aty=0.500m .The current flows from the right side to the left side in the fluid region, and then returns to the right side wall through the duct walls.As can be seen in Fig.3(b), a higher electric potential is induced in the fluid region near the left side wall, while a lower electric potential is observed in the fluid region near the right side wall.

Fig.2 (Color online) Distribution of the axial velocity in the z - x plane at y = 0.500 m in case 4

Fig.3 (Color online) Current density and electric potential in the z - x plane at y = 0.500 m in case 4
When the inertia and viscous forces are negligible, the equation of motion can be simplified as:

when only they-directional component of the above equations is considered, the following expression can be obtained

The value of the second term on the right side of Eq.(10) in the fluid region very near the left wall and right wall in Fig.3(b) is much larger than that in the middle part of the fluid region.This means that the fluid velocity in the fluid region very near the left and right wall (where the local change in the electric potential is very large) should be larger than that in the middle part (where the local change in the electric potential is very small) of the fluid region.
The detailed velocity distributions in the midx-yplane (atx= 0.055m) around the transition segment in case 4 are displayed in Fig.4.The fluid flows in they-direction in the inflow channel, and then the fluid changes the direction in the transition segment to flow in the positive and negativezdirection in the right and left outflow channels, respectively.Meanwhile, a clockwise velocity recirculation is observed above the right edge of the transition segment, and a counter-clockwise one is formed above the left edge of the transition segment.This velocity recirculation may yield a hot spot in association with volumetric heating in the blanket.As shown in the Fig.4(b), a larger crescent of high velocity is observed in fluid region just above the right edge of the transition segment, while the crescent of high velocity is much smaller in fluid region near the left edge of the transition segment.It is associated with the fact that the mass flow rate through the right outflow duct is larger than that through the left outflow duct because the electric conductivity of the right outflow duct is smaller than that of the left outflow duct, as shown in Table2.In the velocity recirculation, lower velocity regions are formed below each crescent of high velocity.

Fig.4 (Color online) Plane velocities in the mid y - z plane at x = 0.055m around the transition segment in case 4
Figure 5 shows the distributions of the current density and electric potential in the midy-zplane atx= 0.055m around the transition segment.In the inflow channel, the current heads to the left wall in the fluid region.In the transition segment, the current flows in a round way radially from the region near the right edge to that near the left edge.In the right outflow channel, the current heads upward, while in the left outflow channel it heads downward.As can be seen in Fig.5(b), higher electric potential is formed in the fluid region near the left side wall of the inflow channel, near the bottom wall of the left outflow channel and near the top wall of the right outflow channel, while lower electric potential is observed in the fluid region near the right side wall of the inflow channel, near the bottom wall of the right outflow channel and near the top wall of the left outflow channel.More specifically, in the transition segment,a domain with higher electric potential is observed in fluid region just above the left edge, while a domain with lower electric potential is induced in fluid region just above the right edge.

Fig.5 (Color online) Current density and electric potential in the mid y - z plane at x = 0.055m around the transition segment in case 4
Thex-directional velocities in the planes of the entrance of the two outflow ducts (i.e., those located atz= 0.005 m, 1.005 m) are depicted in Fig.6.Figure 6(a) indicates that in the fluid region near the top wall of the left outflow duct the fluid converges toward the centerline (i.e.,x=0.055m), while in the fluid region near the bottom wall the fluid diverges from the centerline.The magnitude of this velocity is an order of 0.001 m/s (around 10% of the inlet velocity at the inflow duct).The above fluid motion is frequently observed when a liquid metal turns its direction abruptly.Also, in the narrow fluid region very near the top wall of the right outflow duct the fluid also converges toward the centerline (i.e.,x= 0.055m), while in the fluid region very near the bottom wall the fluid converges to the centerline and in the fluid region a little distant from the bottom wall the fluid diverges from the centerline.The difference in the flow pattern between the two cross-sections is due to the difference in the conductance ratio between the left and right outflow duct.

Fig.6 (Color online) X-directional velocity
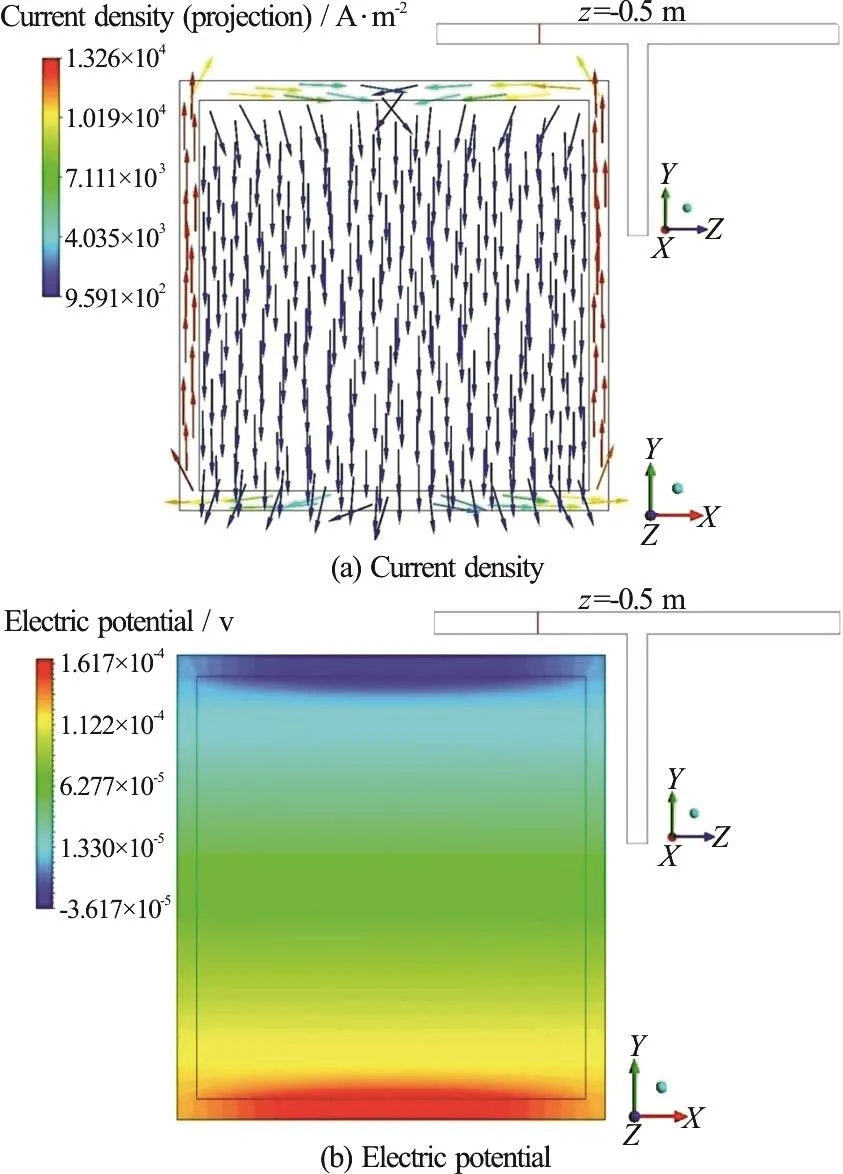
The distributions of the current density and electric potential in thex-yplane atz= - 0.500m are shown in the Fig.7.The current heads downward in the fluid region, then returns to the top wall through the duct walls.The electric potential is higher in fluid region near the bottom of the left outflow channel.The distributions of the current density and electric potential in thex-yplane atz= - 0 .610m (in the right outflow channel) are almost opposite to the distributions of those in thex-yplane at = 0.500mz-(in the left outflow channel), respectively.
The axial velocities (absolute value) in the inflow and outflow channels at different cross-sections (the cross section A, B and C) are obtained, showing“M-shaped” velocity profiles, as shown in Fig.8.Generally, the axial velocities in the side layers are much higher than those in the other fluid regions.More precisely, the axial velocities in the cross section A (in the inflow channel) are higher than those in the outflow channels in relation with the continuity.As for the velocities in the outflow channels, the axial velocities in the side layers of the right outflow channel (at the cross section C) are higher than those of left outflow channel (at the cross section D), in association with the fact that there is a difference in the electric conductivity between the left and right outflow ducts.

Fig.7 (Color online) Current density and electric potential in the x - y plane at z = -0.500 m in case 4

Fig.8 (Color online) “M”-shaped axial velocities at different cross-sections
With the pressure value fixed at zero at the outlets, the distribution of the pressure along the centerline of the main flow is displayed in Fig.9.As shown, the pressure almost linearly decreases in the inflow and outflow channels.In the transition segment,the pressure change is smaller.More specifically, the pressure gradient of the inflow channel is the largest in association with the fact that the average axial velocity in the region of the inflow channel are higher,yielding higher current density leading to higher Lorentz force and pressure gradient.In addition, the average non-dimensional pressure gradients (∇p/in the inflow channel, in the left outflow channel and in the right outflow channel are evaluated to be 0.228, 0.227and 0.138, respectively.
The flow imbalance can be discussed with the equation of motion in the following way.When the inertia and viscous forces are negligible, the equation of motion can be simplified as:

When only thez-directional component of the above equations is considered, the following expression can be obtained

In the left channel, since the values ofuzand |φ∂∂yare negative, Eq.(13) can be written in the following way where the subscriptLmeans a variable for the left channel.

If (-1) is multiplied to Eq.(14), the following equation can be obtained

In the right channel, Eq.(13) can be reduced to

where the subscriptRimplies a variable for the right channel.
The first term in each of Eqs.(15), (16) are almost the same (see Fig.9).Since the second term in the RHS of Eq.(16) is larger than that of Eq.(15) (see Fig.5), the third term in the RHS of Eq.(16) should be smaller than that of Eq.(12).That is


The above discussion explains the mechanism of the flow imbalance, where the mass flow rate in the right channel is larger than that in the left channel.This statement is based on the fact that the absolute value of dφ/dyin the right channel with lower electric conductivity is larger than that in the left channel.
3.Conclusions
This numerical study investigates three-dimensional LM MHD flows in a splitting duct under a uniform magnetic field with the use of CFX, and presents a detailed analysis of the flow velocity,pressure gradient, current density and electric potential of the LM MHD duct flow.
In this study, the duct system consists of one inflow channel and two outflow channels with different conductance ratios.In consideration that the electric conductivity of a wall in an MHD flow has great influence on the mass flow rate in the corresponding channel, the flow characteristics of several cases with different conductance ratios of an outflow channel are examined with a fixed conductance ratio of the other outflow channel.
The results show that the mass flow rate in one outflow channel with a lower electric conductivity(with a lower conductance) is higher than that in another outflow channel with a higher electric conductivity (with a higher conductance).And, the detailed flow features in a splitting duct system are analyzed.
It is well known that in the design of an MHD flow system, the mass flow rate of an MHD flow in a duct may not directly be proportional to the crosssectional area because of the existence of a side layer.Therefore, an arrangement of different electric conductivities in different walls can be a good method in determining the mass flow rates of liquid metal in a splitting duct system.
Acknowledgement
This work was supported by the National R&D Program through the National Research Foundation of Korea (NRF) funded by the Ministry of Future Creation (2015M1A7A1A02050613).
- 水动力学研究与进展 B辑的其它文章
- Call For Papers The 3rd International Symposium of Cavitation and Multiphase Flow
- Improving the real-time probabilistic channel flood forecasting by incorporating the uncertainty of inflow using the particle filter *
- A selected review of vortex identification methods with applications *
- Tracer advection in an idealised river bend with groynes *
- Simulation of the overtaking maneuver between two ships using the non-linear maneuvering model *
- The effect of downstream resistance on flow diverter treatment of a cerebral aneurysm at a bifurcation: A joint computational-experimental study *

