Effects of rotational speed and fill level on particle mixing in astirred tank with different impellers
Yuyun Bao,Yu Lu,Ziqi Cai*,Zhengming Gao
State Key Laboratory of Chemical Resource Engineering,School of Chemical Engineering,Beijing University of Chemical Technology,Beijing 100029,China
Keywords:Particle Mixing Discrete element method(DEM)Rotational speed Fill level Lacey index
A B S T R A C T The particle mixing was studied in a cylindrical stirred tank with elliptical dished bottom by experiments and simulations.The impeller types used were double helical ribbon(HR)+bottom HR,pitched blade ribbon+bottom HR,inner and outer HR+bottom HR,and pitched blade ribbon+Pfaudler+bottom HR labeled as impellers I to IV,respectively.The quantitative correlations among the rotational speed, fill level and power consumption for impeller I and impeller II were obtained by experiments to validate the discrete element method(DEM)simulations.The particle mixing at different operating conditions was simulated via DEM simulations to calculate the mixing index using the Lacey method,which is a statistical method to provide a mathematical understanding of the mixing state in a binary mixture.The simulation results reveal that as the rotational speed increases,the final mixing index increases,and as the fill level increases,the final mixing index decreases.At the same operating conditions,impeller III is the optimal combination,which provides the highest mixing index at the same revolutions.
1.Introduction
Particle mixing is widely used in the pharmaceutical processes[1],chemical engineering[2],food processing[3],metallurgy[4],etc.The mixing performance,which is usually characterized by the degree of mixing,is of paramount importance to the quality of products in industrial processes.The particle mixing degree is mostly evaluated by sampling in the experiments[5].Previous researchers have investigated particle mixing at different operating conditions by experimental methods.Brone et al.[6]and Simons et al.[7]studied the effect of rotational speed, fill level and total number of revolutions on the mixing performance in a conventional double-coneblender and ahelical ribbon blade blender by sampling,respectively.Pantaleev et al.[8]found that the mixer should be periodically stopped for scooping the powder for sampling,and this method can only evaluate overall mixing degree[9].Poux et al.[10]stated that such experiment has the disadvantage of changing the structure of mixture when sampling.As a conclusion,the method of sampling to obtain the mixing index has a great effect on the accuracy of the experiment.On the one hand,the invasive sampling method disturbed the movement of particles and the distribution of particles.On the other hand,if the mixer was periodically stopped on account of the sampling,the continuous experiment was affected,it may cause the error on the results.
In recent years,numerical simulation techniques have been adopted by a growing number of researchers[11].Discrete element method(DEM),originally proposed by Cundall and Strack[12],provided a new method to study the particle mixing[13].Chandratilleke et al.[14]and Siraj et al.[15,16]obtained the effects of the blade shape,blade angle and particle size on the particle mixing behavior with a single blade through a bed of binary mixture via DEM simulations.The devices used in the simulations were simple,and it is necessary to understand the particle mixing behaviors in much complex systems like in stirred tanks.In the DEM study on stirred tanks,Remy et al.[2],Chandratilleke et al.[17],Havlica et al.[18]and Boonkanokwong et al.[19]investigated the effects of the operating conditions on the particle mixing in cylindrical vertical mixers with bladed impeller,including the fill level,rotational speed and number of impeller blades.These researches focused on the bladed impellers in the stirred tank.How ever,it is lack of the study of the near wall helical ribbon impellers which are often used in the industrial particle mixing.Therefore in this study,the particle mixing in a vertical stirred tank with differently designed helical ribbon impellers was investigated with DEM simulations.
The paper is based on the production engineering of the zeolite molecular sieve in petrochemical industry.The characteristic of the zeolite synthetic reaction is to start with the particles mixed in the stirred tank,and then the alkaline liquor added into the particles mixture,and with the progress of reaction between the particles and alkaline liquor,the particle mixture turned into a high viscous fluid.The objective of this paper is to investigate the particle mixing performance described as the first stage in the synthetic process in a traditional vertical stirred tank including the power consumption and the mixing index based on the Lacey method[20]of four different impeller combinations.The quantitative correlations for different impellers were obtained and the optimal impeller combination was recommended.

Fig.1.Schematic of stirred tank and combined impellers.
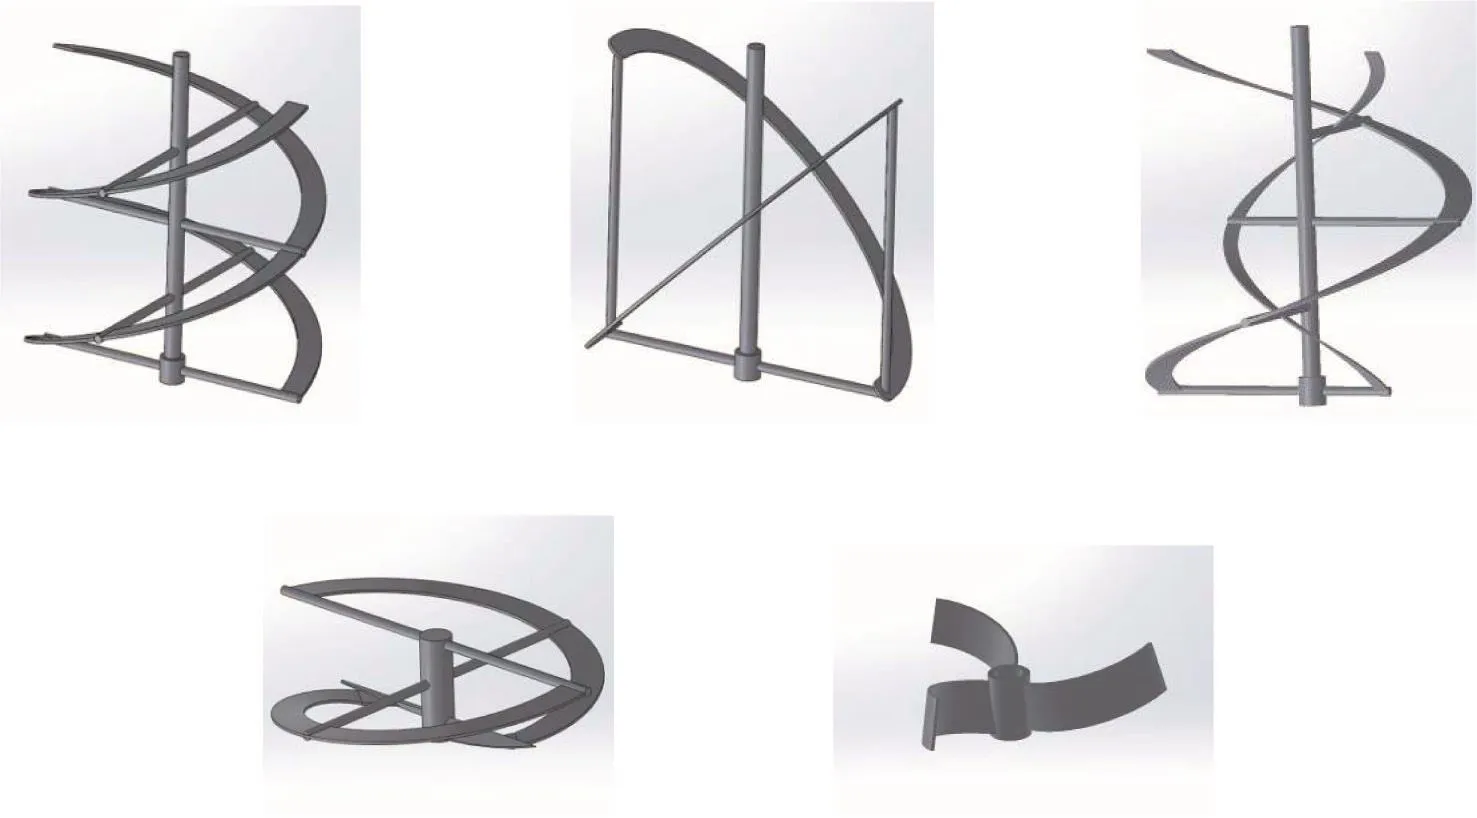
Fig.2.Schematics of the five different impellers.
2.Experimental and Numerical Setup
2.1.Physical model
A cylindrical stirred tank with elliptical dished bottom with a diameter T of 284 mm was used for both experiments and simulations,as shown in Fig.1a.The height-to-diameter ratio H/T was 1.145,1.205 and 1.272 for simulation.There are five impellers named double helical ribbon(HR),pitched blade ribbon,inner and outer HR,bottom HR and Pfaudler used in this study as presented in Fig.2.The dimension information of impellers is listed in Table 1.These five impellers can becombined in four ways as named in Table2,and the schematic of each impeller isillustrated in Fig.1.The power consumptions for impellers I and II were obtained experimentally and numerically.The mixing indexes of four different impeller combinations at different operating conditions were predicted by DEM simulations.The optimal impeller combination was determined based on comparison of the predicted mixing index.

Table 1Size of the impellers

Table 2Types of combined impellers
2.2.Numerical method
To acquire the position,velocity and acceleration of each particle in the stirred tank,DEM simulation can be utilized to model the dynamic of particles'contact and collision during the process of mixing.The force-displacement law was combined with the New ton's equation of motion to calculate the particle's dynamic information mentionedabove.If the time-step for simulation is sufficiently small,it can be regarded that the particles'motion is just influenced by the contact with particles nearby.The contact model used in this paper is Hertz–Mindlin(no slip)model,which is based on the work of Tsuji et al.[21]and Di Renzo et al.[22]to calculate the normal contact force and tangential force.The motion of particle i is described by the following equations:

Table 3Formulae for forces and associated definitions

w here miis the mass,viis the linear velocity,Iiis the moment of inertia,ωiis the angular velocity,Riis radius,and g is the acceleration due to gravity,τrijis the torque term,andare the normal and tangential forces,respectively,resulting from the contact of particle i with particle j.Expressions for the normal and tangential contact forces are given in Table 3.

Table 4Physical properties of the materials

Table 5Sensitivity of mixing index on cell size
2.3.Materials
The materials involved in this study are glass particles,steel impellers and polymethyl methycrylate(PMMA)stirred tank.Particles with two different mean sizes were used,including particle A between 2 mm and 3 mm and particle B between 4.5 mm and 5.5 mm.To ensure the diameter distribution of the particles used in the experiments the same as those used in the simulations,400 glass particles were selected randomly to obtain the diameter distribution,which was also used in the simulations.Fig.3 shows that the diameter distributions of particle A and B meet the normal distribution approximately.The physical properties of the materials mentioned above used in the simulations are listed in Table 4.The Poisson's ratio and the Young's modulus are obtained based on the material technical specification,the coefficients of restitution are measured by the drop test described by Barrios et al.[24],and the friction coefficients are extracted from the literature[23,25–27].

Fig.3.Distribution of diameter of particle A and particle B.
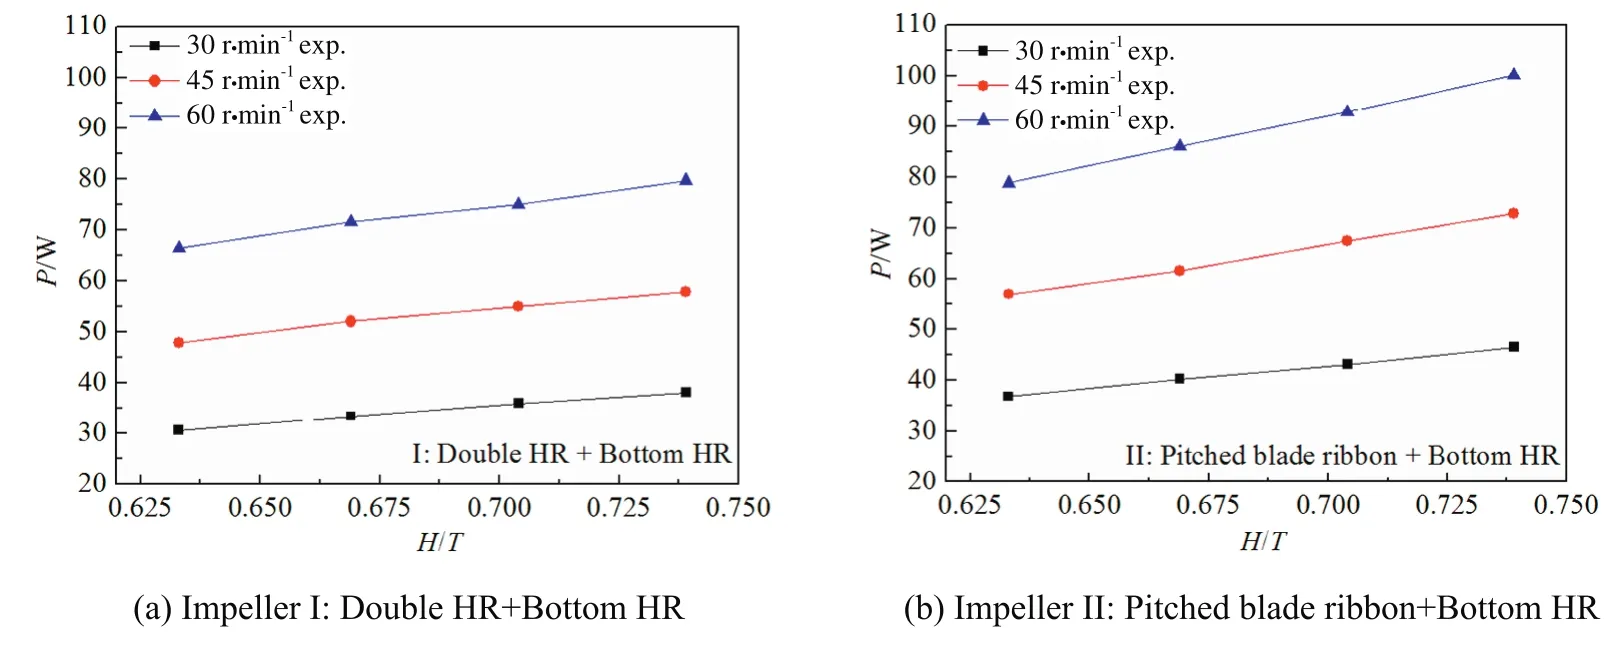
Fig.4.Effect of rotational speed on power consumption at different H/T for different impellers.

Table 6Power consumption as a function of N and H/T
2.4.Mixing evaluation
The mixing state of the particles in the stirred tank was analyzed by calculating the mixing index M.A variety of definition and calculation methods of mixing index have been proposed by researchers[28,29].In this study,the Lacey method[30]was used to calculate the mixing index,called the Lacey index.The approach is based on the change of relative mixing variance with respect to the maximum mixing variance of a binary mixture,which ranges from 0 to 1,with 0 representing a completely segregated state(with variance s02),and 1 represents a perfectly mixed state(with variance sr2).
The overall proportion of particle A in the mixture is

The overall proportion of particle B in the mixture is

where NAand NBare the total numbers of particle A and particle Bin the mixture,respectively.
The variance of the fully segregated system is

As to sr2,since the mixture is composed of two types of particles with different diameter,sr2is calculated based on the method mentioned by Lacey[20]:

Eq.(6)is used for the multi-sized material,which has a size distribution,and the size distribution of particle A is included in Eq.(6).HereωA,ωB,and ω represent the average mass of particle A,particle B,and the average particle mass in the whole tank,respectively.W represents the sample i's mass.ηΑ,ηΒandepresent the mass fractions of particle A,particle B,the numbers of particle A and particle B in i th sample,respectively.
When the stirred tank is meshed into a group of cubic cells in the Cartesian coordinates,the actual variance s2of the mixture is analyzed by using Eq.(9):


Fig.5.Effect of N and H/T on power consumption at different numbers of revolution for different impellers.

Fig.6.Comparison of power consumption between predictions and simulations for different impellers.
w heren is the number of the cells,and piis the proportion of particle A in i th sample.Finally,the Lacey index M is

In the evaluation of mixing performance,the actual variance s2is relevant to the size and the number of cells n,so it is necessary to set the optimum dimension of cells.In the condition that a mixture containing 125,000 particle A and 210,000 particle B(H/T=1.205),the cell size varied from 15 mm to 35 mm,the rotational speed of impeller is 90 r·min−1and after 120 complete revolutions.Table 5 shows the mixing indexes with different cell sizes,in order to obtain the optimized cell size to reduce the sampling error.
It can be seen in Table 5 that when the cubic cell size varied from 15 mm to 35 mm,the variation of the mixing index was little,but the average number of the particles in each cell varied obviously.Therefore,in order to ensure that the simulation contains enough sampling points and enough particles in each cell in the calculation of the mixing index,20 mm was chosen as the cell size for the mixing degree analysis[25,31].
3.Results and Discussion
3.1.Power consumption
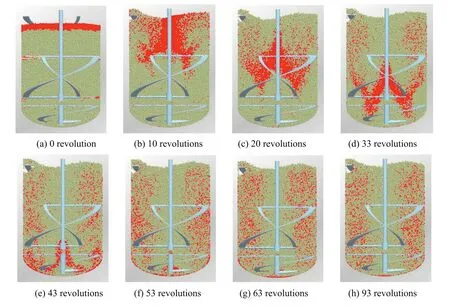
Fig.7.Particle position(vertical section)of different revolutions for impeller III at 60 r·min-1(H/T=1.205).

Fig.8.Effect of the number of revolutions on mixing index at 60 r·min−1 for impeller III.
In order to validate the simulated power consumption,the torque was measured experimentally at different rotational speed N(30 r·min−1,45 r·min−1and 60 r·min−1)and H/T(from 0.633 to 0.739)for impeller I and impeller II,as shown in Fig.4.In the experiment,15 kg of particle A was firstly fed into the tank,then 1 kg,2 kg,3 kg and 4 kg of particle B were added in the tank and the total mass of particles were 16 kg(H/T=0.633),17 kg(H/T=0.669),18 kg(H/T=0.704)and 19 kg(H/T=0.739),respectively.Fig.4 shows that the power consumption increases with the increase of both the rotational speed N and H/T.At the same H/T and N,the power consumption of impeller II is larger than that for impeller I.Based on the results of the experiment,the power consumption(P)could be expressed as the function of N and H/T as shown in Table 6.
In order to investigate the particle mixing performance at higher fill levels,which is beyond the capacity of the experimental motor,the DEM simulation of the mixing index was carried out at higher H/T=1.145 and 1.205,respectively.The objective of the DEM simulation was to obtain the variation of the mixing index as the increasing revolutions,so the power consumption results of the simulation was also presented as the variation of the power consumption with the increasing revolutions.Fig.5 shows the simulation results of the effects of N and H/T on the power consumption P for impeller I and impeller II.The value of P was not stable as the revolution increased because the fill level of particles is fluctuant as the impeller rotates and therefore the force applied on the impeller from the particles is variable,which leads to the fluctuations of power consumption.The reason for the different range of fluctuation is that the fluctuation of the fill level of particles is more obvious than the stirring speed.The power consumption P for both impellers increased with the increasing N and H/T,and the simulated power consumption P of impeller II is larger than that for impeller I at the same operating condition,in accordance with the experimental results.
The predicted power consumption was calculated at H/T of 1.145 and 1.205 based on Eqs.(12)–(13)in Table 6.The simulated power consumption was carried out by averaging the power consumption in Fig.5.Fig.6 shows the comparison between the power consumption correlation and the simulated power consumption for impeller I and II at different H/T and rotational speed.Except three relative errors between prediction and simulation are higher than 8%for two impellers at 60 r·min−1,all other relative errors are lower than 3%with very good agreement between the predictions and simulations.Therefore,a conclusion was drawn that the effects of the rotational speed and the fill level on mixing index for different impellers are reliable via DEM simulations as discussed in the next section.
3.2.Mixing index
3.2.1.Effect of rotational speed
Fig.7 shows the position of particle A(NA:125,000,red)and particle B(NB:210,000,light yellow)in vertical section(H/T=1.205)at 60 r·min−1as the revolutions increased for impeller III.At the beginning(Fig.7a),particle A and particle B are separated,and particle A is on the top of particle B.With the impeller started to rotate at 60 r·min−1,particle A move to the bottom of tank along the shaft.At 93 revolutions in the simulation(Fig.7h),the distribution of particle A in the tank is the same as that at 63 revolutions as shown in Fig.7g.It illustrates that all particles reach a relatively stable state at 63 revolutions.The effect of the number of revolution on the mixing index corresponding to the particle position in Fig.7 is depicted in Fig.8.The mixing index M in Fig.8 increases until the impeller reach 63 revolutions,and then the mixing index M remains roughly unchanged.
The mixing index was simulated at two rotational speeds(60 r·min−1and 90r·min−1)for impellers I to IV,respectively.There are 125000 particle A and 210000 particle B in the tank for H/T=1.205.Fig.9 presents the effect of impellers type on mixing index at 60 r·min−1and 90 r·min−1.The mixing index for impeller III could reach the highest value of about 0.92 at 63 revolutions for the rotational speed of 60 r·min−1and the highest mixing index is about 0.95 at 50 revolutions for the rotational speed of 90 r·min−1.And it can be observed that the curve of the mixing index for impellers which include Pitched blade ribbon is almost the same at the rotational speed of 60 r·min−1,showing that Pfaudler did not improve the mixing effect.When the rotational speed is 90 r·min−1,the mixing index of impeller IV which includes Pfaudler increases slightly.Therefore,at high rotational speed,Pfaudler can enhance the particle mixing.
The evaluation of the mixing performance for different impellers should consider the input power consumption to the particle mixing systems.In order to calculate the input work for different impellers at different number of revolutions,Eq.(14)is proposed to calculate the specific input works,
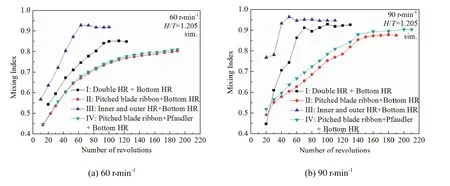
Fig.9.Effect of impeller types on the relationship between mixing index and numbers of revolution.
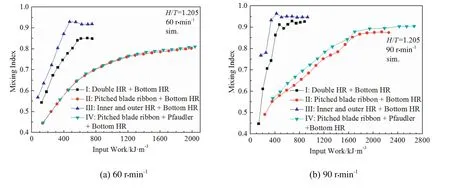
Fig.10.Relationship between mixing index and input specific work for different impellers.

w here Winputis the input work per unit volume,kJ·m−3;P is the power consumption of the impeller,k W;R is the number of the revolutions;N is the rotational speed,r·min−1,and V represents the total volume of the particles in the tank,m3.
Fig.10 presents the relationship between the mixing index and the specific input work at two rotational speeds of 60 r·min−1and 90 r·min−1for different impellers.Generally speaking,the mixing index increases with the increase of the input work for all four impellers.At the same input work,the highest mixing index for impeller III implies that impeller III is much more efficient than other impellers.The results show that impeller III requests the lowest input work to obtain the highest mixing index.
Fig.11 shows the relationship between the mixing index and the number of revolutions stirring at 60 r·min−1and 90 r·min−1.As the number of revolutions increases,the mixing index increases fast in the beginning,then the growth rate of the mixing index becomes slower and finally reaches a steady value.With the rotational speed of 90 r·min−1,the steady value of the mixing index is usually higher than that with the rotational speed of 60 r·min−1.It can be noted that for impeller I and impeller III,the value of the mixing index is obviously different for 60 r·min−1and 90 r·min−1,and for impeller IV,with the addition of Pfaudler,the mixing index increases at the beginning while mixing at 90 r·min−1compared with impeller II.
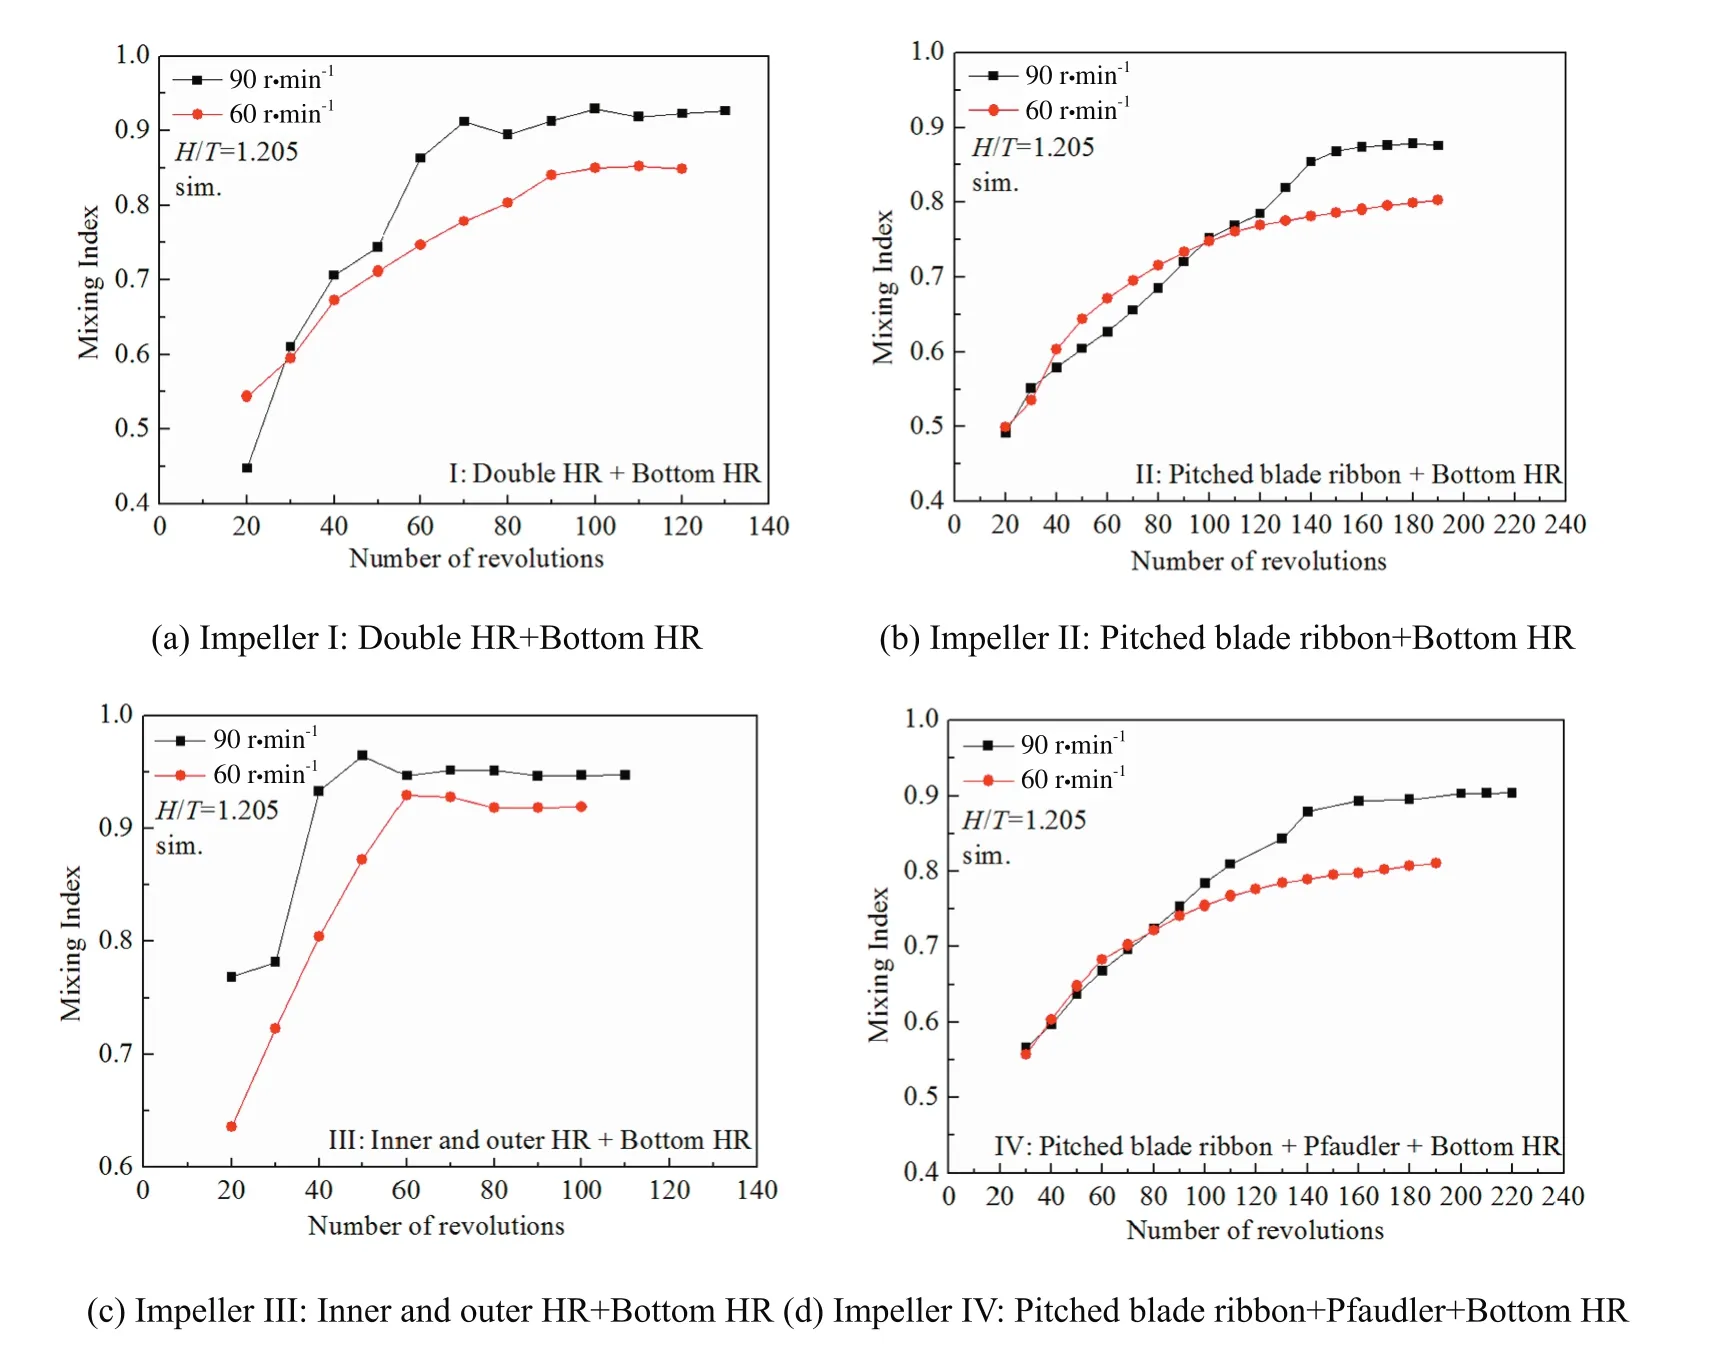
Fig.11.Relationship between mixing index and numbers of revolution at different rotational speeds.

Fig.12.Relationship between mixing index and numbers of revolution for different impellers and H/T.
3.2.2.Effect of fill level
The results above shows that impeller III is the most efficient impeller by DEM simulations.How ever,the impeller II,combined with the pitched blade ribbon,is a newly developed impeller receiving lots of attentions during research.Therefore,the effect of the fill level on the mixing index for the efficient impeller III and impeller II including pitched blade ribbon was investigated by the simulations.The simulations were carried out at H/T=1.145,1.205 and 1.272,the number of particle B is 210,000,and the number of particle A is 60,000,125,000,and 200,000,respectively.The rotational speed of the impellers is 60 r·min−1.Fig.12 shows the effect of the fill level on the mixing index for impellers II and III.With the increasing of the number of revolutions,the mixing index increases until it reaches a stable value for both impellers.Impeller III is more efficient than impeller II since it needs less revolutions to reach the stable state.The final mixing index decreases as H/T increases for impeller II and impeller III.In Fig.12a,the difference of the final mixing index at different H/T for impeller II is remarkable,while it is not so obvious for impeller III as shown in Fig.12b.The conclusion could be made that impeller III is not only the most efficient impeller in particle mixing,but also less dependent on the fill level compared with impeller II.
Fig.13 shows the effect of H/T on the relationship between the mixing index and the input work for impeller II and impeller III.The final mixing index increases as the fill level decreases.With the increasing of the fill level,it needs more input work for mixing index to reach a steady state for impeller II and impeller III.For the condition of H/T=1.145,it needs the least input work to reach the highest final mixing index implying that a better particle mixing performance could be obtained compared with other higher H/T.The critical specific input work are about 1100 k J·m−3and 450 k J·m−3for impeller II and impeller III at H/T=1.145,respectively,corresponding to reach the final mixing index values of about 0.85 and 0.94.Compared with impeller II,impeller III is more efficient for it requests the lower input work to obtain the higher mixing index at H/T=1.145.Same conclusions can be made for other two H/T.
4.Conclusions
The DEM simulations were carried out to investigate the particle mixing for four different impellers,namely impellers Ito IV.The simulations were validated through the comparison with the experimentally measured power consumption or the predicted ones from the correlations.The effects of the impeller types,the rotational speed and the fill level on the mixing index M were investigated.The following conclusions can be made.
(a)The comparison between the power consumption correlation and the simulated power consumption shows that the power consumption predicted by the DEM simulations is reasonable.
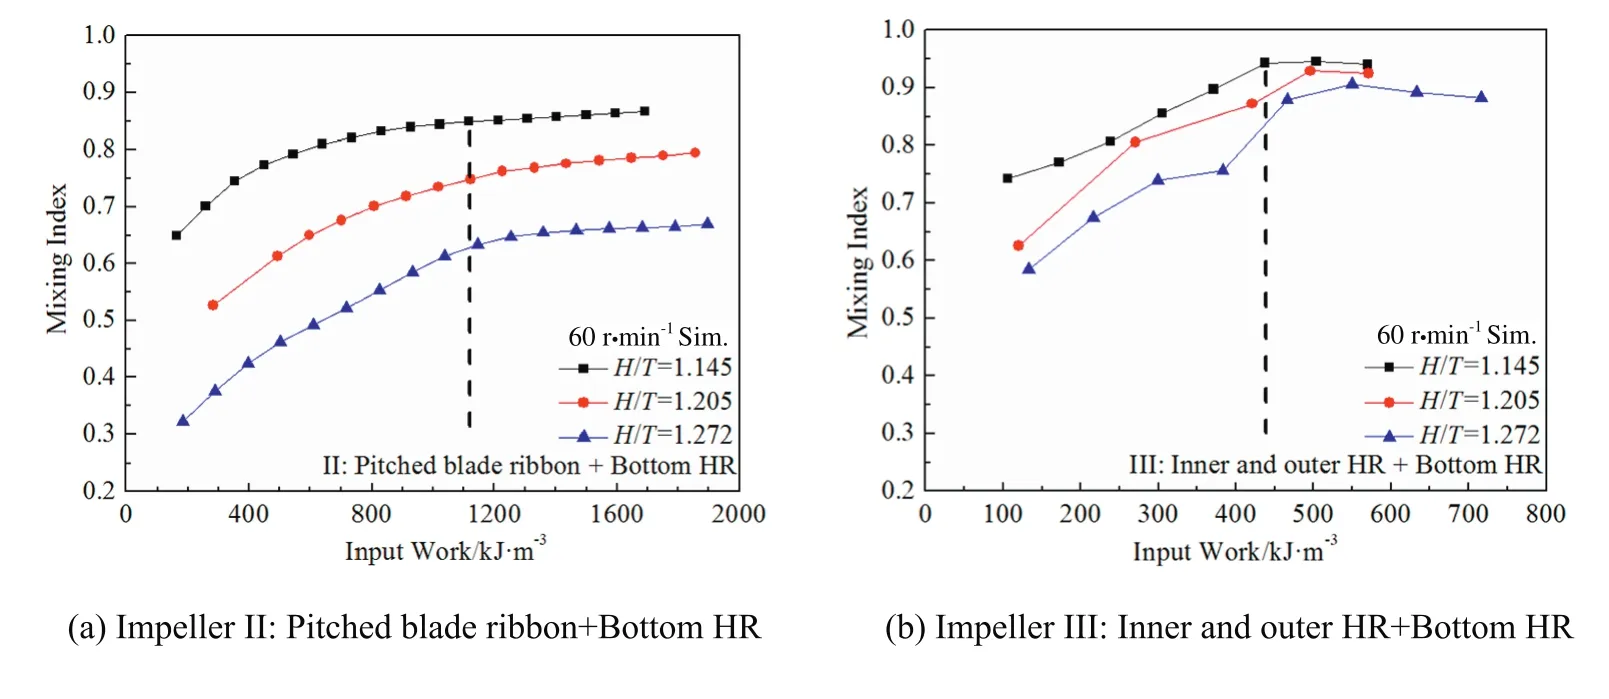
Fig.13.Relationship between mixing index and input work at 60 r·min−1 for different impellers and H/T.
(b)For the impellers I to IV discussed in this study,the rotational speed and the fill level are important factors that affect the mixing index.The mixing index increases with the increasing of the rotational speed,and decreases with the fill level increases.Pfaudler can enhance the particle mixing at the rotational speed of 90 rpm for impeller IV.
(c)Impeller III(Inner and outer HR+Bottom HR)is not only the most efficient impeller in particle mixing,but also less dependent on the fill level compared with impeller II.Impeller III requests the low est input work to obtain the highest mixing index.At H/T=1.145,when the input work is 450 k J·m−3,the mixing index could reach the highest value of 0.94.
Nomenclature
D diameter of impeller,m
dAdiameter of particle A,m
dBdiameter of particle B,m
E Young's modulus,Pa
e coefficient of restitution
FNnormal contact force,N
FTtangential contact force,N
G particle's Shear modulus,Pa
g acceleration due to gravity,m·s−2
H particles height in the stirred tank,m
Iimoment of inertia,kg·m2
M mixing index
mimass of particle i,kg
N rotational speed of impeller,r·min−1
NAnumber of particle A
NBnumber of particle B
n number of cells
P power consumption,W
p over-all proportion of particle A in mixture
pinumber proportion of particle A in i th sample
R number of revolutions
R* effective radius of contacting particles,m
Riradius of particle i,m
Rjradius of particle j,m
s tangential decomposition of unit vector connecting center of particle
s2variance of mixture
T diameter of tank,m
V total volume of particles in tank,m3
vilinear velocity of particle i,m·s−1
vjlinear velocity of particle j,m·s−1
W sample i's mass,kg
Winputinput work per unit volume,kJ·m−3
w w idth of impeller,m
δnnormal displacement
δttangential displacement
ηAw eight fraction of particle A
ηBw eight fraction of particle B
μrrolling friction coefficient
μsstatic friction coefficient
ν Poisson's ratio
ρ density,kg·m−3
τrijtorque term between particle i and j,N·m−1
ωAaverage mass of particle A,kg
ωBaverage mass of particle B,kg
ω average particle mass in whole tank,kg
ωiangular velocity of particle i,rad·s−1
ωjangular velocity of particle j,rad·s−1
 Chinese Journal of Chemical Engineering2018年6期
- Chinese Journal of Chemical Engineering的其它文章
- Polyethoxylation and polypropoxylation reactions:Kinetics,mass transfer and industrial reactor design
- Inherently safer reactors and procedures to prevent reaction runaway☆
- Ag-Co3O4:Synthesis,characterization and evaluation of its photocatalytic activity towards degradation of rhodamine B dye in aqueous medium
- One-pot synthesis of 5-hydroxymethylfurfural from glucose over zirconium doped mesoporous KIT-6☆
- Selective propylene epoxidation in liquid phase using highly dispersed Nb catalysts incorporated in mesoporous silicates☆
- High-efficiency acetaldehyde removal during solid-state polycondensation of poly(ethylene terephthalate)assisted by supercritical carbon dioxide☆
