
What determines irrigation efficiency when farmers face extreme weather events? A field survey of the major wheat producing regions in China
2018-08-06 12:08:36SONGChunxiaoLesOxleyMAHengyun
SONG Chun-xiao, Les Oxley, MA Heng-yun
1 College of Economics and Management, Henan Agricultural University, Zhengzhou 450002, P.R.China
2 Department of Economics and Finance, University of Waikato, Hamilton 3240, New Zealand
Abstract Water availability is a major constraint on grain production in China, therefore, improving irrigation efficiency is particularly important when agriculture faces extreme weather events. This paper first calculates irrigation efficiency with a translog stochastic frontier production function and then investigates what happens when extreme weather events occur via a Tobit model. The estimated results reveal several important features of irrigation practices: i) irrigation efficiency is lower when extreme weather events occur; ii) large variations in irrigation efficiency occur across irrigation facilities; iii) the farm plots exhibit an extreme distribution across efficiency levels; and iv) water-saving techniques, technology adoption, and the maintenance of farmers’ economic resilience are major determinants of irrigation efficiency. Based on these results we propose the following recommendations: i) farmers should balance crop yield and water use; undertake relevant training programs and adopt water-saving techniques; ii) local governments and researchers should help farmers to find the optimal level of irrigation water use based on their own circumstances and provide better water-saving techniques and training programs rather than simply encouraging farmers to invest in irrigation facilities in the most extreme weather years; and iii)the income level of farm households should be increased so as to improve their resilience to natural disasters.
Keywords: irrigation efficiency, determinants, irrigation facilities, water-saving techniques, extreme weather events
1. lntroduction
Grain production is important in China and worldwide,however, it is undermined by grain losses due to natural disasters (Denget al. 2014). Climate change, especially extreme weather events, exacerbates the water-related threats to the sustainability of agricultural production in China (Trenberthet al. 2014). Most of the inland rivers in China face declining surface runoff (NDRCet al. 2007;Zhouet al. 2012). In particular, the observed increases of serious droughts in the northwestern regions and of devastating floods in the southwest areas illustrate the severe imbalances of water resources in China (Tanget al. 2014). The grain loss due to drought is estimated to be around 16.23 million tons annually, which accounts for 4.16% of total grain output (MWR 2012; NBSC 2012)and that amount exceeds the estimated contribution of technological progress in China (Chenet al. 2008).
Due to the increasingly severe water scarcity in recent years, precipitation alone cannot satisfy the demand for grain production, and thus irrigation plays an increasingly important role in ensuring future crop production in China.For winter wheat, precipitation alone provides approximately 30% of the water requirement and the remaining 70% comes from irrigation (Liuet al. 2002; Liu and Lin 2004; Moet al.2005). For all grain crops, approximately 75% of grain production comes from irrigated land, which accounts for 40% of China’s total arable land (NBSC 2012). Reasonable predictions suggest that the demand for irrigation water for cultivated land in China will likely exceed 100 billion cubic metres to meet the demand for food of approximately 1.5 billion people, which would most likely lead to severe water shortages for irrigation (Denget al. 2014; Shiet al. 2014).
Although crop production in general faces a serious shortage of water, irrigation efficiency is low in China.Agricultural water use efficiency is uneven at the provincial level and has been found to be less than 60% in China(Kanekoet al. 2004; Wang and Zhao 2008; Liet al. 2015),In addition, irrigation water efficiency was only 30% or less in some areas, particularly parts of the northwest arid regions(Wang 2010; Liu and Li 2012; Tanget al. 2014, 2015).
Many studies have examined the relationships between agricultural irrigation water efficiency and its influencing factors. From a macro-industry perspective, the adjustment and optimizing of industrial structures contributed to improving agricultural water use efficiency (Shiet al. 2014;Bravo-Uretaet al. 2015; Wanget al. 2015). But from the perspective of irrigation technologies and methods, the shift from traditional surface canal irrigation to modern irrigation methods, particularly the use of drips and sprinklers, leads to the reduction of crop water use, higher irrigation water use and hence technical efficiency (Speelmanet al. 2008;Yigezuet al. 2013; Huanget al. 2017). However, Yinet al. (2016) note that low-tech inexpensive water-saving technologies, such as furrow irrigation, should also be targeted in efforts by the government. Furthermore, the reforms of water management organizations (Tanget al.2014; Wanget al. 2014; Wattoet al. 2014) and water prices(Wang 2010; Heumesseret al. 2012; Tanget al. 2014;Yinet al. 2016) have both substantially improved farmers’water-use efficiency. In addition, from the perspective of individual households, a series of factors significantly impact irrigation water efficiency, such as farm household characteristics (age, education, access to producing/technical training, access to extension service, shares of laborers working off-farm and ratio of agricultural income),and land characteristics (e.g., farm size, soil quality and land ownership) (Karagiannis 2003; Dhehibiet al. 2007; Chebilet al. 2012; Yinet al. 2016).
Climate change, especially extreme weather events,have recently emerged as major forces that affect water availability. At the farm household level, irrigation efficiency is important for productivity, especially during extreme weather events, and improvements in irrigation efficiency are considered to be an adaptation strategy for more frequent extreme weather events (Heumesseret al. 2012;Berbel and Mateos 2014; Wanget al. 2018). Although some studies have investigated the adaptive behavior of farm management measures and technologies to climate change (Huanget al. 2014, 2015; Asfawet al. 2016), few studies have focused on how to improve irrigation efficiency in the face of extreme weather events and whether there is a difference in irrigation efficiency between “normal years”and “disaster years” (e.g., drought or flood).
Therefore, the primary goal of this study is to measure irrigation water efficiency based on the concept of inputspecific technical efficiency separately under drought and flood disaster conditionsviastochastic frontier analysis(SFA). More specifically, we will identify the impact of irrigation facilities (water-saving-technologies), farm household characteristics and farmland characteristics on irrigation efficiency under different extreme weather events(drought and flood), using a Tobit model applied to a large field survey dataset collected across five major wheat producing provinces in China, over the period 2010–2012.To achieve these goals, Section 2 briefly introduces the research methods; Section 3 introduces the sampling procedure and describes the dataset; Section 4 provides the estimated results, and the final section presents some policy suggestions.
2. Methodological framework
2.1. Definition of technical considerations of irrigation efficiency
Before considering the calculation of irrigation efficiency,it is important to consider what we mean by “irrigation efficiency”. Following Farrell (1957), one can describe the technical efficiency of firms, from the output perspective,where technical efficiency measures the potential increase in output, keeping the inputs constant.Alternatively, one can define technical efficiency from the input perspective, where technical efficiency measures the ability of firms to produce a given output with the minimum set of inputs. Irrigation water efficiency is based on the non-radial notion of input-specific technical efficiency. It is an input-oriented, single-factor measure of the technical efficiency of the irrigation water input, which is defined as the ratio of minimum feasible to observed irrigation water use, conditional on the observed level of constant output and that of other inputs. In the case of water, which is becoming increasingly scarce, this notion may provide us with the potential to increase agricultural irrigation in the future (Kopp 1981; Reinhardet al. 1999).
2.2. Measurement of technical and irrigation efficiency
There are two major approaches used to measure technical efficiency: i) the non-parametric data envelopment analysis(DEA) (Charneset al. 1978) and ii) the parametric stochastic frontier analysis (SFA) (Aigneret al. 1977). The DEA requires neither any specific functional form, nor a particular distributional form of the one-sided inefficiency term.However, the DEA method is highly sensitive to outliers,and it does not consider random factors and attributes that lead to inefficiencies, which may result in inconsistent estimation (Johansson 2005; Hossainet al. 2012). On the other hand, the SFA is less sensitive to outliers and it permits consideration of random factors. Therefore, in this analysis we use the SFA approach to consider crop production, because the data are likely to be influenced by measurement errors and the effects of random climate conditions (Bravo-Uretaet al. 2007).
Here, we have adopted the technical efficiency model proposed by Battese and Coelli (1995), as our data were obtained in a panel context. The model we use consists of two equations, where the first represents the production frontier function and the second captures the effects of technical inefficiency:
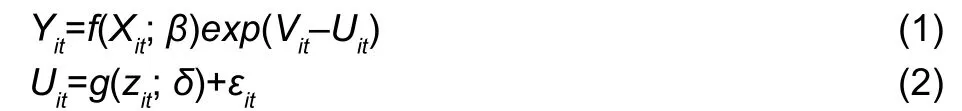
The dependent variableYitdenotes the production level,Xitrepresents a vector of inputs,βis the parameter vector to be estimated and the error term comprises two components:Vitis the random error term, assuming thatVit~iidN(0,) andUitis the non-negative error term which is assumed to account for technical inefficiency in production and is composed ofg(zit;δ) andεit, whereεitis assumed to beεit~iidN(0,).zitis a vector of the variables influencing the sample unit efficiency andδis a vector of parameters to be estimated.
Empirically,) replacesandto facilitate estimation of the parameters; the values ofγare assumed to lie between 0 and 1, indicating that the error in the frontier production function is mainly caused by production inefficiency ifγis close to 1; while the gap between actual output and the maximum output occurs mainly due to statistical error, ifγis close to 0.
From these two simple equations, many additional complexities need to be considered. According to Karagianniset al. (2003) and Dhehibiet al. (2007), irrigation water efficiency (IE) is an input-oriented, single-factor measure of technical efficiency, and is equal to the ratio of minimum irrigation water to actual usage, in the case of nochange of output and other inputs within unit area. Thus,the irrigation efficiency model is defined as:

Whereλrepresents the scale parameter of irrigation water inefficiency,Iis the actual irrigation water use, andImis the minimum irrigation water.IEmeasures the irrigation water efficiency, whereIE[0, 1], so whenIE=1, it means that irrigation water has been utilized effectively; if 0<IE<1,it means irrigation water has been utilized ineffectively and water resources could be further reduced to achieve fully efficient use of irrigation water.
2.3. The empirical model
Following Reinhardet al. (1999), we first define the empirical translog stochastic frontier production function (SFP) model as:
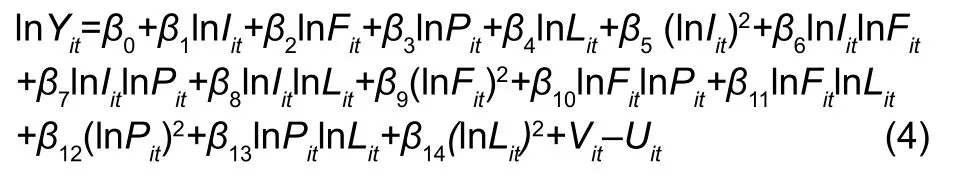
Where,Yrepresents wheat yield;Irepresents irrigation water for wheat;Fis fertilizer input cost per ha;Pis pesticide cost per ha;Lmeasures the labor input for wheat;Uis the technical inefficiency;Vis the random error term; andiandtdenote the farmland plot that sample farm households(HHDs) and year. All input and output variables were measured on the unit area base.
The inefficiency effect model is specified as:

Where,Urepresents the technical inefficiency;HCare the household characteristics;FCmeasures the farmland characteristics; andCis the county region variable. The subscriptsiandtdenote the farmland plot that sample HHDs and year.
The hypothetical translog production function with the minimum irrigation water can be derived as follows:
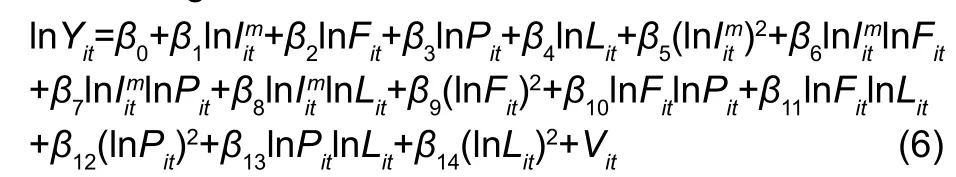
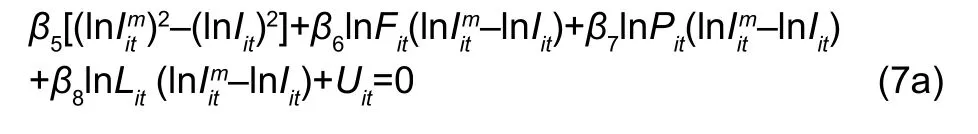

Where, lnIEit=lnIit m–lnIit. Therefore, specific estimates ofIEit(irrigation efficiency) can be derived and expressed as:

Where,θ=β1+2β5lnIit+β6lnFit+β7lnPit+β8lnLit
Using the estimated irrigation water efficiency, the determinants of irrigation efficiency can be further analyzed,andIEidcan then be expressed as:

Based on data availability, several main determinants of irrigation efficiency included in this study are considered.IFrepresents the irrigation facilities, including reservoirs,ponds, watering directly from a river or lake by pump (WDP),irrigation/drainage ditch or system (IDS), and motor-pumped well (MPW).ITis the irrigation technology, denoting whether the HHDs adopted an irrigation water-saving technology or not.HCrepresents the household characteristics, including the value of the durable goods of HHDs, whether anyone in the HHD received technical training for production in the previous two years, and considering the education of the HHD’s head.FCrepresents the farmland characteristics,with the variables of farmland area and farmland ownership included.Cis the county region variable. The subscripts ofidenote the farmland plot of the sample HHDs, and subscripts ofddenote whether a particular year was officially classified as a ‘disaster year’.
BecauseIEid[0,1], the estimated results will be biased and inconsistent if we use OLS regression, therefore the results presented here are based upon the Tobit model estimated by maximum likelihood method.
3. Data and description
3.1. Data source
The data used in this study are from a large-scale field survey of the five major grain producing provinces across China (Henan Province is located in Central China, Hebei in the north, Shandong and Jiangsu are in eastern coastal areas, and Anhui is in the inland eastern region), conducted from the end of 2012 to early 2013. From each of the provinces, three counties were randomly chosen based on the two important criteria.
First, the counties must have experienced at least one episode of either severe drought or a flood between 2010 and 2012. According to China’s national standard for natural disasters (CMA 2004), the severity of a drought or flood may fit into four categories: most severe, severe, moderate and small. If the government issues a disaster warning and the level is the most severe or severe, we considered it as a“disaster year”
Second, the counties must have experienced at least one normal year in the three years (2010, 2011 or 2012).Crop production often faces various weather shocks during any growing season; so the term “normal year” is relative and describes an average year with no more than moderate weather shocks. Table 1 shows that 11 counties experienced a severe drought in 2011 and relatively normal conditions in 2012; while three counties experienced a severe flood in 2012 and relatively normal conditions in 2011; and one county experienced a severe flood in 2011 and relatively normal conditions in 2012. From each of the chosen counties, three townships were randomly selected which also met the ‘good’, ‘medium’ or ‘poor’ local irrigation and drainage infrastructure conditions, respectively.Similarly, three villages were randomly selected from each township, and 10 HHDs were randomly selected for face-to-face interviews from each village. From each HHD, two plots with grain production were then randomly selected.
The total sample thus includes five provinces, 15 counties,45 townships, 135 villages, and 1 350 households across east and central China. Focusing on wheat production, the final sample used includes 14 counties, 42 townships, 126 villages, 1 209 households and 2 237 plots, among which 10 counties and 1 662 farm plots suffered from a drought disaster, and 4 counties and 575 farm plots suffered from a flood disaster (Table 1). The final data used in the study consists of a two-year panel.
3.2. Statistics of outputs and inputs
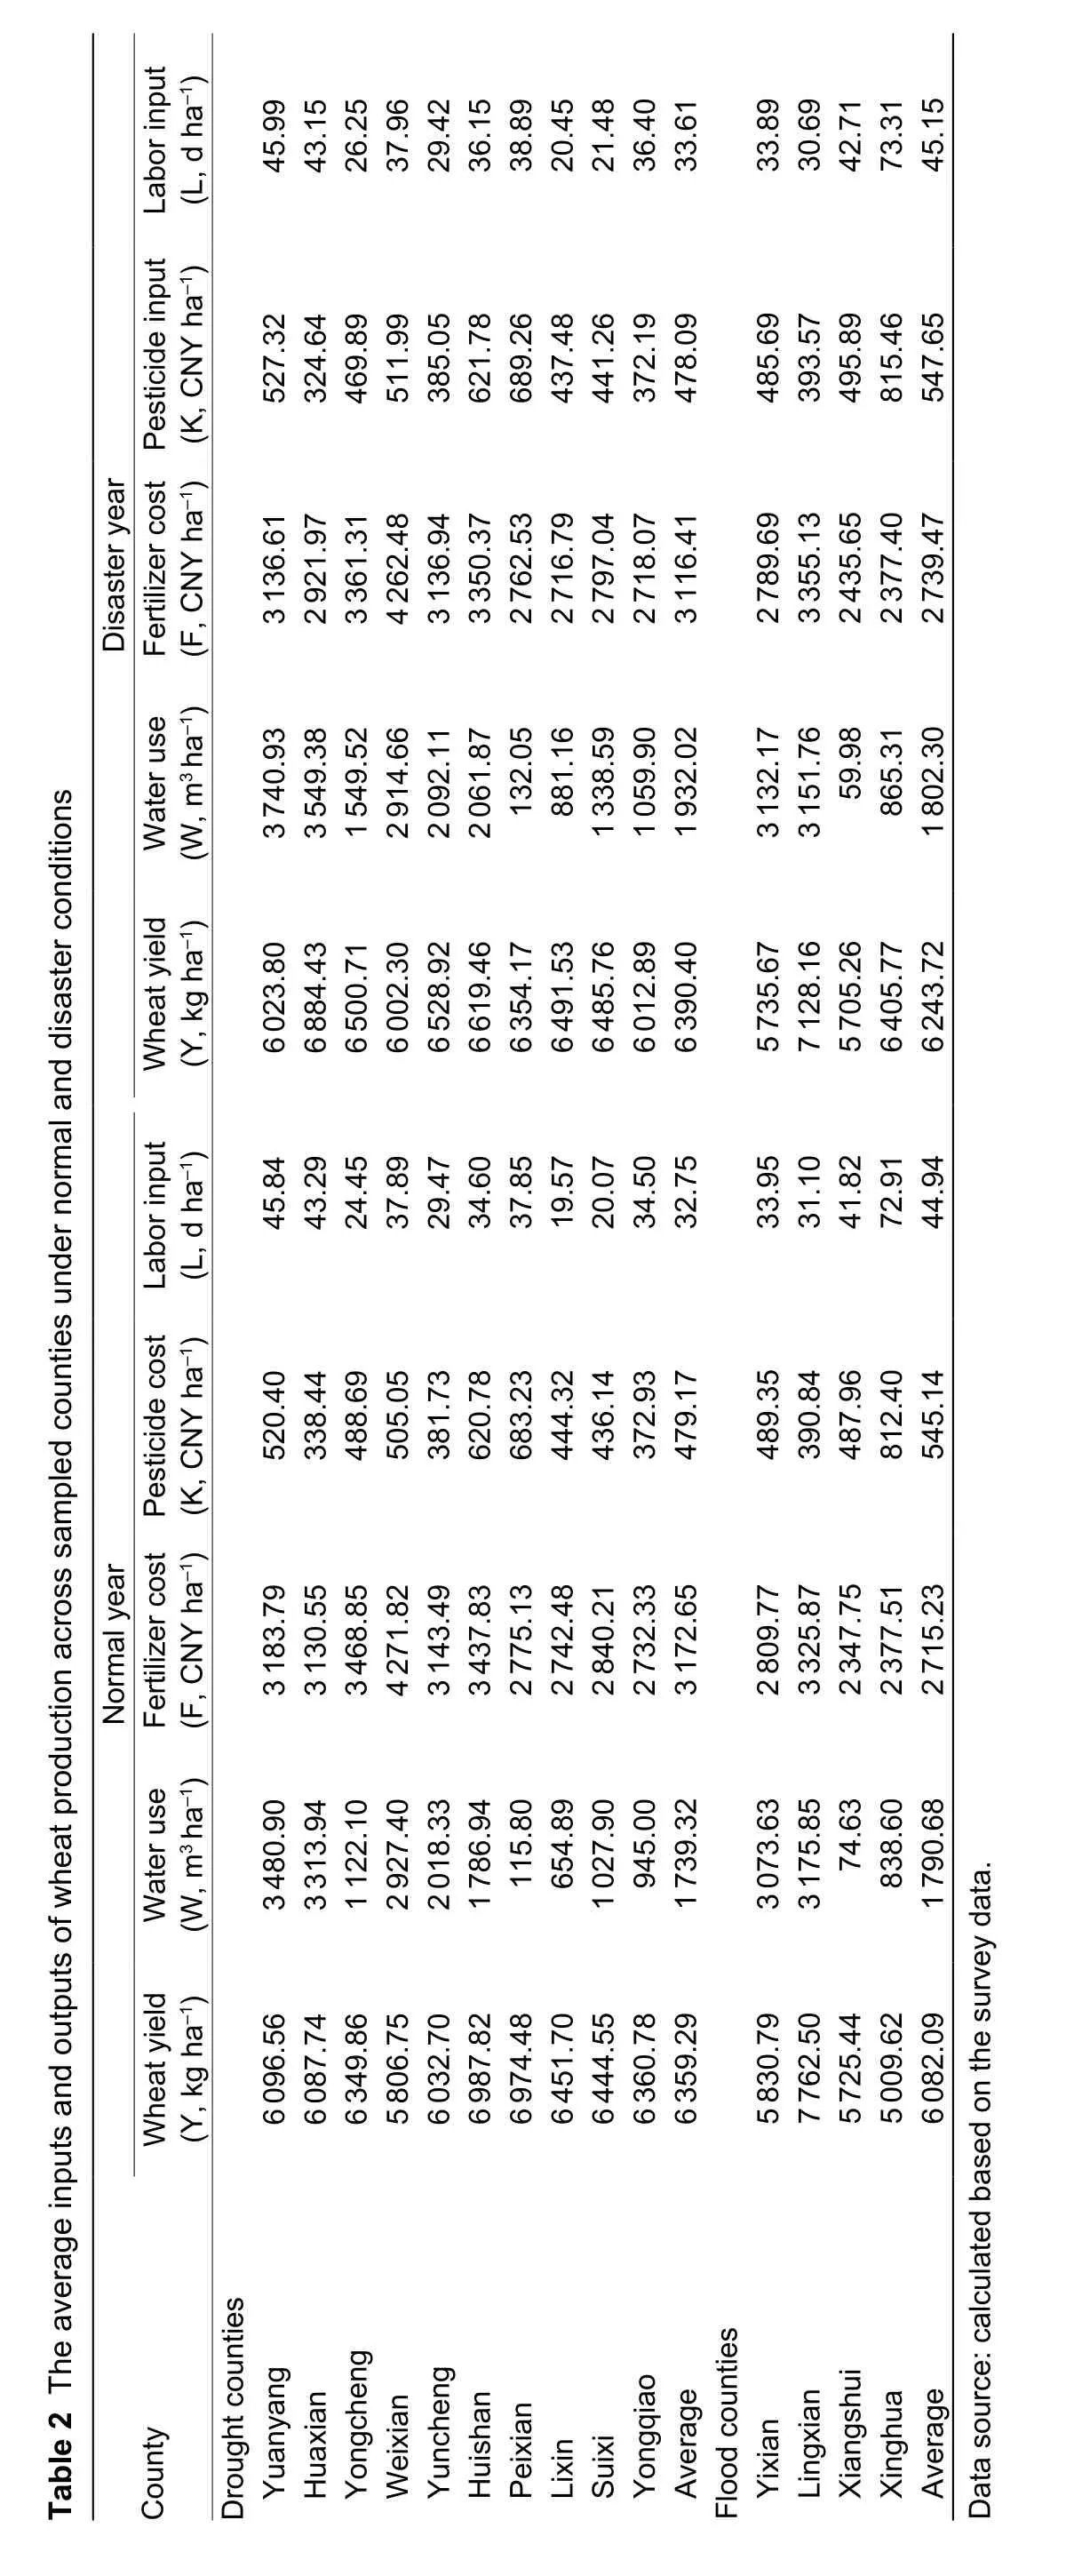
Dramatic differences in wheat outputs and inputs occurred across the counties (Table 2). For example, during a normalyear, wheat yield varied from 5 009.62 kg ha–1in Xinghua to 7 762.50 kg ha–1in Lingxian, and irrigation water use ranged even more widely, from 74.63 m3ha–1in Xiangshui to 3 480.90 m3ha–1in Yuanyang.Similarly, fertilizer input varied from 2 347.75 CNY ha–1in Xiangshui to 4 271.82 CNY ha–1in Weixian.Pesticide cost was the lowest at 338.44 CNY ha–1in Huaxian and the highest at 812.40 CNY ha–1in Xinghua. The labor input ranged from 20.07 adult days ha–1in Suixi to 72.91 adult days ha–1in Xinghua.Other differences across counties can be seen for disaster years.
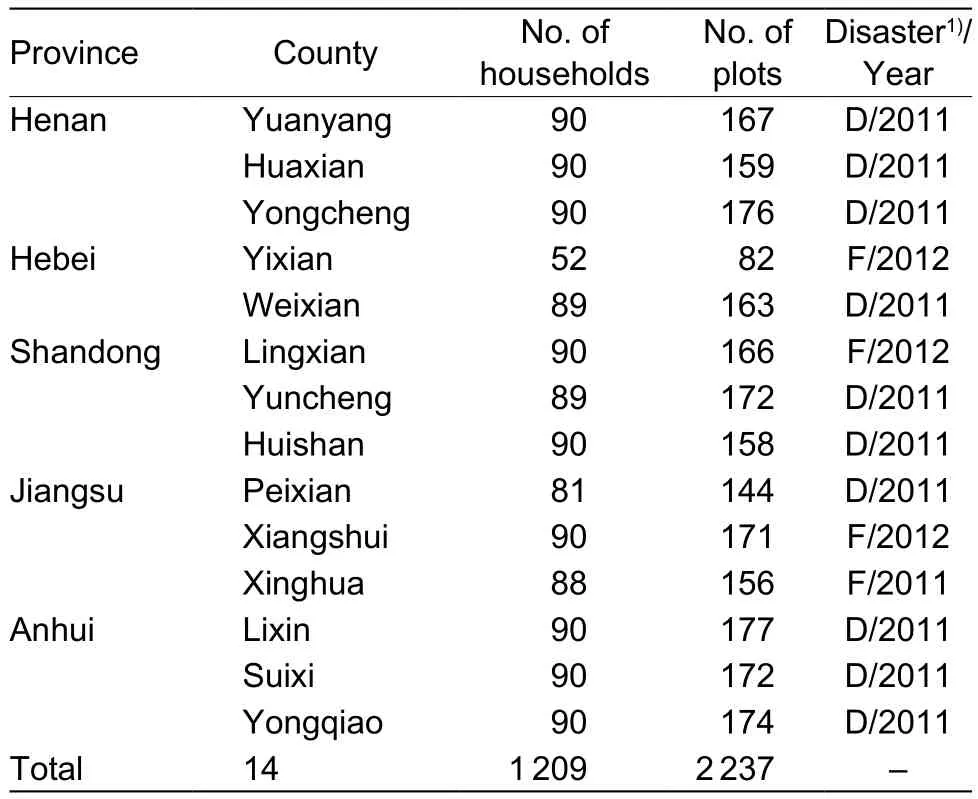
Table 1 The sample distribution for five central-east provinces
It was also surprising to find that wheat yield was higher in the disaster year than that in the normal year. For example, the average wheat yield in a drought year was slightly more (by 31.11 kg ha–1)than that in the normal year and the average wheat yield in a flood year was higher (by 161.63 kg ha–1)than that in the normal year. This may be explained by the fact that more attention is paid to wheat production during a disaster year characterized by drought or flood. As a robustness check data from theNational Agricultural Production Cost and Return Data Collection(NDRC 2013), wheat yields were 6 705 kg ha–1in 2011 and 5 970 kg ha–1in 2012 for Henan, 6 435 kg ha–1in 2011 and 6 390 kg ha–1in 2012 for Hebei; 5 715 kg ha–1in 2011 and 5 520 kg ha–1in 2012 for Jiangsu; and 5 625 kg ha–1in 2011 and 5 925 kg ha–1in 2012 for Anhui,which are generally also consistent with our survey results.
3.3. Definition of variables
lrrigation facilitiesAccording to the survey data,there are five types of irrigation facilities that sampled HHDs in the period of 2010–2012: reservoir, pond,watering directly from a river or lake by pump (WDP),irrigation/drainage ditch or system (IDS), and motorpumped well (MPW) (Table 3). Interestingly, HHDs in the counties subject to drought (short of water) were more likely to use MPWs from groundwater to irrigate wheat (65% of plots), while HHDs in the counties suffering floods were more willing to use WDPs to irrigate and approximately 56% of plots were irrigated by WDPs from surface water. Moreover, compared with using WDP, IDS and MPW, reservoirs and ponds were rarely used, as there were less than 6% of plots that used this type of irrigation facilities in either a drought or flood disaster year.lrrigation technology Irrigation water-saving technology is used to describe whether the HHDs adopted irrigation technologies including; border irrigation,furrow irrigation, drip irrigation, land leveling, ground and underground pipelines, straw returning, no-tillage, etc. Our survey found that over 85% of farm plots used some form of irrigation water-saving technology, both during drought and flood disasters in the previous two years.
?
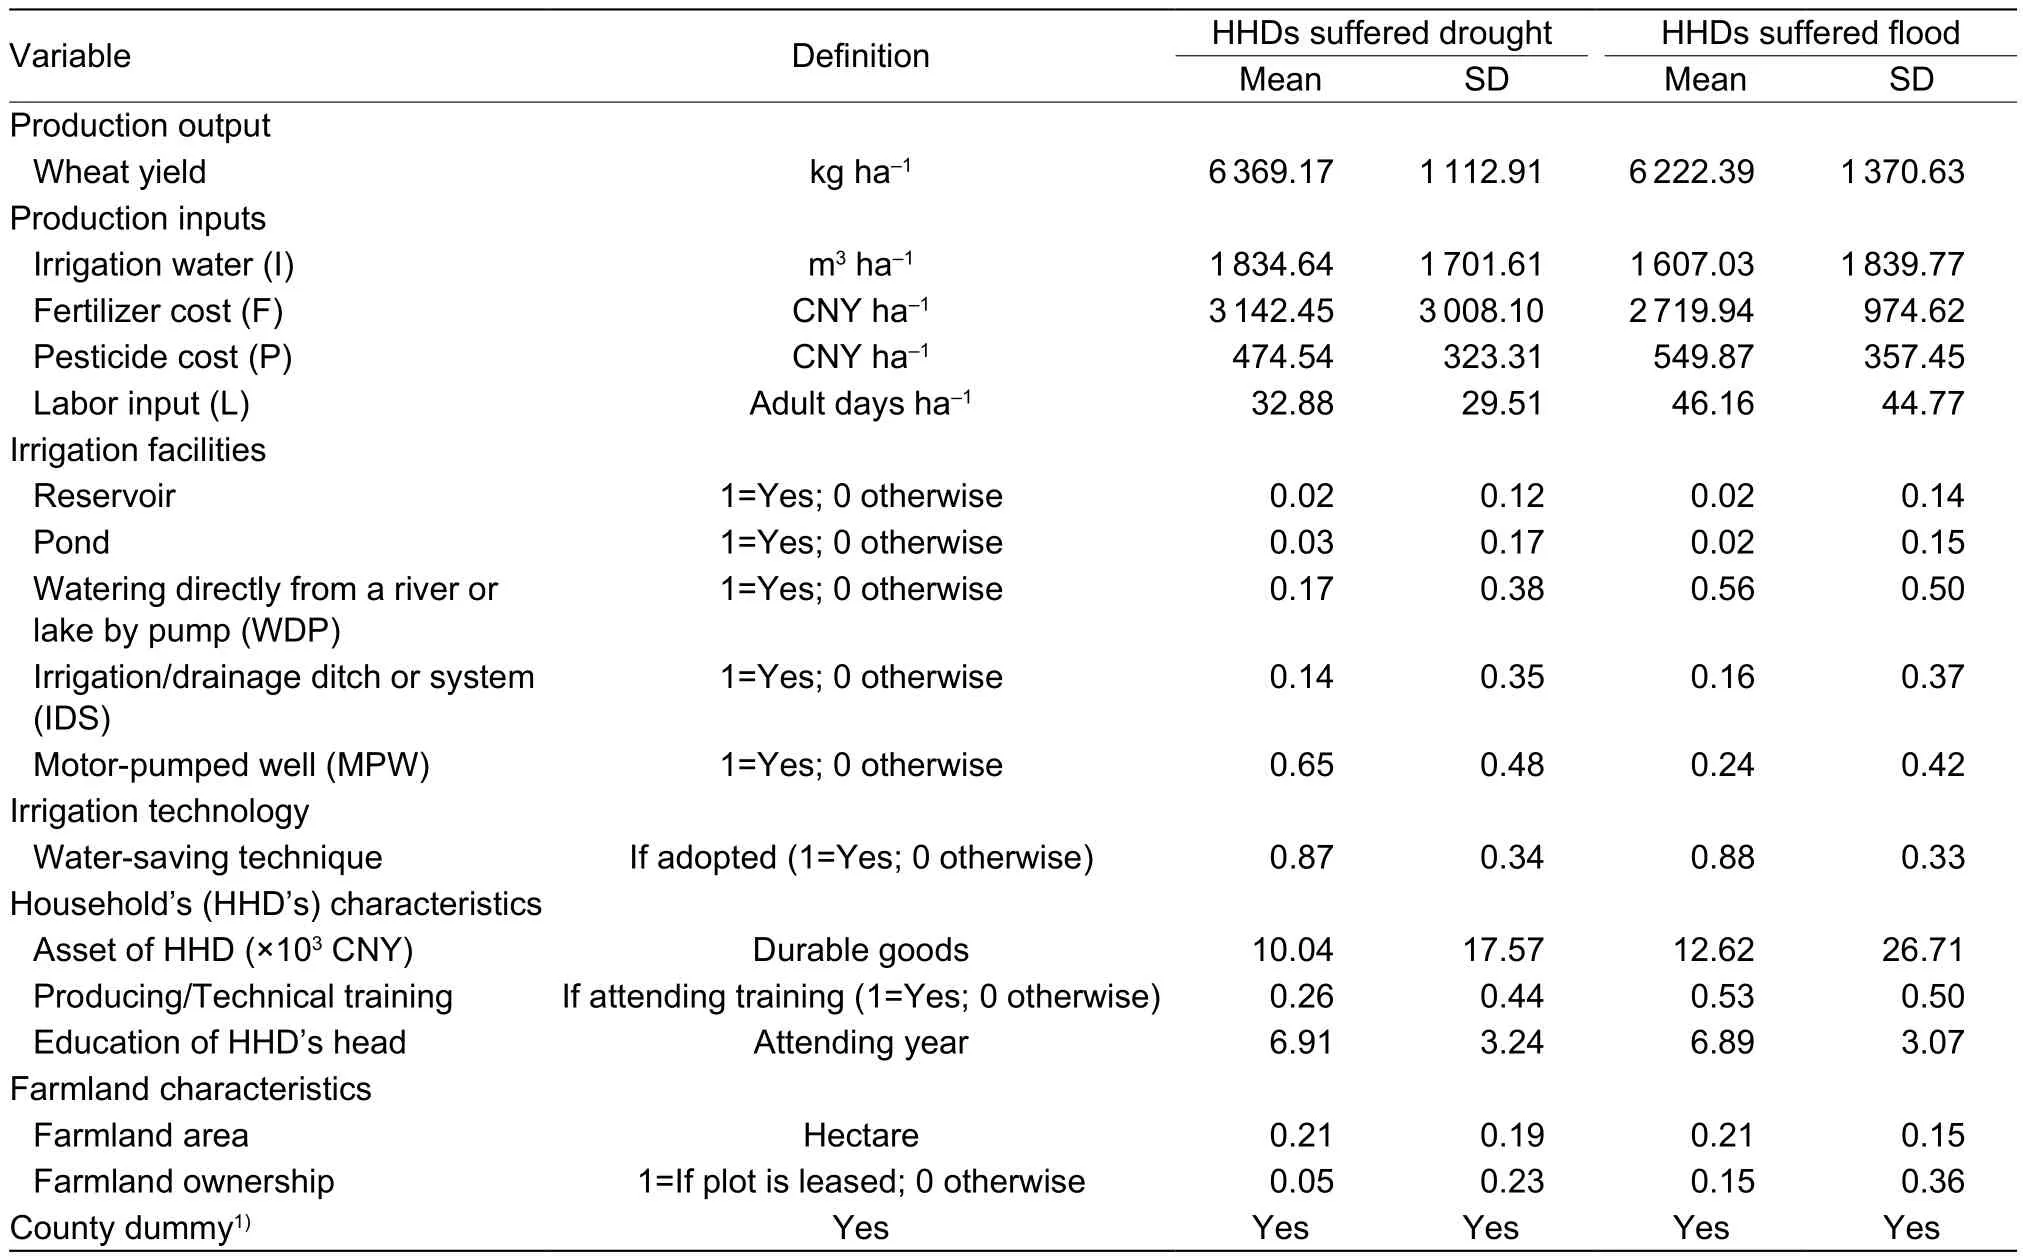
Table 3 Summary statistics of variables
HHD’s characteristicsThree main variables were used to represent the HHD’s characteristics. i) Assets controlled by the HHD’s are measured as the value of durable goods where the sample HHDs have an average value >10 000 CNY of durable goods. ii) A variable relating to whether the HHDs have received technical training within the last three years (2010–2012), revealed data indicating that HHDs in counties which suffered flooding (53%) had a higher probability of receiving training than those counties which experienced a drought (26%). iii) The education of the household head (years) was determined, which in our sample, the average education was 6.9 years.
Farmland characteristicsThere are two variables related to farmland characteristics. i) The farmland plot areas were relatively small, with an average farm area of only 0.21 ha(Table 3). ii) Farmland ownership indicates whether the farmland is leased or not. In our survey there were only 5% tenant farmers and 95% farmland owners in the areas which suffered drought, and 15% tenant farmers and 85%farmland owners in areas which suffered flooding.
In addition, we use county dummy variables (fixed effects at the county level) to control for the effects of county specific factors that do not change over time (Table 1).
4. Results and discussion
4.1. The SFP estimate and test
Since warmer conditions and decreased precipitation have typically been associated with increased drought, increased rainfall is likely to cause increased flooding (Piaoet al. 2010),and irrigation will be directly affected by that precipitation(Denget al. 2014). Floods and droughts have different effects on agricultural production and irrigation behavior,therefore, two subsamples of farm households from the counties that have experienced floods and droughts are separately estimated in this paper. Model I denotes the estimation results for farm households which suffered from drought, and Model II denotes the estimation results for farm households which suffered from a flood.
The estimated parameters of the stochastic production process are presented in Table 4. It is apparent that all the first-order parameters have the anticipated positive sign and magnitude between 0 and 1. In addition, the ratio of farm-specific to total variability,γ, is 99.17 and 96.75% at the 1%significant level for the Model I and Model II, respectively,indicating that output variability is mostly caused by the error term of technical inefficiency and hence the remaining portion is due to factors outside the control of HHDs.
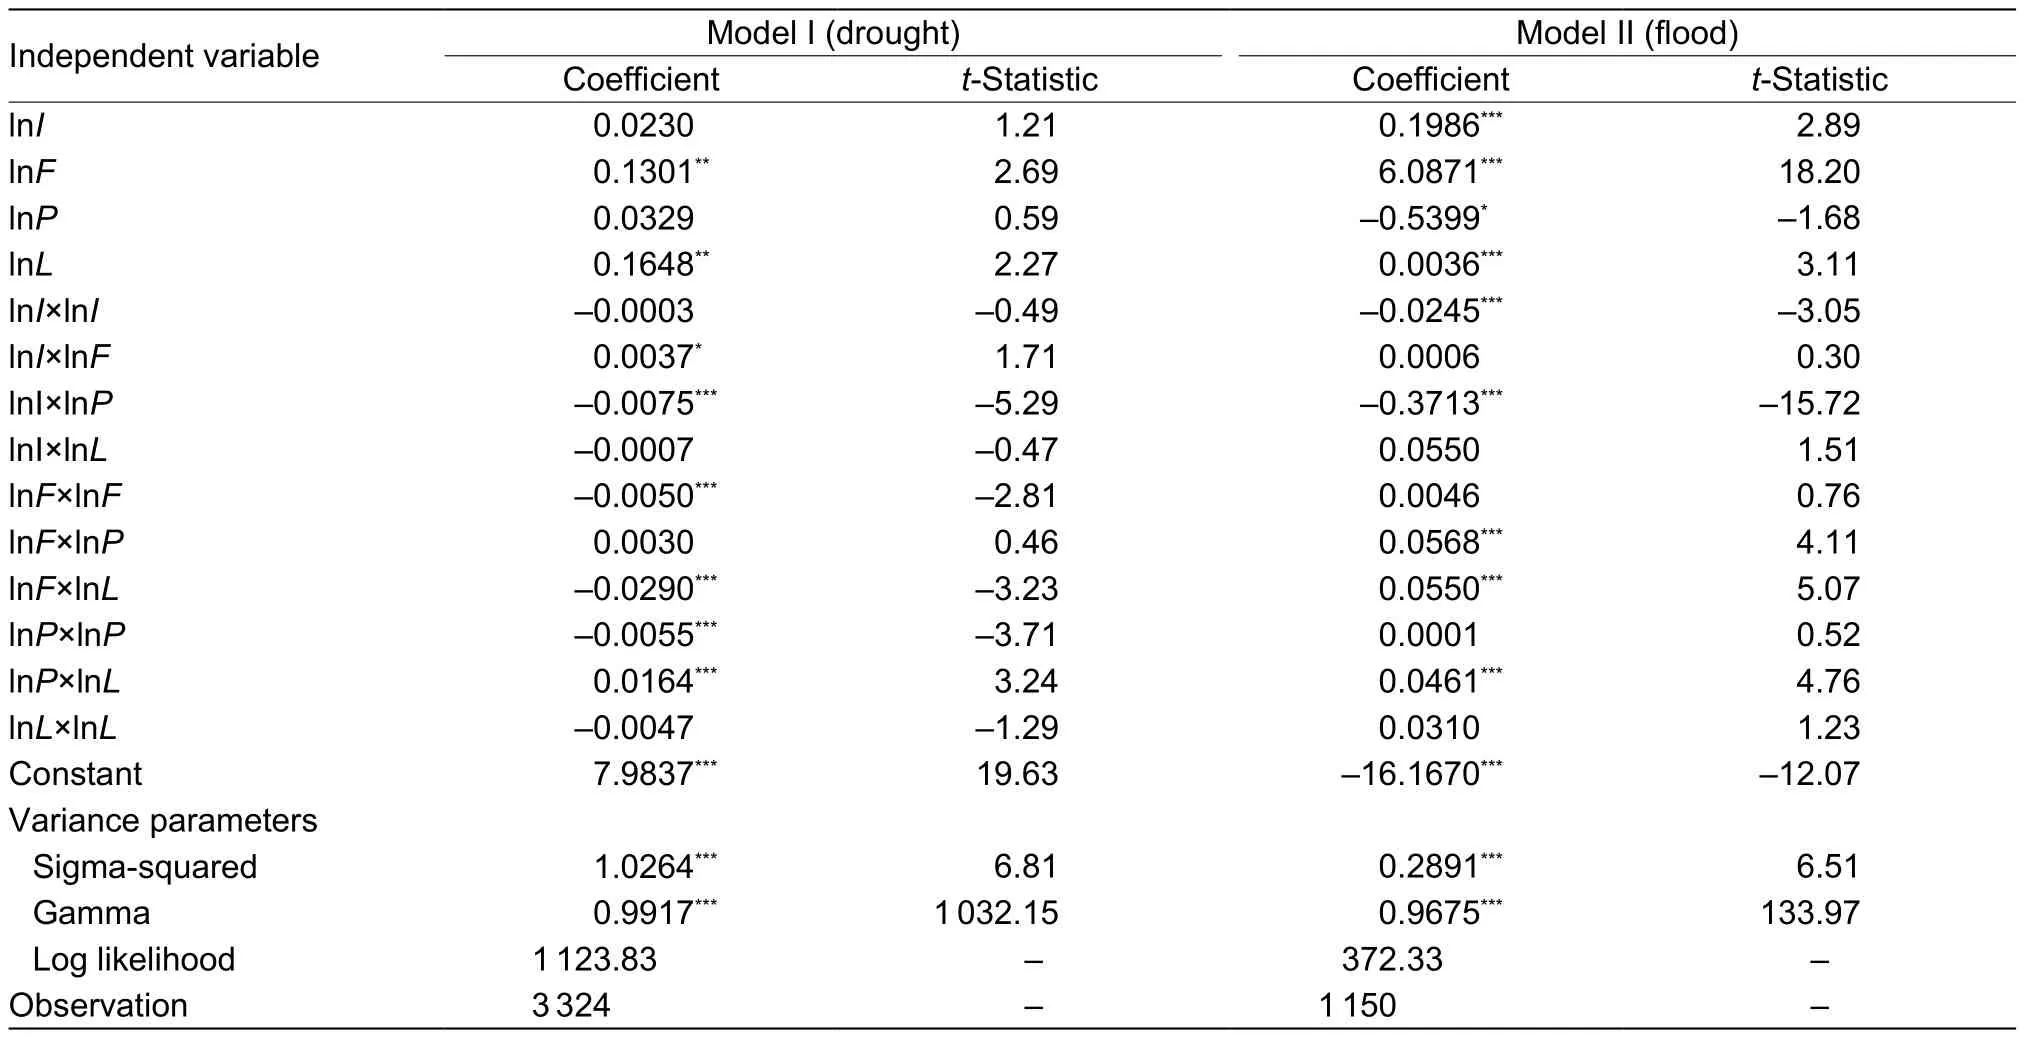
Table 4 The estimated results of translog stochastic frontier production function for wheat production
A further demonstration of the appropriateness of the production function specification is shown in Table 5.These results show several important features. First, they show that the Cobb-Douglas function does not adequately represent the production structure of farm HHDs in the sample as the null hypothesis thatβ5=β6=β7=β8=β9=β10=β11=β12=β13=β14=0 is rejected at the 5% level of significance(Table 5). Second, the null hypothesis thatγ=0 is rejected at the 5% level of significance (Table 5), indicates that the technical inefficiency effects are stochastic and that a significant part of output variability can be explained by the existing differences in the degree of output-oriented technical inefficiency. Third, the results show that the inefficiency effects are absent (δi=0), being rejected at the 5% level of significance (Table 5), indicating that the majority of HHDs in the sample operate below the output-oriented technically efficient frontier (Karagianniset al. 2003; Dhehibiet al. 2007).
In addition to the points discussed above, the coefficients of the irrigation water (I), fertilizer cost (F), pesticide cost(P) and labor input (L) and their cross terms, have the expected signs. The variable lnIhas a positive effect on wheat production, while the squared irrigation water lnI×lnIhas a negative sign in both Model I and Model II. Theseobservations suggest that irrigation water has an inverted U-shape relationship with wheat yield, suggesting that increasing irrigation water would increase wheat yield significantly. However, if a given HHD irrigates by using‘too much’ water, the wheat yield would decline. It can be clearly seen that the cross term of lnI×lnFpositively affects production, while the cross term lnI×lnPhas significantly negative impacts on production. Collectively, these results suggest that the interaction of irrigation water and fertilizer would increase wheat yield, while the interaction of irrigation water and pesticide would decrease yield.
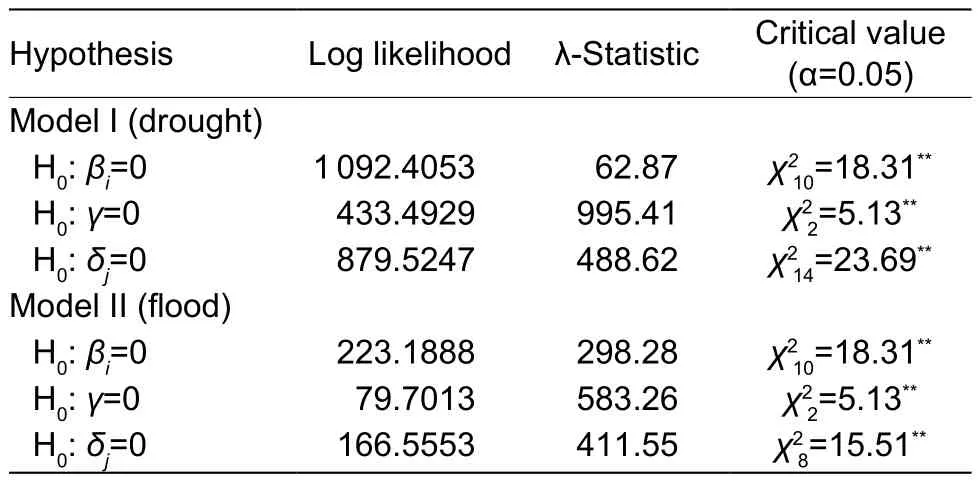
Table 5 Model specification tests
4.2. The estimated IEs
Irrigation efficiency (IE) is estimated from eq. (8). Table 6 shows the distribution of the IEs across irrigation facilities,while Figs. 1 and 2 display plots of the distribution acrossdifferent IE levels for the counties that experienced droughts and floods, respectively, during the period of 2011–2012.Based on Table 6 and Figs. 1 and 2, several observations can be made.
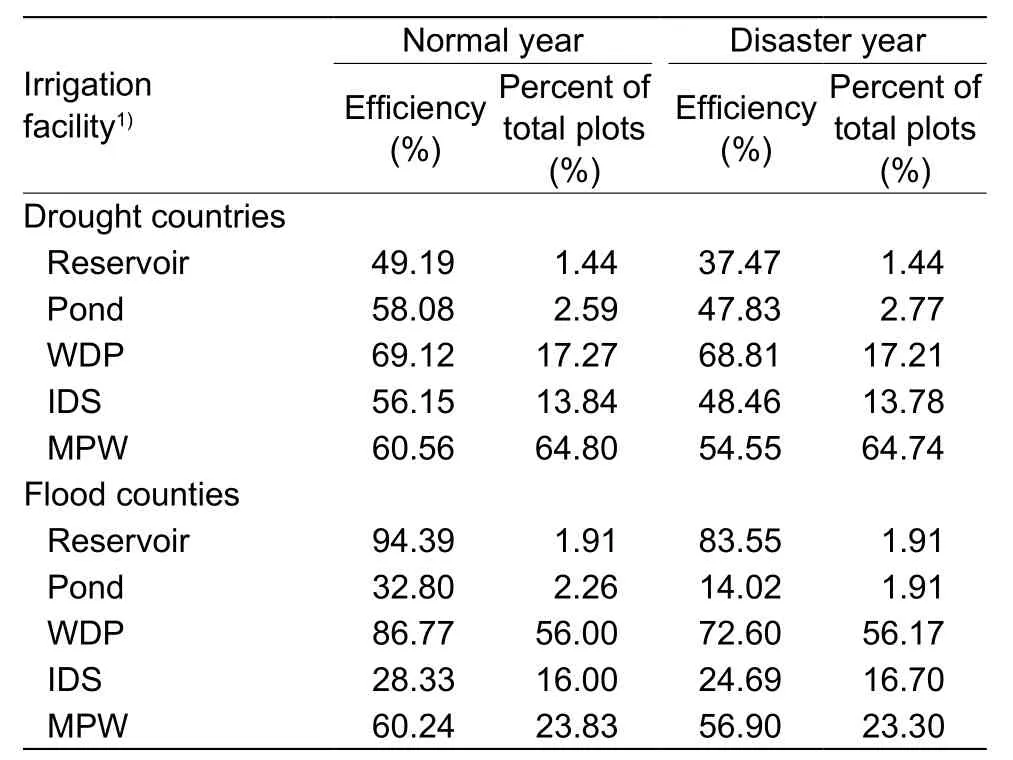
Table 6 Irrigation efficiency and plot distribution across irrigation facilities for five provinces
Firstly, there are apparent variations in the IEs across irrigation facilities (Table 6). For example, in the drought years, the highest IE is 68.81% (WDP), followed by 54.55%(MPW), 48.46% (IDS), 47.83% (Pond), and the lowest is 37.47% (Reservoir) in the counties that once suffered from drought. Similarly, in the flood years, the highest IE is 83.55% (Reservoir), then 72.60% (WDP), 56.90% (MPW),24.69% (IDS), and the lowest is 14.027% (Pond) in the counties that once suffered from floods.
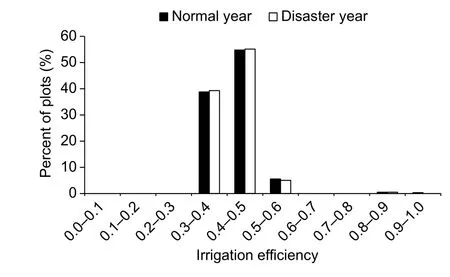
Fig. 2 Plot distribution across irrigation efficiency levels for flood counties.
Secondly, the IE is lower in the disaster years than that in the normal years. From Table 6 it can be clearly observed that the IE of each type of irrigation facility is approximately 5–10% less in the disaster years than that in the normal years. For example, the IEs are 49.19 and 58.08% in the normal years, while they are 37.47 and 47.83% for Pond and WDP, respectively, with a 10% difference. Similar observations can be made for flood counties. These findings suggest that irrigation water usage is less efficient when the disasters occur. Therefore, it is important to improve irrigation efficiency, especially in the drought years.
Thirdly, variations in the IEs among plots are also very large. In fact, the plots suggest a very different distribution between counties that suffered from drought (Fig. 1) and counties that suffered from floods (Fig. 2). For example, Fig.1 clearly shows that approximately 35% of plots are located in the below 10% IE interval, while fewer than 5% of plots are located in the over 70% IE interval, and this pattern applies to both normal and drought years. Similarly, Fig. 2 shows that the plot distribution is quite concentrated, with most plots identified to be in the range 30–60% IE. This finding may be closely correlated with the distribution of irrigation facilities (as shown in Table 6) as water supply reliabilities actually differ across irrigation facilities.
In summary, the analyses above lead to several conclusions. i) The IE is lower when the extreme weather events occur (drought or flood); ii) There are apparent variations in the IE across irrigation facilities; and iii) The plots display a concentrated distribution across the IE levels when flooding occurs, while the plots display an extremely left-skewed distribution across the IE levels when a drought occurs. These findings are consistent with the previous literature (e.g., Wang 2010; Xu and Huang 2012; Songet al.2014; Liu 2016; Yinet al. 2016). However, these conclusions also lead to further questions, such as, why are the IEs so low in China? What causes the differences in the IEs across the disaster years and normal years? Will different irrigation facilities lead to various IEs? These are some of the questions we now turn to in the next section.
4.3. Possible determinants of lEs
From the observations above (Table 6, Figs. 1 and 2), there are apparent differences in the IEs across drought- and flood-prone counties and across disaster years and normal years at the plot level. In order to accurately identify the IE determinants, we used four regression models to account for four different scenarios. The estimated results of the IE determinants for a drought years and normal years (Table 7)and for flood years and normal years (Table 8) show several patterns.
First, all types of irrigation facilities, except for ponds,have significant positive impacts on the IEs in the normal years, but none of them have significant impacts in the drought years in the counties (Table 7). The estimated results also indicate that compared with adopting IDS, the IEs would be higher if the HHDs used reservoirs, WDP or MPW as irrigation facilities. This finding also clearly indicates that the investments or application of irrigation facilities are more efficient for the improvement of IEs in the normal years, rather than in the drought years. Alternatively,one might conclude that, the irrigation facilities might not significantly affect the IEs when the HHDs encounter a drought disaster.
Secondly,given such results, it is important to consider how HHDs can improve IEs when they encounter a drought year? The estimated results show that the coefficients of both water-saving irrigation technologies and producing/technical training are significant at the 5% level in the drought years (Table 7). This suggests that it is important for the HHDs to receive production and technical training and adopt water-saving irrigation techniques if they want to improve the IEs in the drought year. In contrast, constructing or purchasing more irrigation facilities may not help them during the drought seasons. Therefore, in order to improve the IEs without reducing crop yields, the government should provide more agricultural technical training programs and enhance the agricultural water-saving techniques in the rural areas, as opposed to encouraging the HHDs to construct or purchase more irrigation facilities, when extreme weather events occur. In that regard, it is worth noting the similar findings of Chebilet al.(2012), Frijaet al.(2009),Karagianniset al.(2003) and Watto and Mugera (2014).Moreover, water-saving techniques also work well in these counties in a normal year (Table 7).
Thirdly, increasing the HHDs ability to survive environmental disasters is another significant determinant of the improvement of IEs. The estimated results show that the assets of the HHDs have a significantly positive effect on the IEs in both drought and flood scenarios (Tables 7 and 8). As a result, the poor generally lack sufficient capital or labor, which not only restricts their thinking but also their activities. For example, they may be incapable of maintaining the deteriorated irrigation infrastructure which suffers from seepage, or even adopting new farm management measures, such as planting drought-resistant varieties (Wanget al. 2014; Tanget al. 2015).
Finally, our results show different scenarios for the effects of irrigation facilities on the IEs in the counties that once suffered a flood (Table 8). The estimation results show thatonly reservoirs could significantly improve IE, suggesting the importance of reservoirs, particularly, in the counties that often encountered floods. But it is now well known that reservoirs are the most effective irrigation facility to absorb excess water within a short period of time, for example, in the flood season. This finding suggests that in the areas where flooding often occurs, either constructing new reservoirs or maintaining existing reservoirs could be effective for the HHDs to improve their IE. This result is supported by other studies, such as Loucks and van Beek (2005), Liet al. (2010)and Liuet al.(2015), who argue that reservoirs are one of the most efficient infrastructures and irrigation facilities for integrating water resources by providing adequate storage during the flood season. However, such facilities may be difficult for HDDs to construct because of the very high costs involved, and here government participation would have a unique role to play.
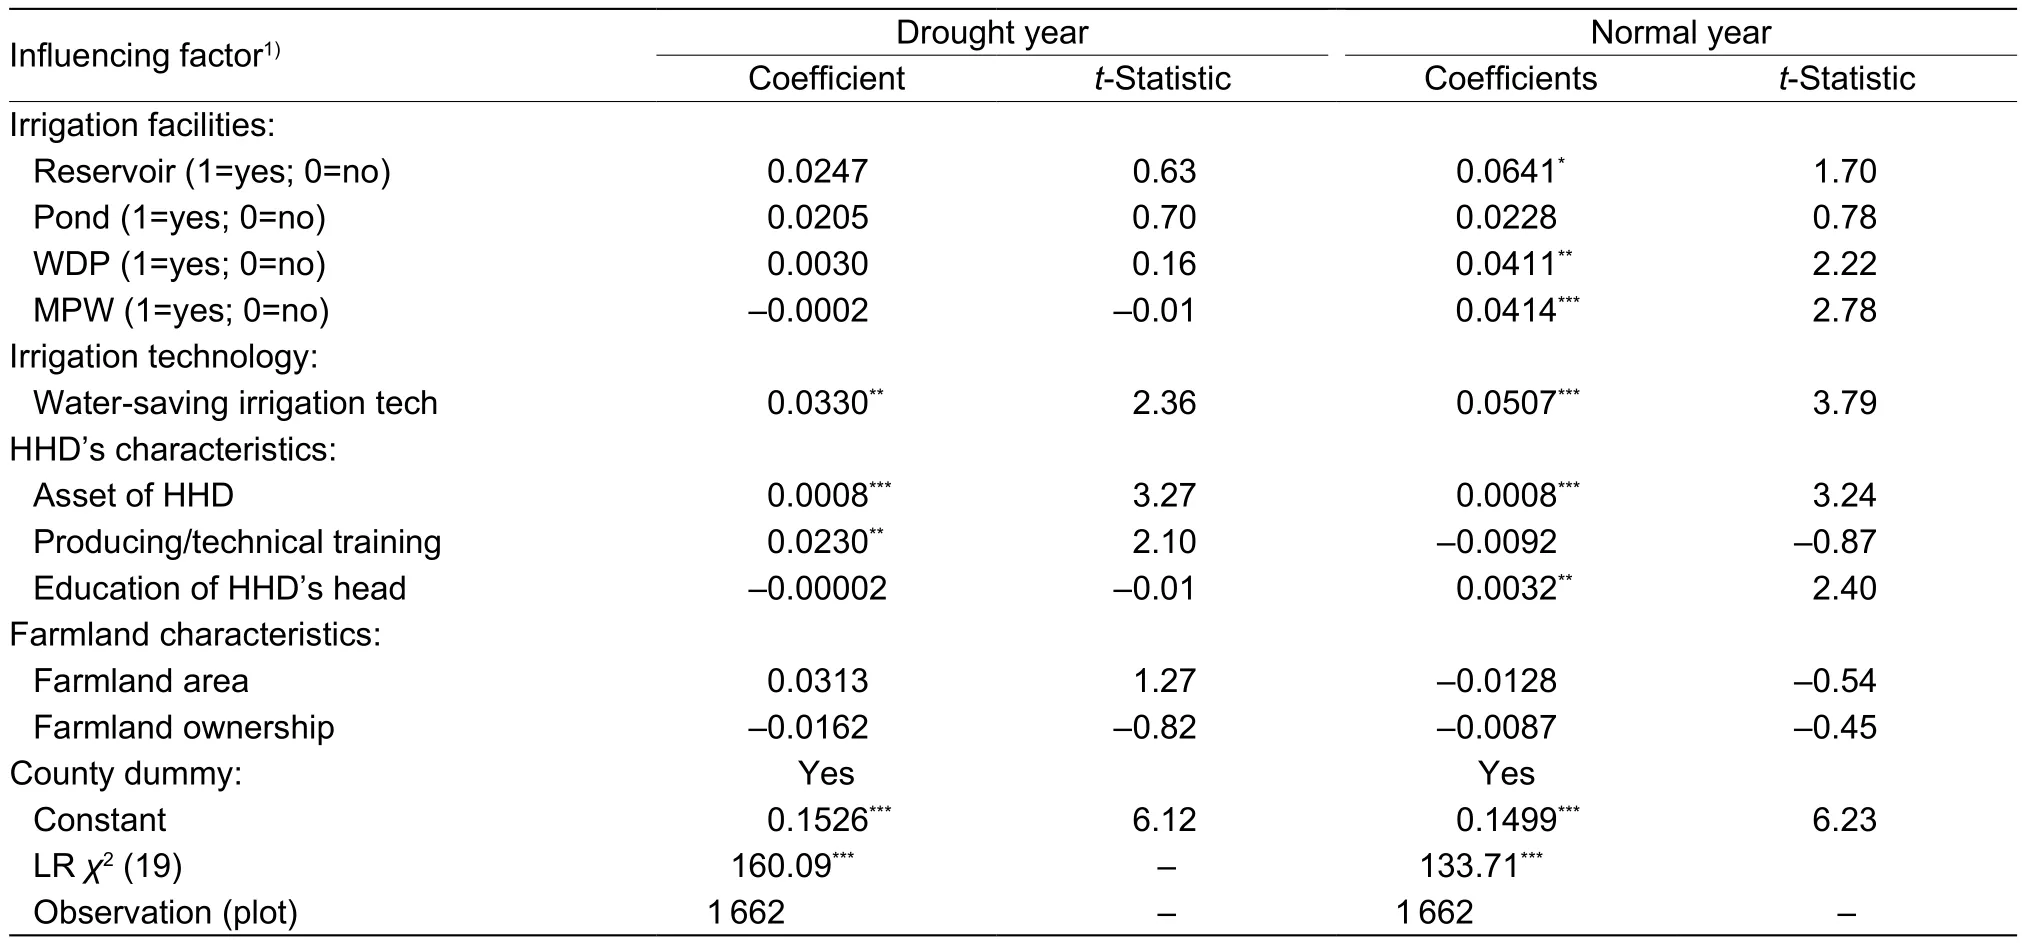
Table 7 The estimated results of irrigation efficiency model for the counties suffering drought
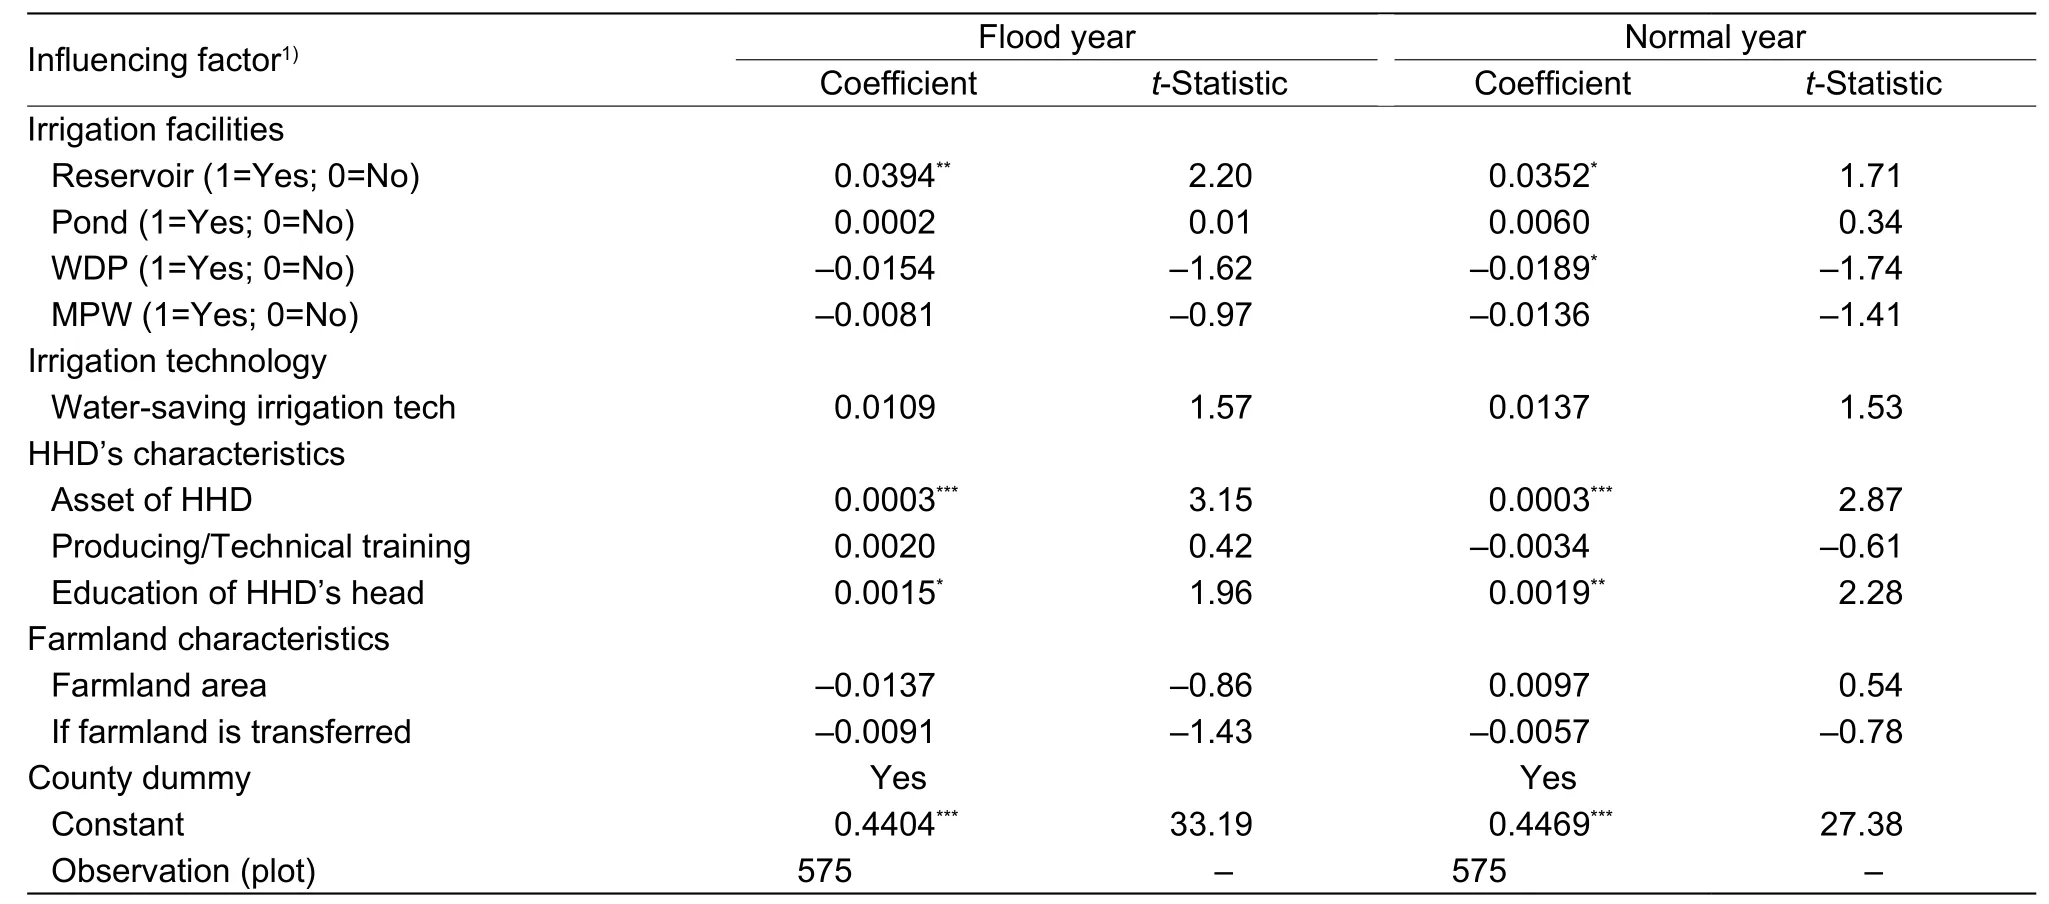
Table 8 The estimated results of irrigation efficiency model for the counties suffering flooding
5. Conclusion and implications
In this paper a translog frontier production function approach was used to derive a model to estimate irrigation efficiency,and then a Tobit model was used to identify determinants of irrigation efficiency when extreme weather events occur.The results were then applied to a large-scale household field survey conducted in five east-central provinces in China. From the estimated results, the following conclusions and policy implications are made.
Firstly, irrigation efficiency was found to be relatively low in the drought years. The survey descriptive statistics show that the HHDs use more irrigation water when experiencing extreme weather events (Table 2). The estimated results confirm that the irrigation efficiency was lower in the disaster years, characterized by extreme weather events, than in the normal years (Table 6). Therefore, the HHDs should make a choice between output (yield) and input (irrigation cost).Furthermore, additional agricultural and economic research should help the HHDs locate the optimal level of irrigation water useviatechnical training programs, especially in the drought seasons.
Secondly, water-saving irrigation techniques and producing/technical training programs could significantly improve irrigation efficiency during drought seasons. In other words, the government should encourage HHDs to take part in production and technical training programs and adopt water-saving irrigation techniques in the drought seasons, rather than investing in, or constructing, more irrigation facilities. Furthermore, the government should provide more agricultural technique training programs to enhance the agricultural water-saving techniques extension efforts in the rural areas.
Thirdly, when crop production encounters a flood disaster,the estimated results show that only reservoirs significantly improve irrigation efficiency, particularly in the counties that often encounter floods. This finding suggests that in the areas where the flooding often occurs, especially, in the southern provinces, the government should construct more reservoirs, or maintain existing reservoirs for agricultural production, in order to improve or maintain irrigation efficiency.
Fourthly, whenever crop production encounters a drought or flood season, the estimation results show that increasing the HHDs economic resilience is a significant factor in the improvement of irrigation water efficiency. This suggests that economic resilience is a useful way for the HHDs to survive natural disasters. Governments could pay more attention to this and try to maintain the HHDs income level.
Fifthly, irrigation facilities always play a crucial role in the improvement of irrigation water usage efficiency. China has a huge potential to help farmers improve their ability to survive natural disasters. Perhaps one of the most important issues is to ensure that farmers’ income levels are maintained during extreme periods, particularly if they live in areas prone to severe weather events.
Acknowledgements
This study was supported by the State Social Science Funds of China (14BGL093), the Specialized Research Fund for the Jointed Doctoral Program of Higher Education of China(20124105110006), and the International Development Research Center (107093-001).
 Journal of Integrative Agriculture2018年8期
- Journal of Integrative Agriculture的其它文章
- Is the “One Province One Rate” premium policy reasonable for Chinese crop insurance? The case in Jilin Province
- lmpacts of invasive Iris pseudacorus L. (yellow flag) establishing in an abandoned urban pond on native semi-wetland vegetation
- Changes in soil biochemical indicators at different wheat growth stages under conservation-based sustainable intensification of rice-wheat system
- Accumulation and bioavailability of heavy metals in a soil-wheat/maize system with long-term sewage sludge amendments
- Effects of long-term green manure application on the content and structure of dissolved organic matter in red paddy soil
- iTRAQ-based quantitative proteomic analysis reveals key pathways responsible for scurs in sheep (Ovis aries)