
Changes in soil biochemical indicators at different wheat growth stages under conservation-based sustainable intensification of rice-wheat system
2018-08-06 12:08:34TanushreeBeraSandeepSharmaThindYadvinderSinghSidhuJat
Tanushree Bera, Sandeep Sharma, H. S. Thind, Yadvinder-Singh , H. S. Sidhu M. L. Jat
1 Department of Soil Science, Punjab Agricultural University, Ludhiana 141004, India
2 Borlaug Institute for South Asia (BISA), International Maize and Wheat Improvement Center (CIMMYT), Ludhiana 141004, India
3 CIMMYT, National Agricultural Science Complex, New Delhi 110012, India
Abstract Soil microbes play critical roles in soil biogeochemistry, soil biological health and crop productivity. The current study evaluated the effects of tillage and residue management on changes in soil biochemical indicators at different growth stages of wheat after 5 years of rice-wheat system. Nine treatment combinations of tillage, crop establishment and crop residue management included three main plot treatments applied to rice: (1) conventional till direct dry seeded rice (CTDSR), (2)zero till direct dry seeded rice (ZTDSR), and (3) conventional puddled manual transplanted rice (CTPTR) and three subplot treatments in subsequent wheat: (1) conventional tillage with rice residue removed (CTW-R), (2) zero tillage with rice residue removed (ZTW-R) and (3) zero tillage with rice residue retained as surface mulch (ZTW+R). Irrespective of rice treatments, ZTW+R treatment had higher soil biochemical indicators compared with ZTW-R and CTW-R at all the growth stages of wheat. Generally, all the biochemical indicators were the highest at the flowering stage of wheat. Residual effect of rice treatments was also significant on biochemical quotients in wheat, which were the highest under ZTDSR followed by CTDSR and CTPTR. The present study provided three sensitive and reliable biochemical indicators (microbial biomass,basal soil respiration and microbial quotient) which respond rapidly to change in tillage and residue management practices in RWS of South Asia.
Keywords: microbial metabolic quotients, tillage practices, residue retention, cropping system
1. Introduction
Rice-wheat system (RWS) is a major crop rotation for food security, employment, income and livelihood for millions of people in Asia (Ladhaet al.2009; Singhet al.2014). This system occupies about 13.5 million hectares in the Indo-Gangetic Plain (IGP) of South Asia (Gupta and Seth 2007). Intensive tillage, imbalance use of fertilizers,depletion of water resources and environment pollution have led to stagnation or declining trends in yields of the RWS in many parts of South Asia (Srinivasanet al.2012). This calls for immediate solution by adopting better management practices for improving soil and environment quality, and maintain social ecosystem. Conservation agriculture (CA)practices (zero tillage and residue retention) are gaining momentum as alternate to conventional practices for addressing the issues of energy, labour, water scarcity,environment quality and climate change (Gathalaet al.2013; Jatet al.2016), and for sustained and improved productivity of RWS in South Asia (Dikgwatlheet al.2014;Zhanget al.2014) .
Nearly 44.5 Mt of rice residues are burned annually in North-West India causing serious environmental pollution(Yadvinder-Singh and Sidhu 2014).In-situmanagement of rice residue as surface mulch is one practice for its effective disposal that can decrease air pollution and increase soil organic carbon (SOC) content (Soon and Lupwayi 2012).Recently, a new seeding machine called Turbo Happy seeder has been developed for direct drilling of wheat into heavy loads of rice straw as an alternative to burning(Sidhuet al.2015). Zero tillage in combination with surface retention of rice residue conserves soil water and improves overall soil health through enhancing soil organic matter content (Sidhuet al.2007; Gathalaet al.2013).
SOC plays an important role in improving all aspects of soil quality (structure, water relations, chemical fertility and biodiversity) because it provides energy and substrates for microbial metabolism, and promotes biological diversity(Malhiet al.2001; Loveland and Webb 2003). Thus, total and labile SOC pools (e.g., microbial biomass and enzyme activities) are important indices for assessing soil quality(Haynes 2005; Jinet al.2009). Moreover, the labile fractions are very sensitive to changes in soil biological quality during the process of restoration (Pajareset al.2009). Microbial biomass assessment in combination with organic carbon and basal soil respiration provide an overall estimate of soil development and degradation (Insamet al.1989).
Previous studies showed that reduced/no-tillage and straw management practices caused significant increases in the SOC content, microbial activity and C-cycling processes in different environments, mainly under non-rice based cropping systems (Luoet al.2013; Weiet al.2015).Until now no systematic study has been conducted on the impact of CA practices in RWS of the North-West IGP of India towards soil biochemical indicators at different growth stages of wheat. Our scientific hypothesis was that a group of crucial and sensitive soil quality biochemical indicators would be able to assess appropriately the best critical growth stage of soil sampling during wheat growing season.Furthermore, the use of simple biochemical indicators which have meaning to farmers and other land managers will likely be the most fruitful means of linking science with CA-based practice in assessing the sustainability of management practices (Romiget al.1996). Consequently, a long-term field experiment was established for understanding the effects of CA practices on changes in biochemical indicators of soil after 5 years of RWS in the North-West IGP of India.
2. Materials and methods
2.1. Description of the experimental site and climate
A long term field experiment on irrigated RWS is in progress since 2010 on a Typic Ustochrept sandy loam soil (130 g clay kg–1, 150 g silt kg–1and 720 g sand kg–1) at the experimental farm of the Punjab Agricultural University, Ludhiana, Punjab(30°56´N and 75°52´E) in the North-West IGP of India. The surface soil (0–15 cm) layer at the initiation of experiment was non-saline (electrical conductivity of 0.36 dS m–1) with pH 7.88 and contained 4.5 g kg–1Walkley-Black carbon and 8.2 mg kg–1Olsen P (Olsenet al.1954) and 50.4 mg kg–11NNH4OAc-extractable K. The region has a subtropical climate with hot, wet summers and cool dry winters.Annual mean rainfall is 760 mm, about 80% of which occurs from June to September. The weather conditions at the experimental location during rice and wheat growing seasons were quite variable. This showed uncertainty of weather and hence climate resilient management practices are very crucial for sustainable production.
2.2. Experimental layout and treatments
The field experiment was laid out in a split plot design with three replications. Treatments consisted of three combinations of tillage and rice establishment in main plots (CTDSR, conventional till direct seeded rice; ZTDSR,zero till direct seeded rice(Oryza sativaL.); and CTPTR,conventional till puddled transplanted rice) and three combinations of tillage and residue management in sub plots in subsequent wheat (Triticum aestivumL.) (CTW-R, CT wheat with residues of both the crops removed; ZTW-R, ZT wheat with residues of both the crops removed; and ZTW+R,ZT wheat with wheat residue removed but rice residue retained as mulch). Total number of sub-plots was 36(4×3×3 replications). The sub-plot size was 5.4 m×20.0 m.The treatments were assigned to the same experimental plots in all years of the study. The treatment details are summarized in Table 1.
2.3. Soil analysis
Soil samples were collected in duplicate from surface (0–7.5 cm) and sub surface (7.5–15 cm) depths at five different growth stages: sowing; crown root imitation (20–25 days after sowing); the maximum tillering (40–45 days aftersowing); flowering (80–95 days after sowing) and maturity(120–125 days after sowing). After removing visible root debris, the soil samples were mixed, sieved (2 mm) and stored at 4°C for subsequent analysis for microbial activity.SOC was analyzed by the Walkley and Black (1934) method.Microbial biomass carbon (MBC) was measured by the chloroform fumigation extraction method (Vanceet al.1987).Two portions of moist soil (20 g oven-dry soil) were weighed,the first one (non-fumigated) was immediately extracted with 80 mL of 0.5 mol L–1. K2SO4after orbital shaking for 30 min and then filtering through Whatman no. 42. The second portion was fumigated for 24 h with ethanol-free CHCl3and then extracted as described above. Extractable organic C in soil extracts was analyzed by dichromate digestion.Biomass C was estimated as: Biomass C=2.64Ec, where, Ec is the difference of K2SO4extractable C between fumigated and unfumigated soils. Basal soil respiration of the samples were determined by trapping the evolved CO2in NaOH and the residual NaOH was then back-titrated with HCl (Alef 1995). Same procedure was followed for blank with no soil.The samples as well as the blank flasks were incubated at 30°C for 7 days. After incubation period, vial containing NaOH solution was taken out of the flask and the contents were quantitatively transferred to a 50 mL conical flask. The CO2production was calculated with the formula provided by Anderson (1982), which involves adsorption of CO2evolved during a given period of time in known volume and strength of alkali (NaOH): CO2(µg g–1)=(Blank–Sample)×Equivalent weight of CO2×Strength of NaOH/Weight of soil sample
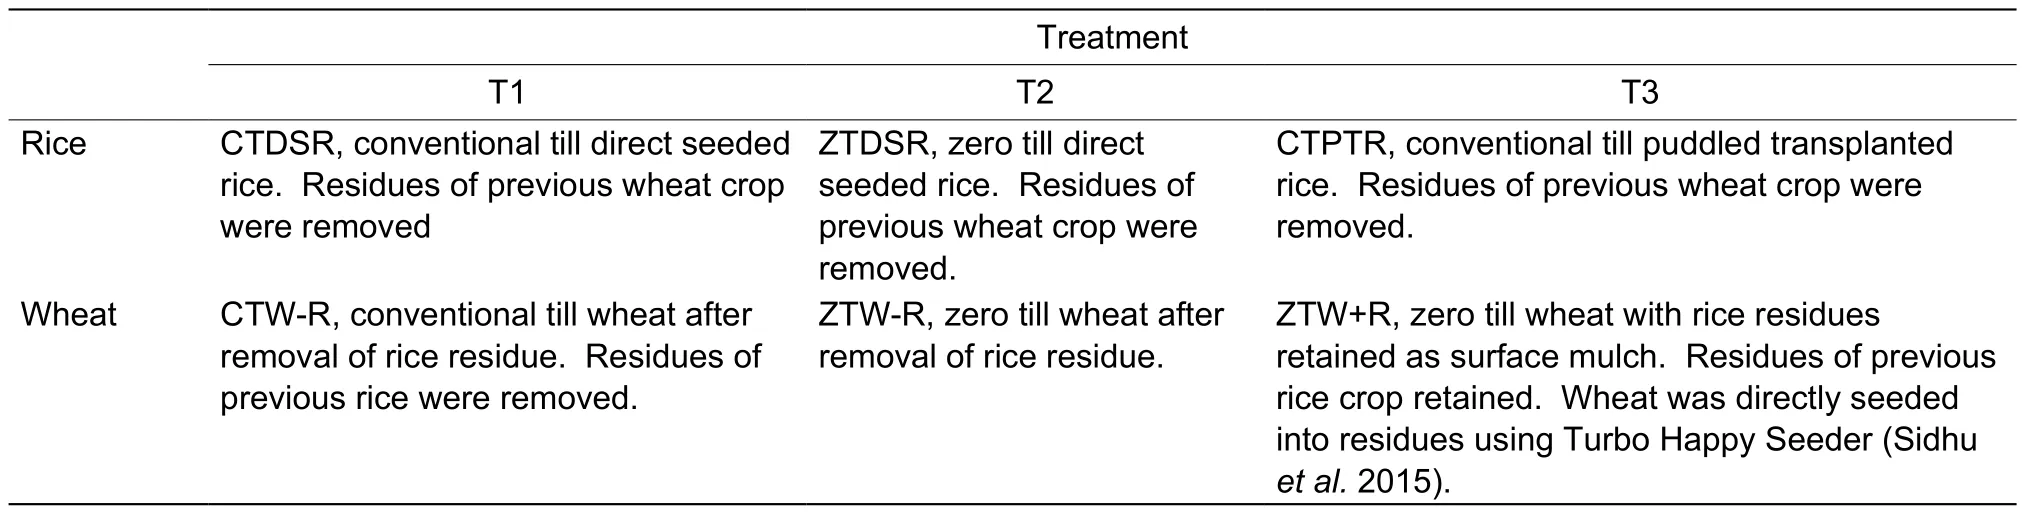
Table 1 Description of experimental treatments
Soil respiration measurements are reported as:
(1) respiration per unit of soil weight and time (basal respiration);
(2) the ratio of biomass carbon to soil organic carbon(Cmic:Corg) that reflects the contribution of microbial biomass to soil organic matter;
(3) the respiration rate per unit microbial biomass C termed as metabolic quotient (qCO2) and used as a measure for the ecophysiological status of soil microorganisms(Anderson and Domsch 1993);
(4) Total organic carbon mineralized throughout the incubation time termed as carbon mineralization quotient(qM, µg C-CO2cumulativeµg total organic carbon–1) (Pinzariet al. 1999):
2.4. Statistical analysis
All the data set were analyzed using analysis of variance(ANOVA) and differences among treatments were compared atP=0.05 level of significance using the IRRISTAT package(IRRI 2000).
3. Results
There was no significant (P=0.05) interaction effect of main treatments applied to rice and sub-treatments to wheat on MBC, soil respiration, organic carbon and biochemical indices in the two soil layers at all the growth stages of wheat.The main effects of three treatments applied to rice (residual effects) and three sub-plot treatments applied to wheat(direct effects) in the two soil layers (0–7.5 and 7.5–15 cm)were reported and discussed in the following section.
3.1. Soil MBC and basal soil respiration
The main effects of rice treatments on MBC content was significant at both maximum tillering and flowering stages of wheat at 0–7.5 cm depth and maximum tillering, flowering and maturity stages at 7.5–15.0 cm depth (Table 2). MBC content at flowering stage was higher by 29 and 37% at 0–7.5 cm depth and 31 and 57% at 15–30 cm depth under CTDSR and ZTDSR compared with CTPTR, respectively.Irrespective of rice treatments, MBC content was significantly affected by the treatments applied to wheat at all growth stages of wheat (Table 2). The MBC increased gradually from sowing and reached to a maximum value at flowering stage and then declined at wheat maturity. At flowering, MBC content in 0–7.5 cm layer was 15.1 and 23.1% higher in ZTW-R and ZTW+R compared with CTW-R, respectively. At 7.5–15.0 cm depth, MBC at flowering stage was significantly higher by 18 and 22.3% in ZTW+R as compared to ZTW-R and CTW-R, respectively.
Like MBC, basal soil respiration (BSR) was significantly affected by both rice and wheat treatments at all the wheat growth stages in the surface of 0–7.5 cm layer (Table 3).BSR showed increasing trend from sowing towards flowering stage of wheat and then declined at maturity. Among rice treatments, BSR at flowering was significantly higher by 41–50% in ZTDSR and CTDSR treatments compared to CTPTR, while the differences between the former were non-significant. Similarly among wheat treatments, BSR was significantly higher (17–20%) in ZTW+R compared to ZTW-R and CTW-R.
At 7.5–15 cm depth, BSR was generally similar at all the growth stages of wheat except at flowering stage when it was the lowest (Table 3). Among rice treatments, BSR at maximum tillering stage was significantly higher by 41–50%in ZTW+R compared to ZTW-R and CTW-R. The differences among the rice treatments in BSR at flowering stage were smaller compared to that at maximum tillering stage. There was no significant effect of wheat treatments on BSR at flowering stage. However, at maximum tillering stage BSR was 21 and 31% higher in ZTW-R and ZTW+R compared to CTW-R, respectively.
3.2. SOC
Among rice treatments, mean SOC content (averaged across wheat treatments) at 0–7.5 cm depth was significantly lower in CTPTR compared to CTDSR and ZTDSR and was the highest under ZTDSR at all the growth stages (Table 4). The SOC content in ZTDSR at flowering stage was significantly higher by 6.2% compared with CTPTR (Table 4). A similar trend was observed at the other growth stages. At 7.5–15 cm depth, rice treatments generally had no effect on SOC content. Wheat treatments showed significant effect on SOC content in both soil layers (Table 4). At 0–7.5 cm depth, SOC content under ZTW+R, was significantly higher compared with ZTW-R which had significantly higher SOC content compared to CTW-R at all the growth stages of wheat (Table 4). In general, SOC content was the highestat wheat maturity compared with the other growth stages.SOC content in 0–7.5 cm layer in ZTW+R at harvest was increased by 7.6 and 9.9% compared with ZTW-R and CTW-R, respectively.
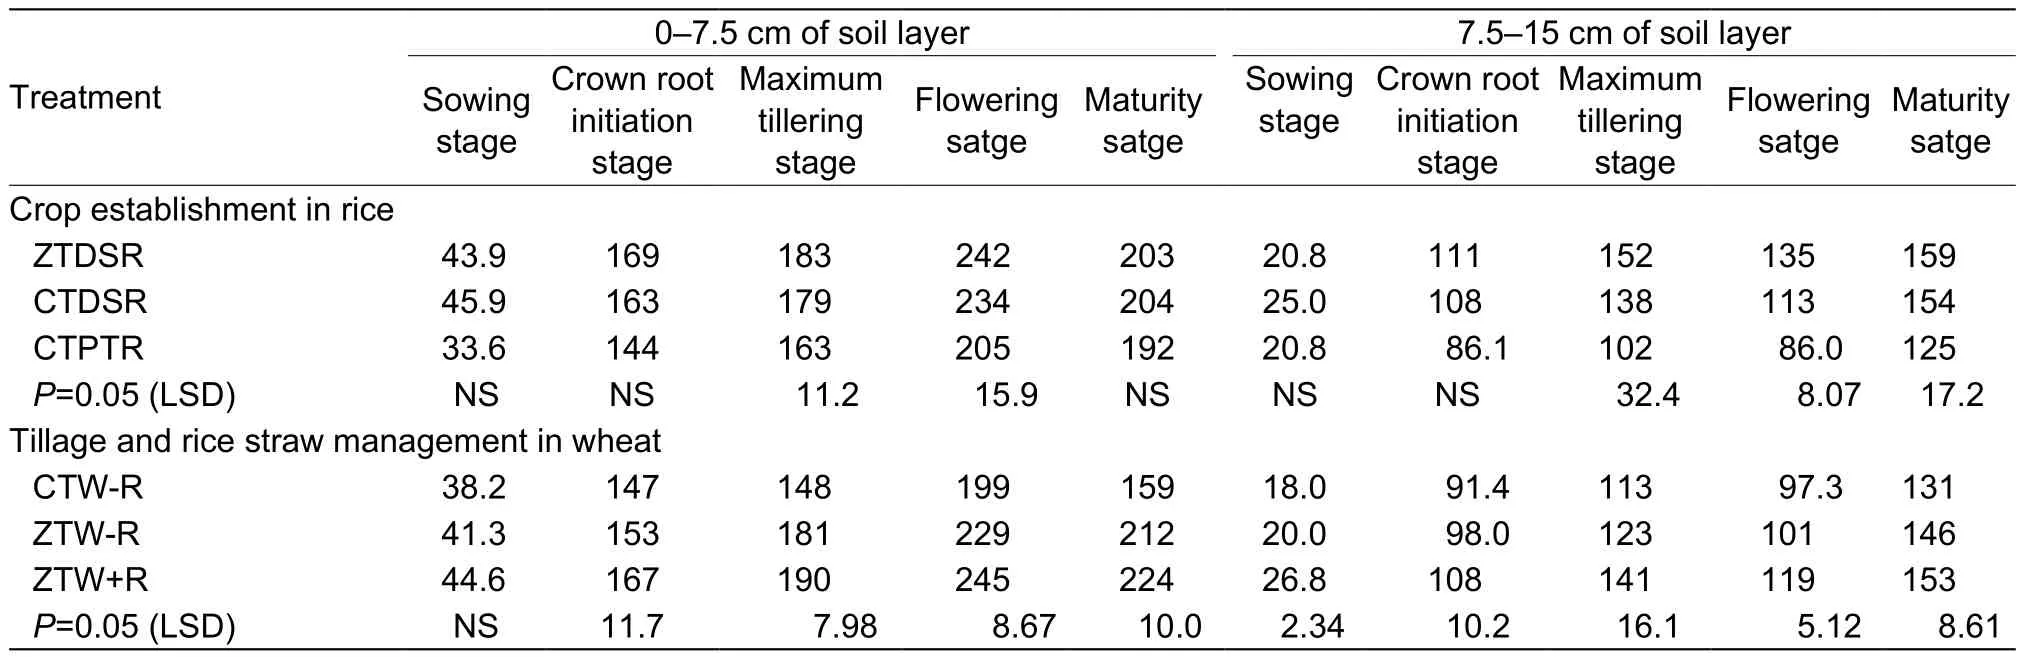
Table 2 Soil microbial biomass carbon (MBC, µg g–1 dry soil) activity during different growth stages of wheat in different layers as influenced by tillage, rice straw management and rice establishment systems
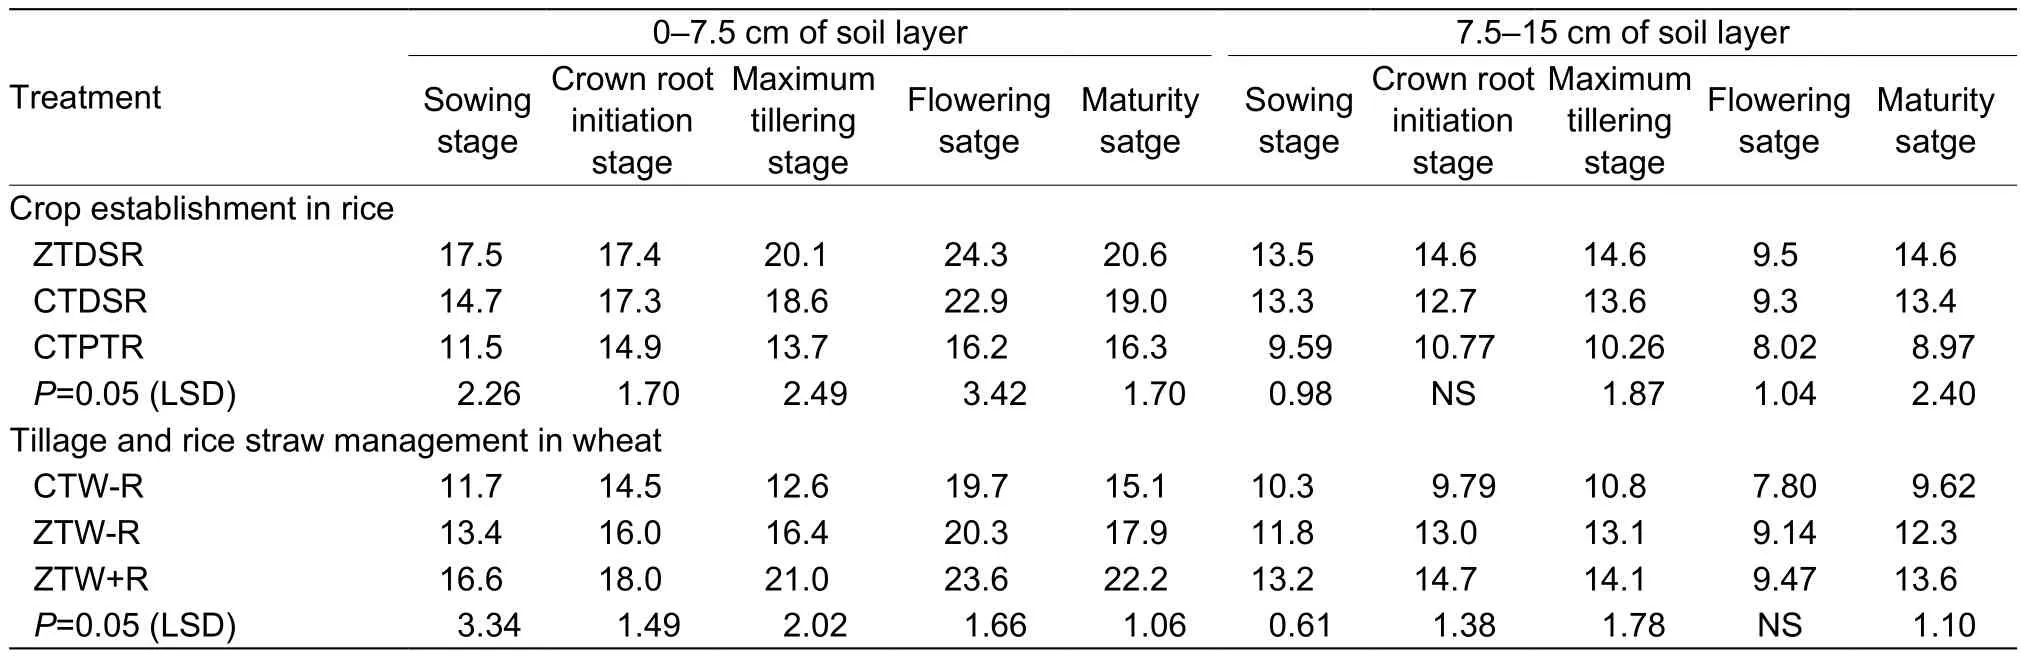
Table 3 Basal soil respiration (BSR, µg CO2 g–1 soil d–1) during different growth stages of wheat in different layers as influenced by tillage, rice straw management and rice establishment systems
3.3. Microbial quotient
Among rice treatments (residual effects of rice establishment methods), the microbial and carbon mineralization quotients were significantly higher under ZTDSR compared with CTDSR and the lowest in CTPTR. At flowering stage,the microbial quotient in ZTDSR treatment was increased significantly by 29.2% compared with CTPTR, respectively(Table 5). Corresponding increase was 44.3% for carbon mineralization quotient (Table 6). In contrast, the metabolic quotient at all the growth stages of wheat was similar under different rice establishment methods (Table 7).
In case of wheat treatments, soil microbial and carbon mineralization quotients were the highest under ZTW+R as compared with ZTW-R and CTW-R at all the growth stages of wheat (Tables 5 and 6). The microbial and carbon mineralization quotients at 0–7.5 cm depth were the highest at flowering stage compared with other growth stage. At flowering stage, microbial quotient under ZTW+R was 24.6 and 20.7% higher compared with ZTW-R and CTW-R,respectively. The corresponding increase at flowering stage in ZTW+R was 16.2 and15.8% for carbon mineralization quotient, respectively (Table 6). But, metabolic quotient was the highest at sowing stage than other growth stage of wheat in both the layers. At sowing stage, metabolic quotient under ZTW+R was 15.2 and 11.8% lower compared with ZTW-R and CTW-R, respectively (Table 7).
4. Discussion
Tillage, straw management and cropping systems are often directly related to changes in the SOC content in agricultural soils (Tonget al.2009). In our study, surface retention ofrice residue on ZT plots (ZTW+R) increased SOC content by 7.6 and 9.9% compared with CTW-R and ZTW-R in the surface layer (Table 6). Compared with CT, zero tillage along with surface residue as mulch possibly reduced the rate of oxidation of both SOC and crop residue (Yadvinder-Singhet al.2010; Jamunaet al. 2016), thereby improving the SOC content. In the present study, SOC content was the highest at wheat harvest compared with that at early growth stages,which may be due to increased input of carbon through roots and increased contribution of rice residue to SOC content due to increase in its decomposition over time (Menget al.2005; Tamilsalviet al.2014).
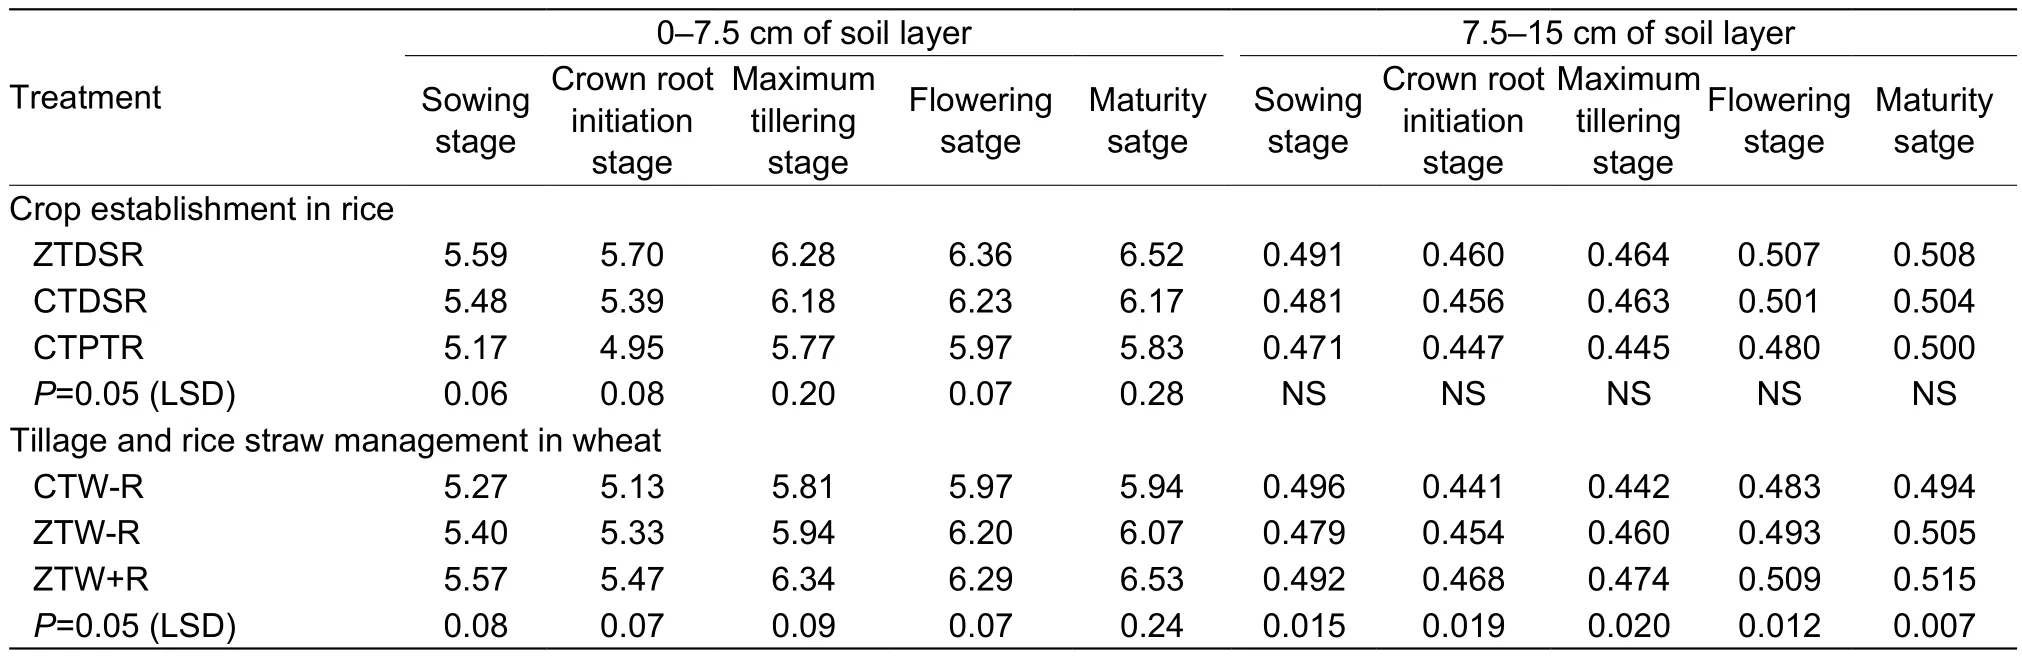
Table 4 Soil organic carbon (SOC, g kg–1) during different growth stages of wheat in different layers as influenced by tillage, rice straw management and rice establishment systems
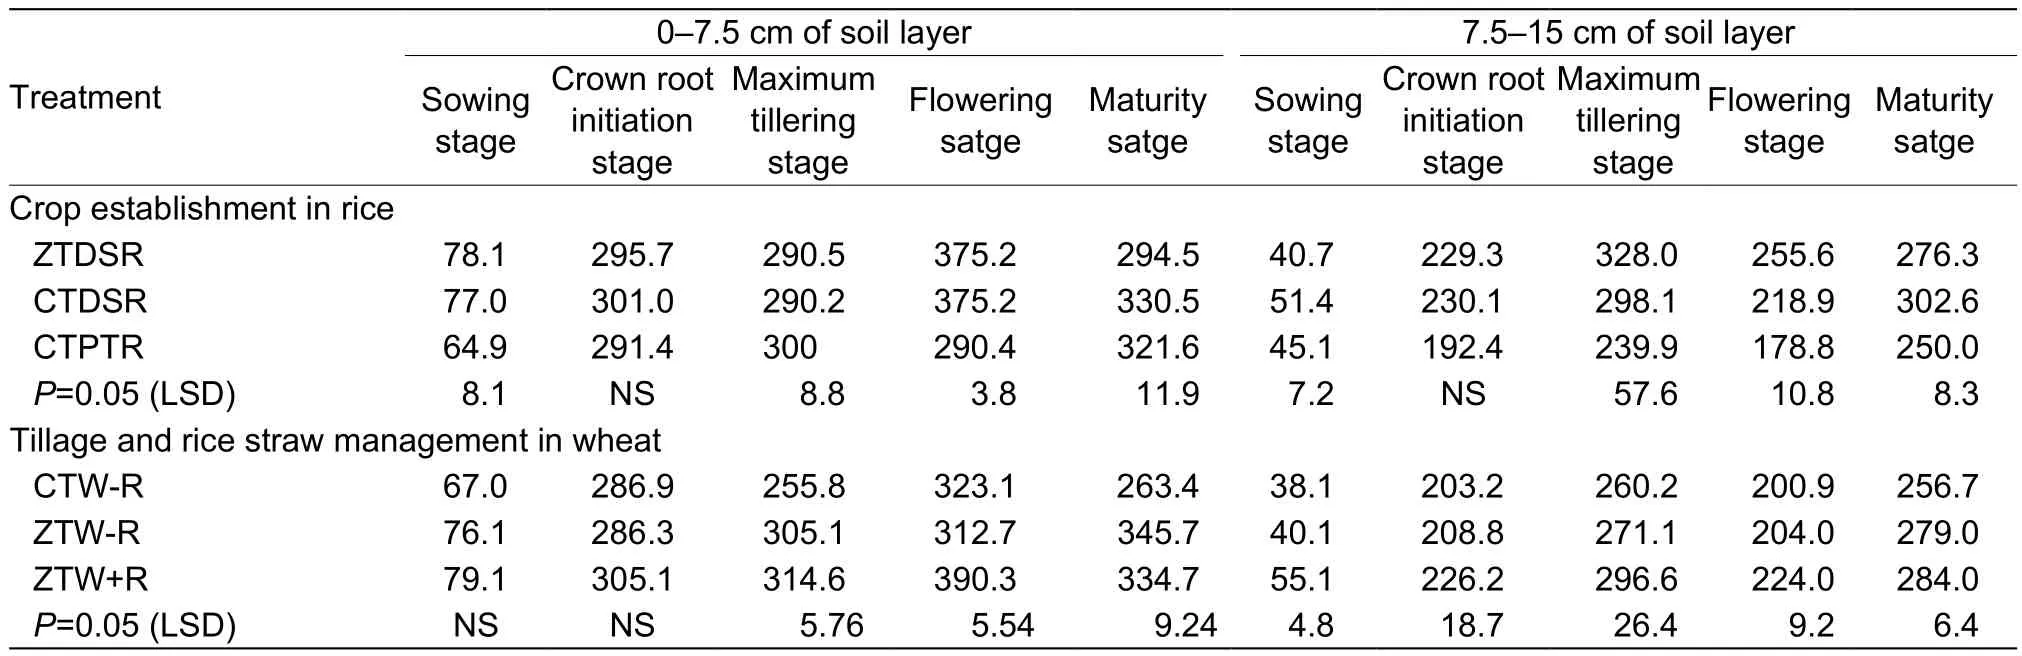
Table 5 Microbial quotient (Cmic:Corg) during different growth stages of wheat in different layers as influenced by tillage, rice straw management and rice establishment systems
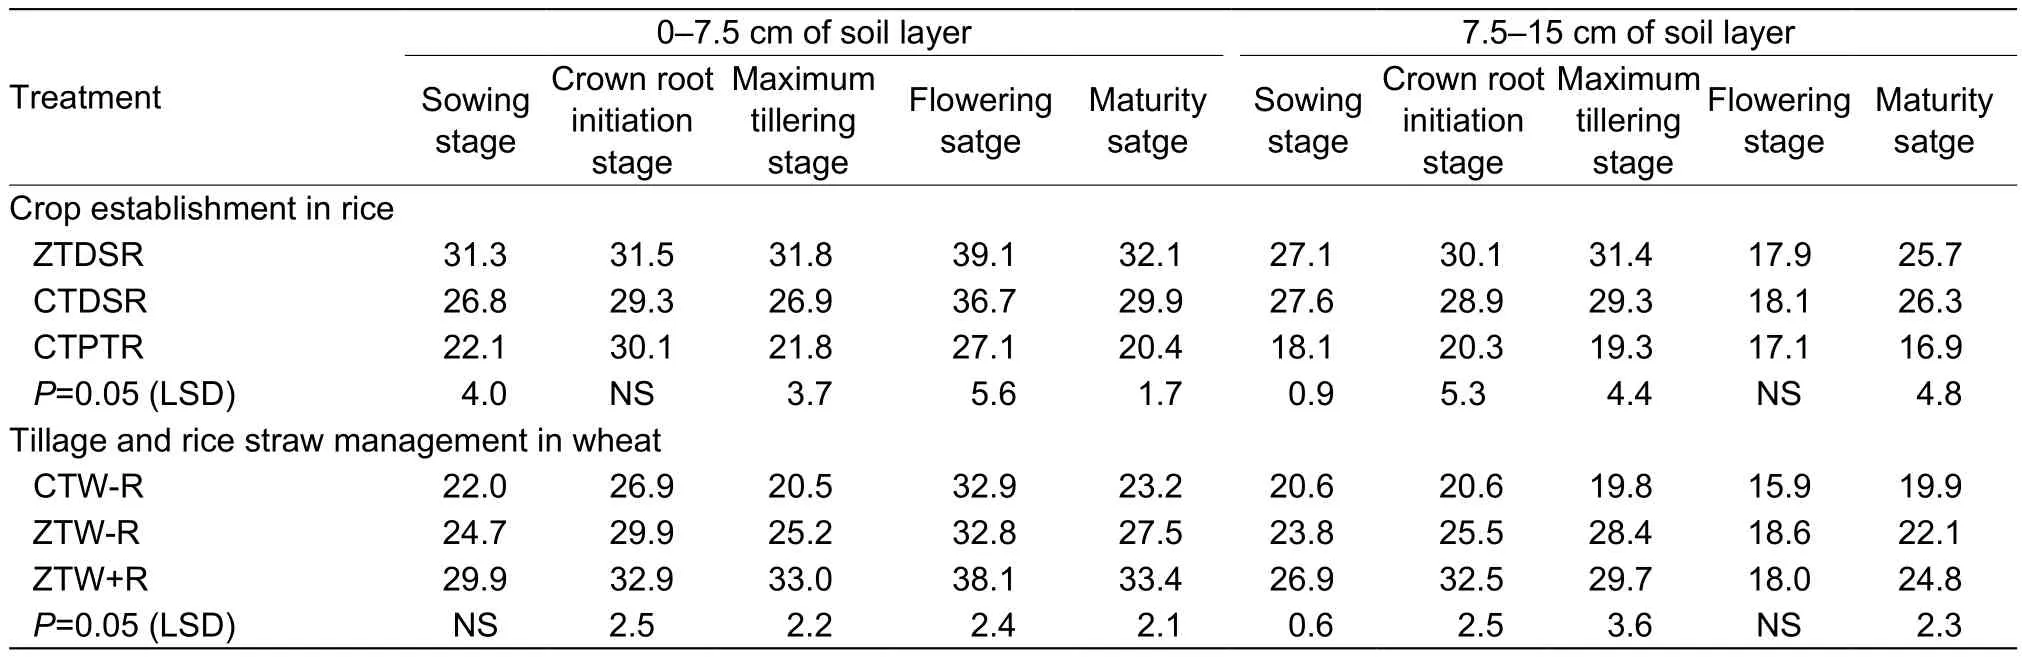
Table 6 Soil carbon mineralization quotient during different growth stages of wheat in different layers as influenced by tillage, rice straw management and rice establishment systems
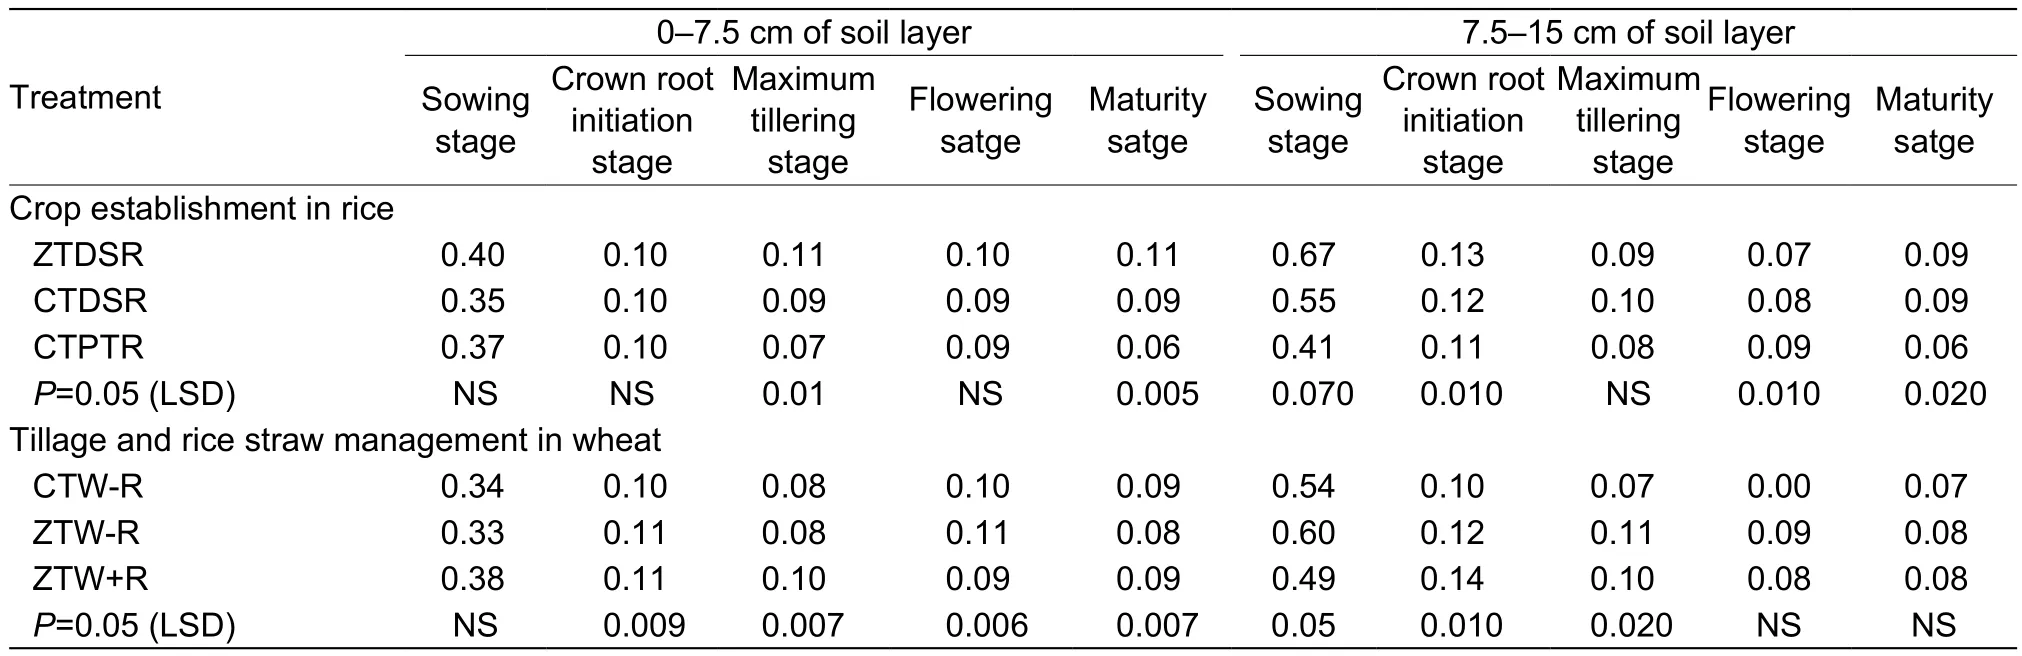
Table 7 Metabolic quotient during different growth stages of wheat in different layers as influenced by tillage, rice straw management and rice establishment systems
MBC is considered to be the most reliable and frequently used factor among the biochemical parameters (Gil-Sotreset al.2005; Haripal and Sahoo 2014) because it is related to the C and N cycles and microbial demand for these nutrients(Gregorichet al.2000). Basal soil respiration is considered as the reflection of the availability of slow flowing carbon for microbial maintenance, and thus can be used as a measure of basic turnover rate in soil (Insamet al.1991). Both MBC and BSR were significantly increased in ZTW+R compared to ZTW-R and CTW-R, because crop residues are retained on the soil surface and act as C substrate for soil microbes which might have increased soil microbial population and nutrient availability in the soil (Beraet al. 2017) (Tables 2 and 3). It has been widely accepted that ZT with crop residue retention enhance MBC in the upper soil layer due to accumulation of crop residues and root C inputs in the surface soils (Wanget al.2014; Guoet al. 2016). Moreover,reduced disturbance of soil under ZT prevents disruption in microbial population and soil aggregates (Gonza lez Chavezet al.2010). Consistent with the results from our study, Daset al.(2014) reported that MBC content in ZT plots was 17% higher than that under CT. Both MBC and BSR increased from crown root initiation to flowering stage and then declined significantly at maturity due to decreased availability of substrate C with time and poor root exudation of rhizospheric microbes at crop maturity (Liet al.2012).Spohn (2015) suggests that this reduction in respiration rates is not due to a lower microbial biomass concentration but instead to a reduced respiration rate per unit microbial biomass. Earlier study by Starket al.(2007) showed that addition of crop residues could quickly improve the activity of culturable microorganisms due to increased C in soil, and thereby improving the ecological environment of soil itself.
Crop residue incorporation is an essential component with key multifunctional roles in soil quality and is related to many physical and biological properties (MBC, microbial quotient, metabolic quotient and respiration quotient) of soil (Insam and Haselwandter 1989; Smithet al.2000;Bhaduriet al. 2017). In the present investigation, microbial and carbon utilization quotients were the highest under ZTW+R as compared with ZTW-R and CTW-R. The ZTW+R treatment demonstrated the maximum improvement in SOC status (Tables 5 and 6), which indicated larger substrate availability to the soil microorganisms and a positive trend for organic C accumulation and enhancing microbial carbon use efficiency (Caravaca and Roldan 2003; Yeet al. 2014).The respiration quotient has valuable application as a relative measure of how efficiently the soil microbial biomass utilize C resources and the degree of substrate limitation for soil microbes (Wardle and Ghani 1995); Dilly and Munch 1998). Our study showed that metabolic quotient under ZTW+R was lower compared with ZTW-R and CTW-R,respectively. Efficient microorganisms incorporate more of the substrate C as their biomass and accordingly emit less of C into atmosphere through respiration. As a result,efficient microbes have lower metabolic quotient under ZTW+R treatment. Our study thus agrees with the view that the stressed soil habitat exhibited high qCO2due to the decline in the efficiency of microorganisms.
Correlation analysis showed that MBC, microbial quotients and basal soil respiration had higher relationship with SOC at most of the growth stages in surface soil depth(Table 8). Moreover, MBC, microbial quotients and BSR were significantly correlated with other soil biochemical attributes except qCO2(P<0.05, Table 8). Other researchers suggested that the microbial quotients were directly related with SOC content (Douet al.2008; Moharanaet al.2012).
5. Conclusion
Our study showed that biochemical indicators were the highest at the maximum tillering and/or flowering stage which were significantly affected by tillage, crop establishment and rice straw management practices. On system basis,ZT-DSR followed by ZTW+R resulted in the highest MBC,basal soil respiration, soil organic carbon and microbial quotients. Present study revealed that soil quality indicators(microbial biomass carbon, basal soil respiration, microbialquotient) can be used to identify the most sustainable CA-based practices at flowering stage of wheat. Positively higher correlation coefficients of biomass carbon, basal soil respiration, soil organic carbon and microbial quotients with each other at flowering stage are valuable indicators of improved soil quality under conservation practices. This outcome from this study may further be extrapolated to the soils of similar or related agro-ecological regions.
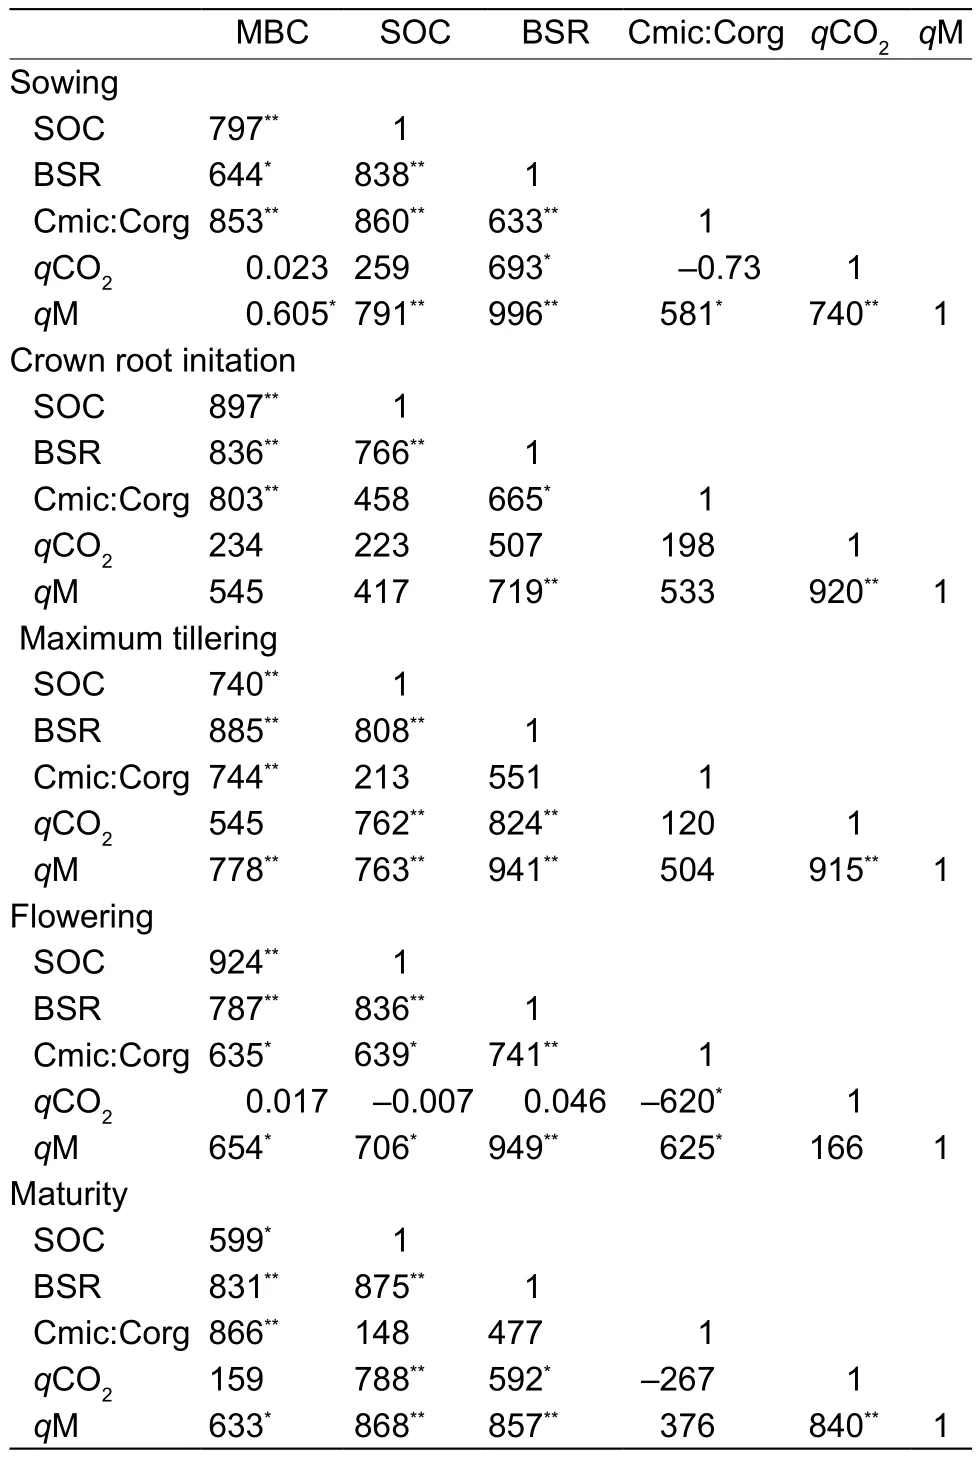
Table 8 Correlation coefficients of microbial indices in different wheat growth stages in surface soil layer1)
Acknowledgements
The land and infrastructure support of Punjab Agricultural University, Ludhiana for the field study and financial as well technical support of International Maize and Wheat Improvement Center (CIMMYT) through USAID and BMGF funded Cereal System Initiative for South Asia (CSISA)Project and Consultative Group of International Agriculture Research (CGIAR) Program on wheat (CRP 3.1) are gratefully acknowledged.
 Journal of Integrative Agriculture2018年8期
- Journal of Integrative Agriculture的其它文章
- Is the “One Province One Rate” premium policy reasonable for Chinese crop insurance? The case in Jilin Province
- What determines irrigation efficiency when farmers face extreme weather events? A field survey of the major wheat producing regions in China
- lmpacts of invasive Iris pseudacorus L. (yellow flag) establishing in an abandoned urban pond on native semi-wetland vegetation
- Accumulation and bioavailability of heavy metals in a soil-wheat/maize system with long-term sewage sludge amendments
- Effects of long-term green manure application on the content and structure of dissolved organic matter in red paddy soil
- iTRAQ-based quantitative proteomic analysis reveals key pathways responsible for scurs in sheep (Ovis aries)