Carbon biomass, production rates and export flux of copepods fecal pellets in the Changjiang (Yangtze) River estuary*
GUO Shujin (郭术津) , SUN Xiaoxia (孙晓霞) ,
1 Jiaozhou Bay Marine Ecosystem Research Station, Chinese Academy of Sciences, Qingdao 266071, China
2 Laboratory for Marine Ecology and Environmental Science, Qingdao National Laboratory for Marine Science and Technology,Qingdao 266071, China
3 University of Chinese Academy of Sciences, Beijing 100049, China
Abstract Copepod fecal pellets are ubiquitous throughout the oceans. Their production and export can represent a highly efficient pathway of carbon export. However, the role these fecal pellets play in carbon export in the Changjiang (Yangtze) River estuary is not well known. Two cruises were carried out in the Changjiang estuary in the spring and summer of 2013, during which time carbon biomass, production,and export of copepod fecal pellets were studied. Spring and summer fecal pellet carbon biomass ranged 0.30–1.01 mg C/m3 (mean=0.56±0.20 mg C/m3 ) and 0.31–1.18 mg C/m3 (mean=0.64±0.24 mg C/m3 ),respectively, signi ficantly lower than phytoplankton. At most stations, fecal pellet carbon biomass was higher in surface or subsurface layers than deeper layers. Production rates ranged 0.65–1.49 pellets/(ind.·h)(mean=1.02±0.27 pellets/(ind.·h)) in spring and 0.62–1.34 pellets/(ind.·h) (mean=0.98±0.22 pellets/(ind.·h))in summer, within the range reported in previous studies. Higher production rates of fecal pellets occurred at stations with higher chlorophyll a concentrations, and production rates of copepods of size 500–1 000 μm greater than copepods >1 000 μm during both cruises. The potential export flux of fecal pellets was slightly higher in summer (mean=68.95±14.37 mg C/(m2 ·d)) than spring (mean=52.08±11.33 mg C/(m2 ·d)) owing to higher summer copepod abundances. To our knowledge, this study is the first of its kind in the Changjiang estuary, and it con firms the signi ficant role of copepod fecal pellets in local carbon export.
Keyword: fecal pellets; copepods; production rates; carbon export; Changjiang (Yangtze) River estuary
1 INTRODUCTION
The study of organic carbon export is central to the understanding of oceanic biogeochemical cycles(Wexels Riser et al., 2001). While the flux of organic matter in the ocean is predominantly derived from primary production, much of the vertical flux can be mediated by zooplankton activity (Turner, 2015). Not only do zooplankton reduce the vertical flux of biogenic matter through grazing, but they repackage slowly sinking phytoplankton cells into fecal pellets(FP) (Turner, 2002). As the sinking velocity of these FP can be as fast as hundreds meters per day (Small et al., 1979; Deibel, 1990; Yoon et al., 2001; Turner,2002; Patonai et al., 2011)—much higher than reported for phytoplankton cells (Bienfang and Harrison, 1984)—their production and sedimentation can represent a highly efficient pathway of carbon export in the ocean (Gowing et al., 2001; González et al., 2004; Wexels Riser et al., 2008; Wilson et al.,2008). Several studies have indicated zooplankton FP contributes a substantial fraction of exported biogenic matter in coastal and off-shore regions (González et al., 1994, 2000; Riebesell et al., 1995; Carroll et al.,1998).
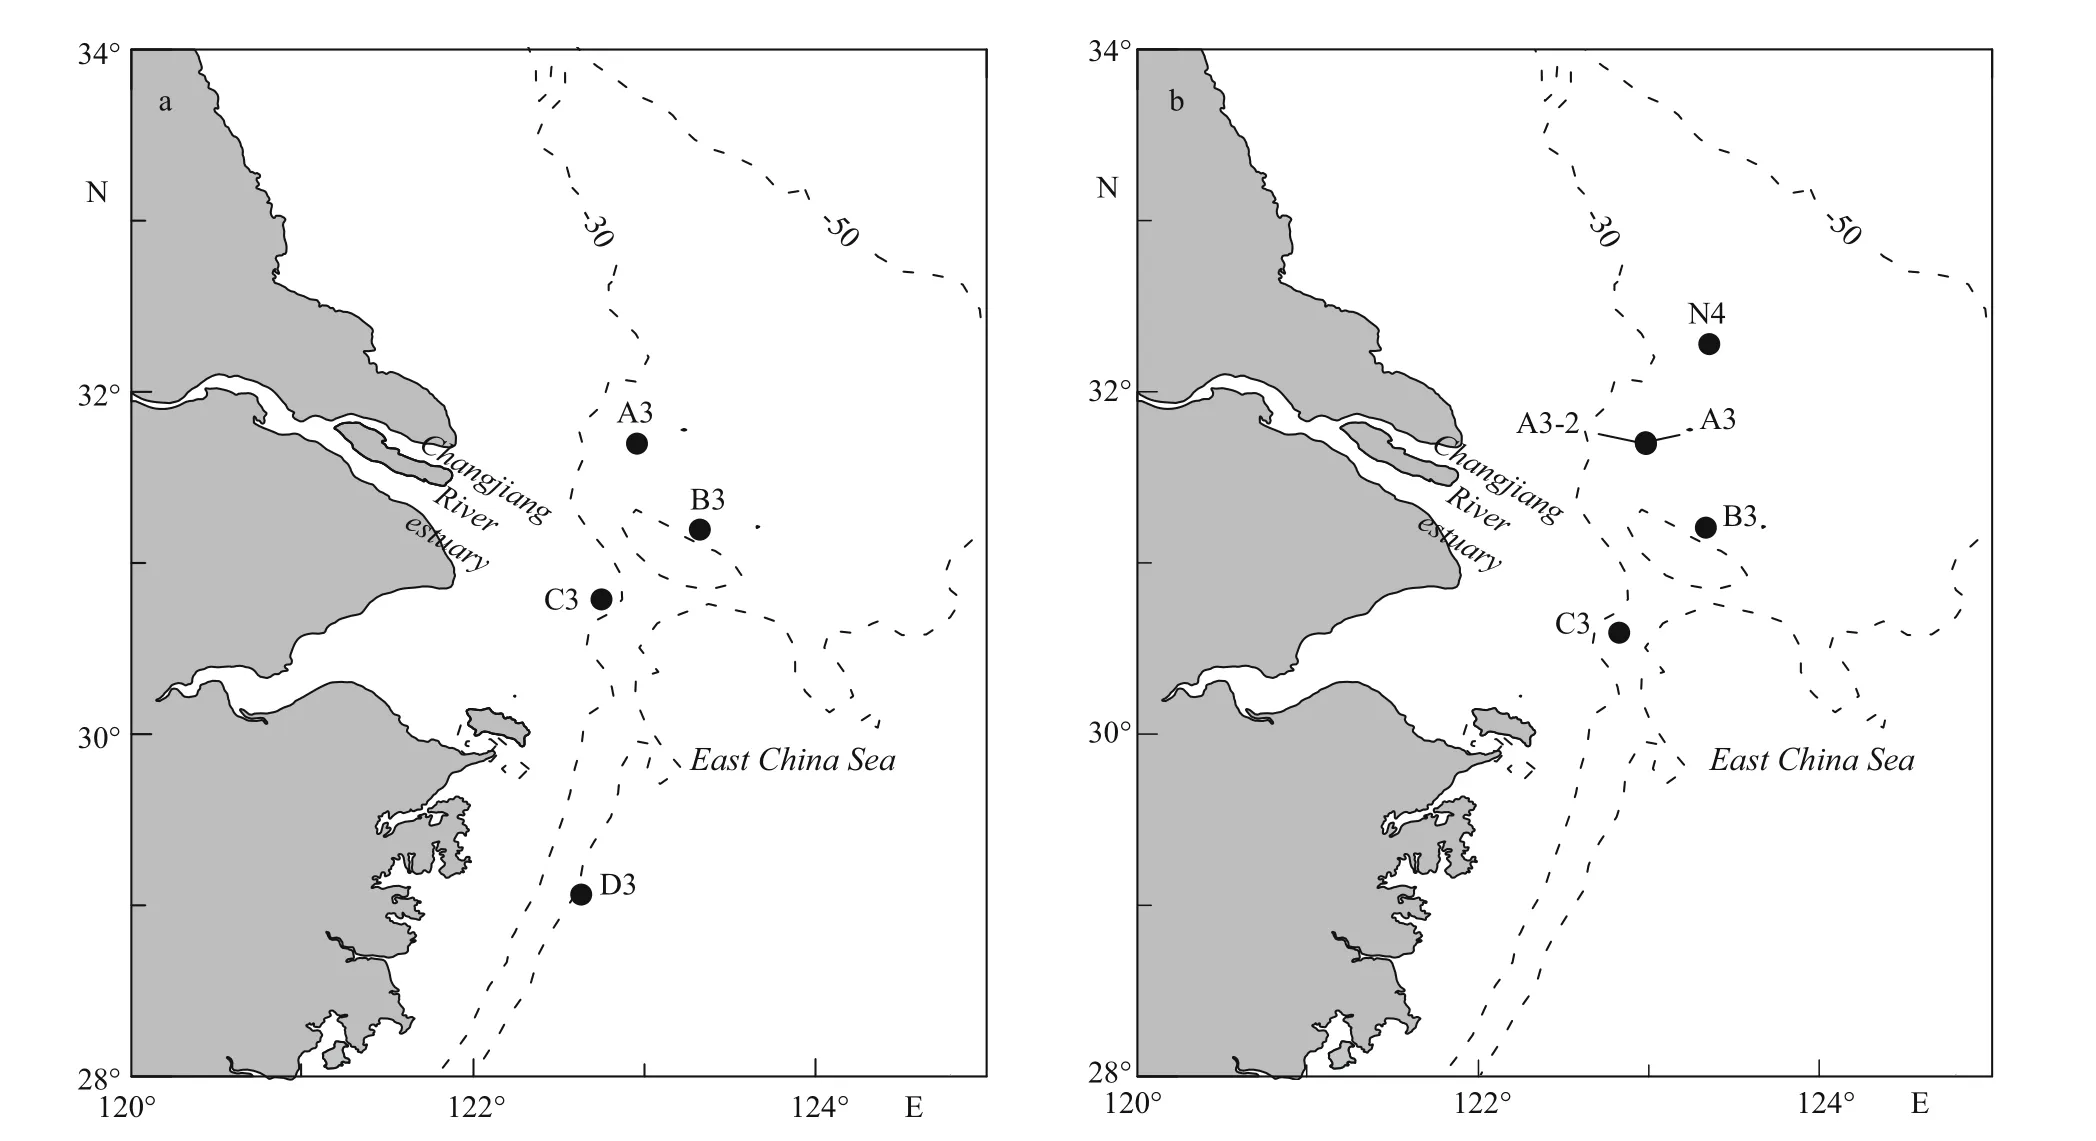
Fig.1 Changjiang River estuary sampling stations, spring (a) and summer (b), 2013
Copepods are ubiquitous in the world’s oceans,and can account for over 70% of total mesozooplankton abundance (Verity and Smetacek, 1996). Copepod FP play a signi ficant role in marine carbon cycles,with their export flux sometimes accounting for more than 90% of the total particulate organic carbon(POC) oceanic export flux (Urban-Rich et al., 1999;Viitasalo et al., 1999; Beaumont et al., 2001;Frangoulis et al., 2001; Wexels Riser et al., 2001;Hernández-León et al., 2002; Poulsen and Kiørboe,2006; Møller et al., 2011; Manno et al., 2015). Many interacting biological and physical factors affect the export of FP from the euphotic zone to deeper waters,such as FP production rates, carbon content and settling velocity, zooplankton abundance,zooplankton coprophagy, and microbial activity(Lampitt et al., 1990; Lane et al., 1994; Urban-Rich,1997; Urban-Rich et al., 1999; Belcher et al., 2016).Larger FP are thought to be exported quickly from the euphotic zone, while smaller FP are more likely to be recycled in upper layers owing to their reduced sinking velocity (Turner, 2015).
The Changjiang (Yangtze) estuary is one of the most productive coastal seas in the world (Ning et al.,2004). On an annual basis, this estuary is a net sink of atmospheric CO2(Zhai and Dai, 2009), which may relate to its shallow depth and potential for efficient export of POC from the surface to the sea floor. This estuary is also well known for its rich mesozooplankton abundance, dominated by copepods (Xu et al., 2003,2005; Chen and Liu, 2006). Accordingly, copepods might produce a major part of the local zooplankton FP. Despite this, carbon biomass, production rates and export flux of copepods FP in this area were unknown.
To understand the role of copepod FP in the carbon export in the Changjiang estuary, spring and summer surveys were undertaken in 2013. FP biomass was measured as carbon (FPC), with FP production experiments carried out aboard ship to measure their production rates. The effects of environmental parameters on FPC and production rates are discussed.Finally, we calculate a potential FP carbon export flux.To our knowledge, our study is the first of its kind in the Changjiang estuary, and provides valuable insights into the role of copepod FP in the local carbon cycle.
2 MATERIAL AND METHOD
2.1 Study area
Spring and summer surveys were undertaken in the Changjiang estuary in 2013. R/V Beidou was used to carry out the spring cruise, and R/V Dongfanghong 2 was used to carry out the summer cruise. The sampling equipment during both cruises was the same with each other. Sampling stations are depicted in Fig.1,with surface environmental parameters at these stations presented in Table 1.

Table 1 Temperature ( T), salinity ( S), chlorophyll a (Chl a) concentration and phytoplankton cell abundance in surface layers, and copepod abundance (vertical net tow) at sampling stations
2.2 Sampling and analysis
Water temperature and salinity were recorded with a Seabird CTD device (SBE 9/11 plus). Water samples were collected with a 12-L rosette sampler at 4 or 5 different depths at each station to determine Chl a concentration, and for characterization of the phytoplankton community.
Samples (250 mL) for Chl a analysis were filtered onto 25 mm GF/F filters (Whatman™), then stored in darkness at -20°C. Chl a was subsequently extracted in darkness using 90% acetone for 24 h at -20°C,before being measured with a Turner-Designs Trilogy™ laboratory fluorometer (Welschmeyer,1994).
Phytoplankton carbon was calculated from phytoplankton community data by geometric models(Sun and Liu, 2003). Samples for phytoplankton community analysis were preserved in 1% buffered formalin, then identi fied and enumerated with an inverted microscope (Olympus, Japan) at 200× or 400× using the Utermöhl method (Utermöhl, 1958).Phytoplankton cell volume was calculated from the linear dimensions with their geometric models (Sun and Liu, 2003), with linear dimensions measured by ocular micrometer. Phytoplankton cell carbon was converted from cell volume using the equation of Eppley et al. (1970). Total phytoplankton carbon at each depth was calculated by summing the products of cell numbers and the carbon content per cell of each species. Phytoplankton carbon flux was estimated as the production of phytoplankton sinking rates (using the SETCOL method (Bienfang, 1981))and phytoplankton carbon concentrations in the water; for a detailed description on the SETCOL experiment refer to Guo et al. (2016).
Suspended FP at each station was collected at the same depths as Chl a samples using a large capacity(80 L) hydrophore; samples were gently concentrated from 10 L with 20 μm sieves. Retained pellets were backwashed into a small container and preserved with glutaraldehyde (5% final concentration). Final sample volume was between 150 and 200 mL. Pellets were identi fied and enumerated with an inverted microscope(Olympus, Japan), again using the Utermöhl method.FP with a cylindrical geometrical shape and rounded ends were assumed to be copepod in origin (Bathmann et al., 1990; González et al., 1994). Total FP volume was calculated after counting and sizing (length and width) each intact and broken fecal pellet with an ocular micrometer according to their geometric model(Edler, 1979). Pellet length and width were recorded to the nearest 10 μm. A volumetric carbon conversion factor of 0.11 mg C/mm3(Carroll et al., 1998) was applied to calculate FPC. To determine the contribution of FP of different size to the total local FPC, FP collected at each station were divided into four groups according to lengths: 0–100 μm, 100–200 μm, 200–300 μm and >300 μm. The contribution of different size FP to total FPC at each station was calculated.
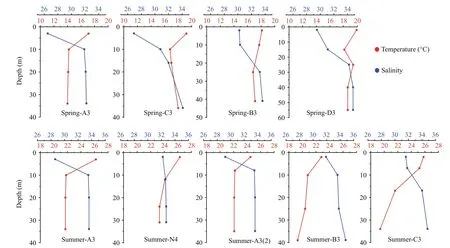
Fig.2 Vertical temperature and salinity pro files at spring and summer sampling stations
The procedure of FP production experiment was similar with that in other reports (Urban-Rich et al.,1999; WexelsRiser et al., 2002). Mesozooplankton were collected with vertical net tows (at low velocity)from the bottom (5 m above the sea floor) to the surface at each station, using a 50-cm diameter net(505 μm mesh) with closed cod end. Immediately after net retrieval, the cod end was gently emptied into 10 L of 200 μm prescreened surface water to dilute copepods. Copepods were then gently sizefractioned into two classes (500–1 000 μm,>1 000 μm) using sieves. For each size fraction, three experimental bottles (1 L) and one control bottle (1 L)were filled with 200 μm prescreened surface water. In each experimental bottle, 10–15 copepods were picked with a dissecting microscope and then put into a suspended insert with mesh on both ends, through which FP could pass, preventing coprophagy (Poulsen and Kiørboe, 2006). Experiments were performed in dim light in a running seawater incubator for 3 h. At the end of the incubation period, copepods were removed and the contents from the experimental and control bottles were sieved with a 20-μm mesh to collect FP. Both FP and copepods were preserved in 2% buffered formalin for subsequent counting. FP production rates were calculated after subtracting FP in control bottles from experimental bottles, and dividing the total number of pellets by the time of incubation. The linear dimensions of FP were also measured to calculate carbon biomass with the volumetric carbon conversion factor of Carroll et al.(1998); the carbon-speci fic FP production was calculated for each size-fraction of copepods by multiplying carbon-speci fic production rates and the corresponding abundance of copepods of each size group. Total FP production was the sum of the production of each size fraction at each station, which was treated as the ‘potential FP export flux’.
3 RESULT
3.1 Hydrographic conditions
Vertical temperature and salinity pro files are presented in Fig.2. During spring and summer, upper layers were characterized by warm, low salinity water, while deeper layers were colder and more saline. Spring surface temperature ranged 17.1–19.9°C, while summer surface temperature ranged 23.4–26.4°C; spring surface salinity ranged 26.1–29.8, while summer surface salinity ranged 28.0–31.8.During both seasons, surface Chl a concentrations were highest at station A3, where cell abundance exceeded 2.0×10⁴cells/L (Table 1). Spring phytoplankton carbon ranged 40.84–143.75 mg C/m3(mean=106.52±36.35 mg C/m3), and 23.84–578.15 mg C/m3(mean=267.55±182.32 mg C/m3) in summer.
3.2 Suspended fecal pellets
FPC concentration at each sampling depth is shown in Fig.3. Spring FPC concentration ranged 0.30–1.01 mg C/m3(mean=0.56±0.20 mg C/m3), and 0.31–1.18 mg C/m3(mean=0.64±0.24 mg C/m3) in summer.Generally, FPC concentration was below 1.0 mg C/m3at most stations, except for a spring 10 m layer at station B3 and a summer surface layer at station C3.High concentrations of FPC always appeared in surface or subsurface layers during both seasons, with the FPC concentration of the bottom layer always lower than upper layers at each station.
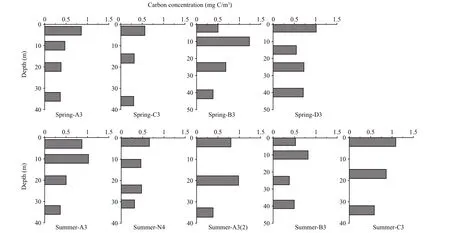
Fig.3 FPC concentration (mg C/m 3) during spring and summer sampling stations
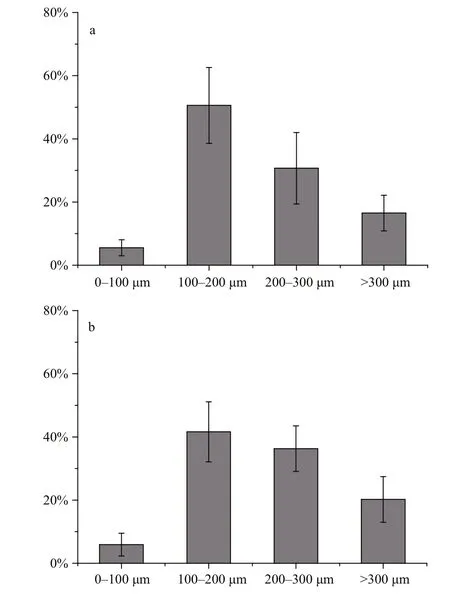
Fig.4 Local contribution of FPC of various size-fractions to total FPC during spring (a) and summer (b)
The contribution of each FP size-fraction to the total FPC concentration is presented in Fig.4. FP of the 100–200 μm group contributed most to FPC during both seasons, followed by FP of the 200–300 μm and >300 μm groups; the FP of the 0–100 μm group contributed least to FPC. Therefore, FP of larger size (>100 μm) dominated the local carbon biomass in the water.
3.3 Production rates of fecal pellets
Production rates of FP are shown in Fig.5. These ranged 0.65–1.49 pellets/(ind.·h) (mean=1.02±0.27 pellets/(ind.·h)) in spring and 0.62–1.34 pellets/(ind.·h) (mean=0.98±0.22 pellets/(ind.·h)) in summer.Spring FP production rates of both zooplankton size fractions were greatest at station A3 and least at station D3. During summer, FP production rates of the 500–1 000 μm size fraction were greatest at station A3 and least at station N4; those of the >1 000 μm size fraction were greatest at station A3(2) and least at station B3. During both spring and summer, FP production rates of copepods in the 500–1 000 μm size fraction were greater than those of copepods in the size fraction >1 000 μm (Fig.6).
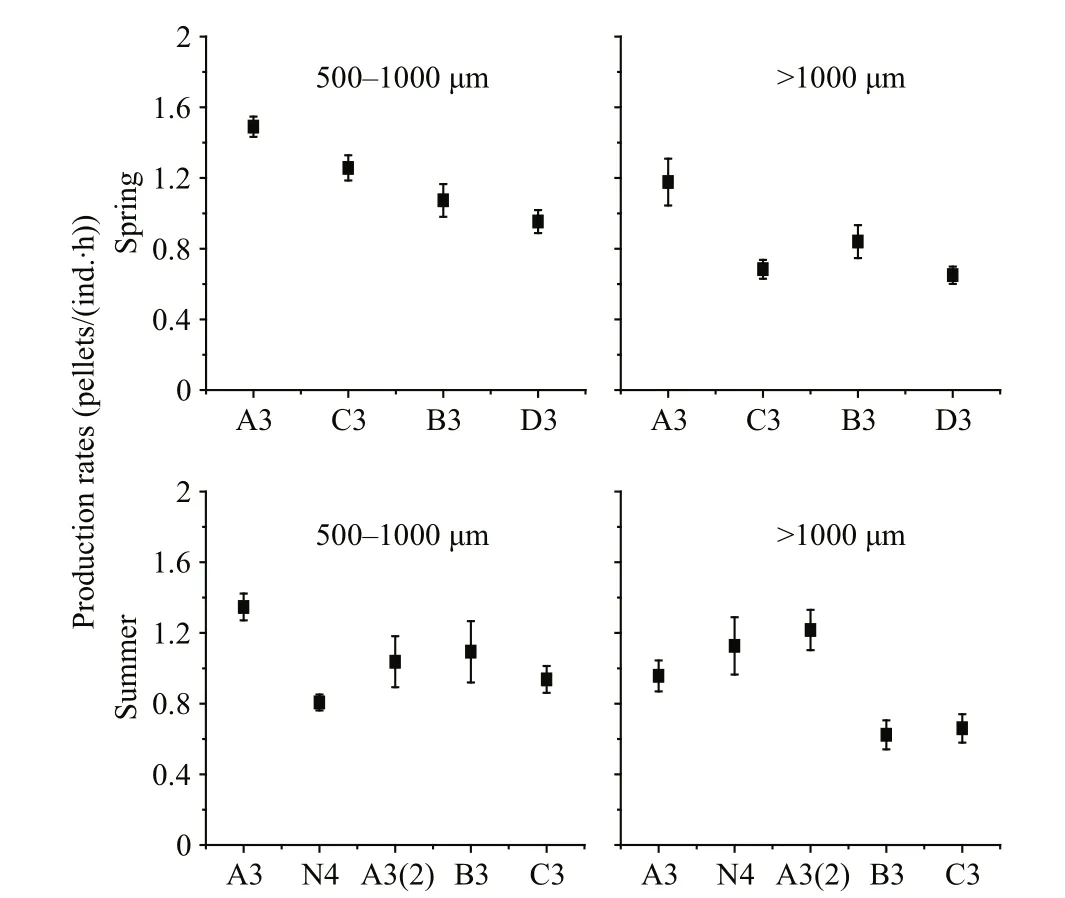
Fig.5 Spring and summer FP production rates at sampling stations
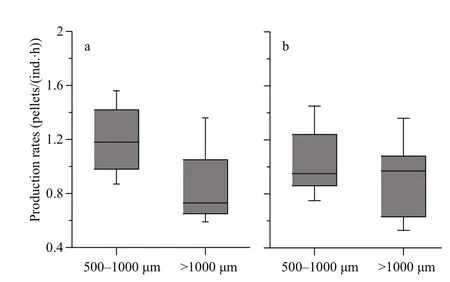
Fig.6 Comparison of production rates of FP between twosize-fractions of copepod in spring (a) and summer (b)
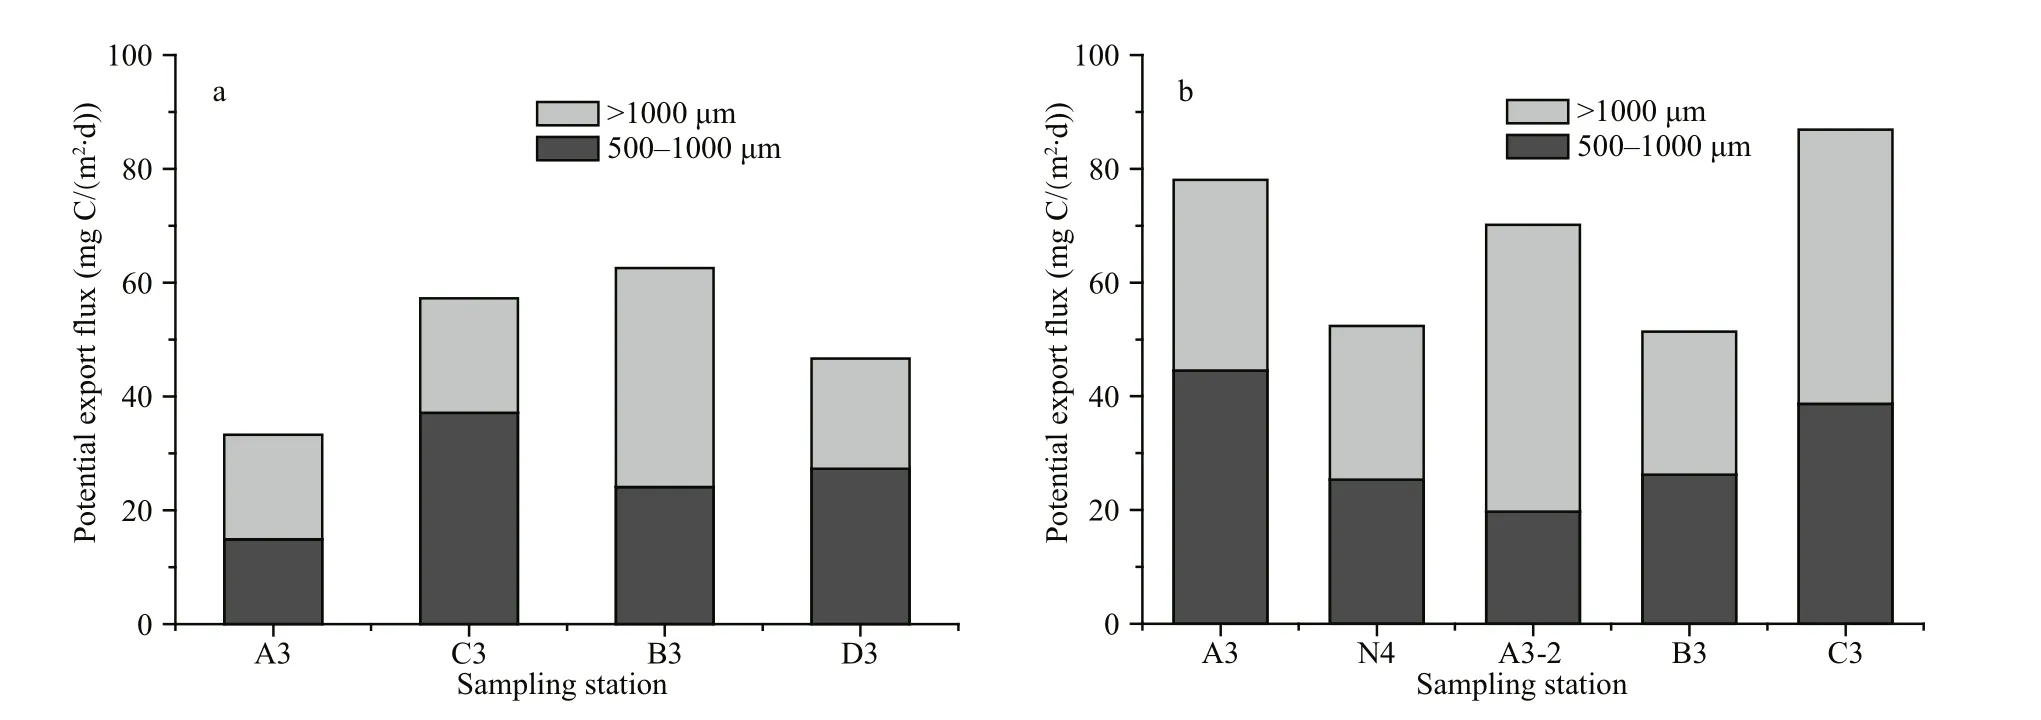
Fig.7 Potential FP export flux at spring (a) and summer (b) sampling stations
3.4 Potential export flux
Potential FP export flux at each station is shown in Fig.7. Estimated spring flux ranged 34.55–64.40 mg C/(m2·d) (mean=52.08±11.33 mg C/(m2·d)), and 51.82–88.97 mg C/(m2·d) (mean=68.95±14.37 mg C/(m2·d)) in summer. FP produced by 500–1 000 μm size-fraction copepods accounted for 49.44%±9.79%of the total potential export flux in spring and 45.05%±9.64% in summer; FP production of these two size-fractions of copepods were similar.
4 DISCUSSION
4.1 FPC concentration in the Changjiang River estuary
Interest in the study of marine pelagic FP has increased largely owing to the signi ficant role they play in POC export (Turner, 2015). Over 90% of suspended FP in the Norwegian Sea originated from copepods, with FPC concentration ranging 0–15 mg C/m3(Bathmann et al., 1987). Zooplankton FP on the shelf of the mid-Atlantic Bight was important in the downward vertical transport of phytoplankton carbon,with FPC ranging 0–2 mg C/m3(Lane et al., 1994).Medium- and large-sized pellets produced by mesozooplankton played an important role in FP sedimentation on and off the Iberian shelf, with FPC ranging 0–4.3 mg C/m3(Wexels Riser et al., 2001).We report FPC to be less than 1.5 mg C/m3in the Changjiang estuary (Fig.3), which lies within previously reported FPC ranges.
Spring phytoplankton cell carbon calculated from the geometric model was 106.52±36.35 mg C/m3; in summer it was 267.55±182.32 mg C/m3(unpublished data). Therefore, FPC concentration was much lower than that of phytoplankton cells during either cruise,further indicating FPC accounted for only a small part of the water column POC pool. Though numerous studies have reported the signi ficant contribution of oceanic FP to POC sedimentation (Turner, 2002,2015, and references therein), their contribution to the water column POC pool is not always signi ficant. In figures comparable to ours, zooplankton FPC comprised 0.3% of water column particulate carbon(Lane et al., 1994), and 0.1%–6.1% of total POC,about two orders of magnitude lower than phytoplankton carbon (Wassmann et al., 1999).Zooplankton FP sink rapidly once produced. With such a short retention time in the water column, their biomass can be low (Pasternak et al., 2000).

Table 2 Copepod FP production rates (pellets/(ind.·h)) in this and other studies
4.2 Relationship between environmental parameters and production rates of FP
Copepod FP production rate ranges 0.08–4.17 pellets/(ind.·h) (Urban-Rich, 1997), and 0.33–9.38 pellets/(ind.·h) (Mauchline, 1998). Our FP production rates fall within currently accepted ranges(Table 2). For each copepod size fraction, FP production rates varied among stations during both seasons (Fig.5). Temperature and food quantity might in fluence FP production rates (Urban-Rich et al.,1999), but as variation in temperature among stations was not signi ficant during either seasons (Table 1),any effect it had on FP production rates was likely to have been small. Chl a concentration and phytoplankton cell abundance varied greatly among stations (Table 1), which possibly contributed to variation in FP production rates. Generally, FP production rates increased as food concentration increased, and FP production rates were always higher in areas with higher phytoplankton biomass (Tsuda and Nemoto, 1990; Butler and Dam, 1994; Møller et al., 2011). Spring FP production rates at station A3 were obviously higher than at any other stations(Fig.5); Chl a concentrations were also highest (Table 1). Summer FP production rates of the 500–1 000 μm copepod size fraction were highest at station A3(Fig.5), as were Chl a concentrations (Table 1). These results are consistent with other studies: North Sea spring FP production rates were greater during diatom blooms than during non-bloom periods (Frangoulis et al., 2001; Poulsen and Kiørboe, 2006); Arctic Ocean FP production rates increased as phytoplankton biomass increased (Juul-Pedersen et al., 2006; Wexels Riser et al., 2007); southern Indian Ocean FP production rates correlated signi ficantly with Chl a concentrations (Møller et al., 2011). Therefore, it is likely that variation in phytoplankton biomass throughout the Changjiang estuary in fluenced FP production rates at different stations.
Our results reveal FP production rates of copepods 500–1 000 μm in size are greater than those of copepods >1 000 μm in size ( t-test, P <0.05) (Fig.6).This agrees with findings of previous studies, where copepod FP production rates correlated negatively with body size (Ayukai and Nishizawa, 1986; Morales et al., 1993). Accordingly, a community of smaller copepods will tend to produce more but smaller FP than one of larger copepods. However, owing to their smaller volume, small FP contribute less to total FPC than large FP (Fig.4). Additionally, as the sinking rates of small FP are always lower than those of larger FP (Patonai et al., 2011), small FP are more likely to be remineralized by degradation and recycling processes during sinking than larger FP (Wassmann,1998; Dagg et al., 2003). Although production rates of small FP are higher than larger FP, larger FP are more efficient at transporting POC to depth.
4.3 Potential export flux of FP in the Changjiang estuary
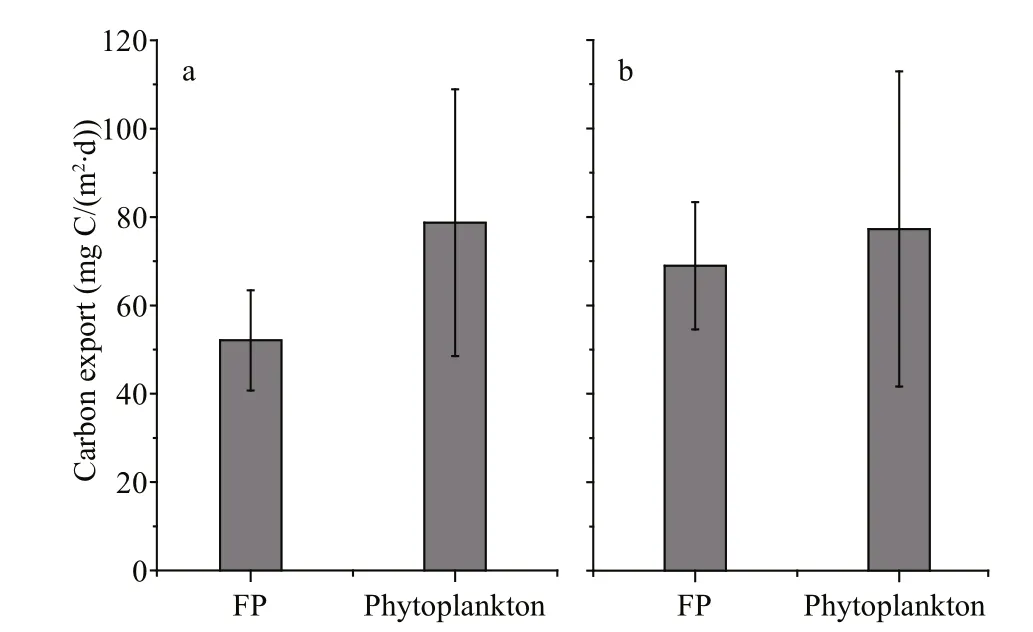
Fig.8 Comparison of spring (a) and summer (b) carbon export between copepod FP and phytoplankton cells in Changjiang estuary, 2013
During descent, FP can be lysed by bacteria or ingested by zooplankton in the water column (Turner,2002; Mayor et al., 2014; Belcher et al., 2016).Copepod coprophagy, coprochaly and coprorhexy can also cause most potential FP flux to be recycled within the euphotic zone (Bathmann et al., 1987;Lampitt et al., 1990; Martens and Krause, 1990;González et al., 1994; Iversen and Poulsen, 2007).These processes can break FP apart, slow down their sinking rates, and increase their retention time in upper water layers. Over sea floor depths of 1 000 m,retention of FP in upper layers could account for 30%–98% of total euphotic zone FP (Svensen et al.,2012). In the Changjiang estuary, where water depth is less than 60 m (Table 1), FP produced in the euphotic zone can reach bottom layers within hours,with sinking velocities of dozens to hundreds of meters per day (Patonai et al., 2011). Consequently any effect of bacterial lysis on FP is likely low given the short residence time of FP in the water column(Turner, 2002). This said, we did not measure the effect of zooplankton activity (coprophagy, coprochaly and coprorhexy) on sinking FP, so the degree to which these processes cause retention at our study sites are unknown. We assumed all FP produced were exported from upper layers, and treat total FP production as‘potential export flux’. Estimated potential export flux ranged 34.55–64.40 mg C/(m2·d) (mean=52.08±11.33 mg C/(m2·d)) in spring and 51.82–88.97 mg C/(m2·d) (mean=68.95±14.37 mg C/(m2·d))in summer. Therefore, the potential FP export flux in summer was slightly higher than spring, which was likely a consequence of higher zooplankton abundance(Table 1).
Compared to phytoplankton carbon export determined using the SETCOL method (Bienfang,1981) (unpublished data), the potential FP export flux was lower than that of phytoplankton cells during both seasons (Fig.8). As FP flux was overestimated when not including water column retention processes(coprophagy, coprochaly and coprorhexy), the export flux of FP in situ is likely to be even lower than that of phytoplankton cells. Despite this, levels of FP export flux were still comparable to those of phytoplankton cells (Fig.8). High sinking rates and low residence times in the water column ensure that copepod FP can play a signi ficant role in the export of carbon in the Changjiang estuary, and their contribution to total carbon export should not be ignored. Several other studies have also indicated FP comprises a substantial fraction of exported biogenic matter in coastal areas(González et al., 1994; Riebesell et al., 1995).
4.4 Methodological or technical shortcomings of this study
To our knowledge, this study represents the first of its kind for the Changjiang estuary. It highlights the potential importance of zooplankton FP to export flux in the region. However, we acknowledge some shortcomings. During laboratory identi fication, some small, broken or destroyed FP may not have been recognized, given difficulties differentiating them from detritus. This means we probably underestimate FPC concentration. The FPC was calculated with a fixed carbon:volume ratio, which may vary as a function of food supply, feeding mode and species(Wilson et al., 2008). Similar to other studies(WexelsRiser et al., 2002; Poulsen and Kiørboe, 2006;Møller et al., 2011; Gleiber et al., 2015), we studied only copepod FP. However, other zooplankton group such as euphausiids, pteropods and ostracods will also affect the amount and type of FP carbon available for export (Turner, 2015). Therefore, FP produced by zooplankton taxa other than copepods should be studied in the future.
5 CONCLUSION
Carbon biomass, production rates and potential export flux of copepod fecal pellets were studied in the Changjiang estuary during spring and summer of 2013. During both seasons, the carbon biomass of fecal pellets was much lower than that of phytoplankton cells, indicating fecal pellets accounted for only a small part of the local POC pool. During both seasons,production rates of fecal pellets were always greater at stations with higher Chl a concentrations, with production rates of copepods 500–1 000 μm size greater than larger copepods (>1 000 μm size). As the potential export flux of copepod fecal pellets was at levels comparable to phytoplankton cells during both seasons, these pellets likely have an important contribution to carbon export in the Changjiang estuary; their sedimentation should be considered in future studies of carbon cycling in this area. Finally,subsequent studies would bene fit from inclusion of fecal pellets of other zooplankton taxa (e.g.,euphausiids, pteropods, ostracods).
6 DATA AVAILABILITY STATEMENT
Data supporting these findings are available from the corresponding author upon reasonable request.
7 ACKNOWLEDGEMENT
We thank the crew and captain of the R/V Dongfanghong2 and R/V Beidou for logistical support during the cruise. Temperature and salinity data were provided by Professor HUANG Daji.
 Journal of Oceanology and Limnology2018年4期
- Journal of Oceanology and Limnology的其它文章
- Editorial Statement
- Recent insights into physiological responses to nutrients by the cylindrospermopsin producing cyanobacterium,Cylindrospermopsis raciborskii*
- Response of Microcystis aeruginosa FACHB-905 to different nutrient ratios and changes in phosphorus chemistry*
- In fluence of light availability on the speci fic density, size and sinking loss of Anabaena flos- aquae and Scenedesmus obliquus*
- Application of first order rate kinetics to explain changes in bloom toxicity—the importance of understanding cell toxin quotas*
- Regime shift in Lake Dianchi (China) during the last 50 years*
