Early onset of a microcystin-producing cyanobacterial bloom in an agriculturally-in fluenced Great Lakes tributary*
Robert Michael L. McKAY , Taylor TUTTLE Laura A. REITZ George S. BULLERJAHN William R. CODY , Adam J. McDOWELL , Timothy W. DAVIS
1 Department of Biological Sciences, Bowling Green State University, Bowling Green, OH 43403, USA
2 Aquatic Taxonomy Specialists, Malinta, OH 43535, USA
3 City of De fiance, Water Division, De fiance, OH 43512, USA
4 NOAA Great Lakes Environmental Research Laboratory, Ann Arbor, MI, USA
Abstract In late May 2016, a cyanobacterial harmful algal bloom (cHAB) was detected in the Maumee River, the largest tributary to Lake Erie, the southernmost lake of the Laurentian Great Lakes system.Testing on 31 May identi fied Planktothrix agardhii as the dominant cyanobacterium with cell abundance exceeding 1.7×10 9 cells/L and total microcystins (MC) reaching 19 μg/L MC-LR equivalents, a level over 10-fold higher than the 2015 revised U.S. Environmental Protection Agency (EPA) national health advisory levels for drinking water exposure to adults. Low river discharge coincident with negligible precipitation through the latter half of May coincided with an 80% decline in river turbidity that likely favored bloom formation by a low-light adapted P. agardhii population. Also contributing to the cHAB were high initial nutrient loads and an increase of the river temperature from 13°C to 26°C over this same period. The bloom persisted through 5 June with microcystins exceeding 22 μg/L MC-LR equivalents at the bloom peak. By 6 June, the river had returned to its muddy character following a rain event and sampling on 7 June detected only low levels of toxin (<0.6 μg/L) at public water systems located near the bloom origin. The elevated toxin production associated with this early onset bloom was without precedent for the Maumee River and an unique attribute of the cHAB was the high proportion of potentially-toxic genotypes. Whereas Planktothrix spp. is common in lotic environments, and has been previously detected in the Maumee, blooms are not commonly reported. This early onset, microcystin-producing cHAB provided a rare opportunity to glean insights into environmental factors that promote bloom development and dominance by Planktothrix in lotic environments.
Keyword: cyanobacteria; microcystin; Planktothrix; qPCR; river
1 INTRODUCTION
Blooms of noxious and toxin-producing cyanobacteria have recurred for several decades in western Lake Erie and its embayments (Michalak et al., 2013; Steffen et al., 2014; Bullerjahn et al., 2016).The occurrence of these blooms is consistent with the western basin’s shallow depth combined with elevated nutrient input from its watershed which is largely agricultural and dominated by row crop agriculture,mainly corn, soybeans and winter wheat (Muenich et al., 2016; Berardo et al., 2017). The Maumee River serves as the major tributary flowing into western Lake Erie draining over 1.5 million ha of the lake’s watershed and responsible for delivery of nearly 50%of the total phosphorus load into the basin (Scavia et al., 2014; Stow et al., 2015).
Whereas the cyanobacterial harmful algal blooms(cHABs) that recur annually in the open waters of western Lake Erie are dominated by colonial Microcystis spp. (Bullerjahn et al., 2016; Watson et al., 2016), filamentous Planktothrix spp. dominate the persistent seasonal bloom in Sandusky Bay (Davis et al., 2015) and the diazotrophs Dolichospermum spp.(formerly Anabaena) and Aphanizomenon spp. can be found throughout the western basin associated with declines in reactive nitrogen (Allinger and Reavie,2013; Chaffin et al., 2013; Harke et al., 2016; Watson et al., 2016).
In addition to transporting agriculturally-derived nutrients to western Lake Erie which in turn promote cHAB formation, the Maumee River has been investigated as a source of cyanobacteria that may seed the seasonal blooms. Temporal delays between the presence of Microcystis in the river and its later dominance in the lake have been taken in support of the river contributing cyanobacterial seed stock to lake blooms (Bridgeman et al., 2012; Conroy et al.,2014). Arguing against fluvial seeding of cHABs has been genetic evidence (Kutovaya et al., 2012; Chaffin et al., 2014) suggesting that Microcystis genotypes present in the river are generally non-toxic and that riverine Planktothrix are likely responsible for production of microcystins measured in the Maumee River (Kutovaya et al., 2012).
Regardless of its role in seeding Lake Erie’s seasonal cHABs, these studies serve to demonstrate that the Maumee River itself can support cyanobacterial growth which has potential public health implications. Over 60% of the residents of the state of Ohio obtain their drinking water from surface water sources (Ohio EPA Division of Drinking and Ground Waters, 1999). As the largest watershed of any Great Lakes river, the Maumee and its tributaries represent one of Ohio’s primary freshwater resources,providing potable water for 600 000 residents spanning 18 counties as well as providing recreational opportunities, industrial use and critical ecosystem services in this heavily agricultural area (Berardo et al., 2017). Recognizing the potential for cHABs associated with inland waters, the state of Ohio adopted monitoring criteria for public water systems that went into effect 1 June, 2016 (Chapter 3745-90-03 [Harmful Algal Blooms-Monitoring] of the Ohio Administrative Code). These rules mandate weekly monitoring for microcystins from May through the end of October with reduced monitoring effort from November through April.
The initiative paid immediate bene fits as residents of northwest Ohio were alerted to an early onset cHAB having elevated toxicity. In early June 2016,the De fiance County General Health District was noti fied by the Ohio Department of Health that a cHAB was detected on the Maumee River in the vicinity of the city of De fiance. The bloom, which was dominated by Planktothrix agardhii, had been developing since early May. State-mandated testing on 2 June reported total microcystins at 19 μg/L, a level over 10-fold higher than the revised U.S. EPA national health advisory levels for drinking water exposure to adults and surpassing Ohio’s new Recreational Public Health Advisory threshold of 6 μg/L for microcystins.
The impaired light climate associated with the water column of many flowing rivers is not conducive to rapid phytoplankton growth. Rivers, especially those draining agricultural catchments, are often characterized by high sediment loads with resulting high turbidity and light attenuation. However, when flow declines, often coincident with drought or the presence of engineered features such as weirs or dams, rivers can function more like lacustrine environments having increased transparency and residence time. Rivers may therefore be primed to support phytoplankton blooms during periods of low discharge (Webster et al., 2000; Atkins et al., 2001;Maier et al., 2001; Xia et al., 2010).
Whereas Planktothrix is common in lotic environments, and has been previously detected in the Maumee (Kutovaya et al., 2012), blooms are not well documented. Further, the elevated microcystins produced by this early onset bloom were without precedent. Whereas bloom biomass of Microcystis spp. has been reported for upstream main-stem Maumee River samples as early as March (Conroy et al., 2014), microcystins were not measured, nor expected given previous genetic characterization of Maumee River cyanobacteria (Kutovaya et al., 2012).Owing to their instability related to flow, rivers are conventionally regarded as sources of nutrients to fuel algal blooms rather than directly serving as bioreactors for blooms. This study was undertaken to test the hypothesis that reduced river discharge created an environment conducive to an early onset cHAB in the Maumee River.
2 MATERIAL AND METHOD
2.1 Study sites
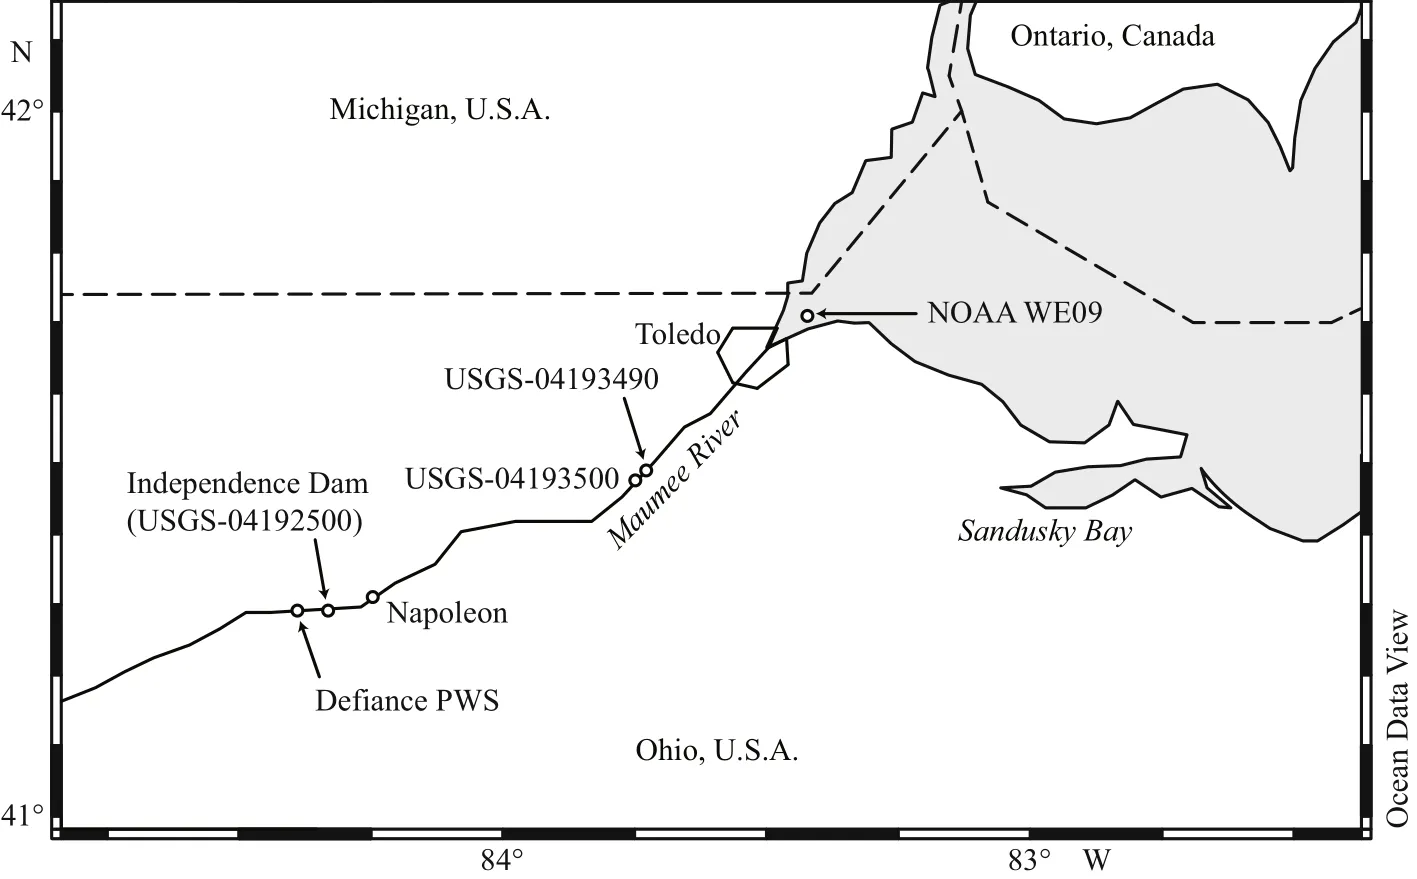
Fig.1 Sampling locations in the western Lake Erie watershed cited in this study
The Maumee River runs 220 km draining 1.68×10⁶ha of predominantly agricultural watershed across three Midwestern U.S. states en route to Lake Erie’s western basin. Apart from synoptic sampling described below, data came from Ohio public water systems at De fiance (river km 103) and Napoleon(river km 76) (Fig.1). The City of De fiance Water Treatment Plant pumps water from the Maumee River to a reservoir which serves as the immediate water source for the municipality. Physico-chemical data are collected daily from river water when actively pumping to the reservoir. When not drawing from the river (i.e. high nitrate, ammonium or concerns over other contaminants such as cHAB toxins), occasional surface samples of river water are collected adjacent to the water treatment plant. The City of Napoleon Water Treatment Plant treats water pumped directly from the Maumee River. Like De fiance, the Napoleon public water system also pumps river water to a reservoir from which it can draw in the event of contaminants present in the river.
Additional data were acquired from U.S. Geological Survey (USGS) gauging station 04192500(41°17′31″N, 84°16′52″W) located 12 m upstream of Independence Dam (river km 96). The station provides a record of river discharge and gauge height with historical data extending to 1925 (https://waterdata.usgs.gov/nwis). This site also serves as a sampling location for determination of water chemistry with data contributed to the joint USGS/USEPA Water Quality Portal (https://www.waterqualitydata.us/). Discrete water samples were collected by USGS personnel in accordance with protocols outlined in the USGS National Field Manual for the Collection of Water Quality Data (U.S.Geological Survey, 2015) with sample analysis following at the USGS National Water Quality Laboratory (NWQL, Denver, CO, USA). Nitrate +nitrite was measured by colorimetric determination of nitrite following enzymatic reduction of nitrate(Patton and Kryskalla, 2011) whereas measurement of dissolved orthophosphate followed Murphy and Riley (1962).
Data downstream were collected at the City of Bowling Green water intake (river km 37) near Waterville as part of the USGS Michigan-Ohio Water Science Center water quality monitoring network(USGS 04193490 Maumee River near Waterville OH; 41°28′34″N, 83°44′20″W). Physico-chemical data collected in near-real-time by a multi-parameter sonde followed methods described by Wagner et al.(2006). Daily nutrient data (nitrate + nitrite and soluble reactive phosphorus; SRP) for this same location were provided by the Heidelberg Tributary Loading Program maintained by the National Center for Water Quality Research (NCWQR) at Heidelberg University (Richards et al., 2010). This site is located 3.2 km upstream of USGS gauging station 04193500(41°30′00″N, 83°42′46″W) from which discharge data were obtained.
Samples from the mouth of the Maumee River (site WE09) were obtained by the National Oceanic and Atmospheric Administration Great Lakes Environmental Research Laboratory (NOAAGLERL) as part of weekly surveys of western Lake Erie ( Bertani et al., 2017).
2.2 Sampling and analytical procedures
During the cHAB, sampling of the Maumee River was conducted from the end of boat docks extending 10 m from shore at Napoleon, OH (41°22′55″N,84°08′21″W) over a 3-day period (4–6 June). Prior to sample collection, physico-chemical parameters (pH,conductivity, temperature, dissolved oxygen) were measured using a YSI 600QS Sonde (YSI Inc.,Yellow Springs, OH, USA). Samples were collected from near surface (~0.2 m), transported to the laboratory in an insulated cooler and processed within 5 h of collection for determination of total chlorophyll (chl) a biomass (>0.2 μm polycarbonate filters; Whatman Nucleopore, GE Healthcare Bio-Sciences, Pittsburgh, PA, USA) and for dissolved-(<0.2 μm) and particulate nutrients. Chl a biomass was measured by fluorometry (TD-700, Turner Designs, San Jose, CA, USA) following extraction in 90% (v/v) acetone at -20°C ( Welschmeyer, 1994).Total and dissolved (<0.2 μm) nutrient concentrations were determined following analysis of samples by the NCWQR at Heidelberg University (Tiffin, OH,USA).
Subsamples were also collected for the quanti fication of microcystins following the Ohio EPA Division of Environmental Services (2015) total(extracellular and intracellular) microcystins (reported as microcystin-LR equivalents)—ADDA protocol using enzyme-linked immunosorbent assay(Microcystins/Nodularins [ADDA] ELISA kit,Abraxis, Inc., Warminster, PA, USA). Additional subsamples were retained for phytoplankton identi fication and enumeration by microscopy. These samples were concentrated by gravity following which plankton were enumerated and measured to calculate algal biovolume.
For high-throughput microbial community analysis, >150 mL of seston at each sampling time was concentrated in duplicate onto 0.22 μm Sterivex cartridge filters (EMD Millipore, Billerica, MA,USA) which were stored at -80°C. DNA was extracted from the cartridges using the PowerWater DNA kit(MO BIO Laboratories, Inc, Carlsbad, CA, USA)following the manufacturer’s instructions.
2.3 Microscopy
Whole water samples from the De fiance public water system were analyzed by counting phytoplankton in a measured aliquot using a modi fied inverted microscope for the Utermöhl method plus a small magni fication modi fication of the strati fied counting technique of Munawar and Munawar (1976).A measured aliquot of mixed sample preserved with Lugol’s solution was placed into an inverted microscope counting chamber and allowed to settle a minimum of 4 h per centimeter of overlying water depth. Larger and recognizable rare cells were counted at 400× along a minimum of one transect across the entire counting chamber. Smaller algae were counted at 1 000× along a measured transect until a minimum of 300 cells were enumerated.Phytoplankton were counted as individual cells.Cyanobacterial taxonomy reported here conforms to Anagnostidis and Komárek (1985, 1988).
Biovolume of filamentous cyanobacteria collected at Napoleon, OH during the bloom peak was determined using the geometric formula for a cylinder and the measured dimensions of 30 randomly selected filaments from each sample.
2.4 Photosynthetic measurements
Photosynthetic rates were measured by tracing the acid-stable uptake of radiolabeled14C by photoautotrophs from NaH14CO3. Samples collected were transported to the BGSU lab in darkness and assays commenced within 4 h of sample collection.NaH14CO3([60 μCi; speci fic activity: 58 mCi/mmol]MP Biomedicals, Solon, OH, USA) was added to dark-adapted samples and the cell suspension was distributed as 1 mL aliquots into 7 mL glass scintillation vials that were incubated simultaneously under 24 different light intensities for 2.5 h at 23±2°C using a temperature-controlled photosynthetron(CHPT Mfg. Inc., Georgetown, DE, USA) as described previously (McKay et al., 1997).Photosynthetic rates, normalized to chl a biomass,were calculated using a mean ambient Maumee River HCO3ˉ value (3.6 mmol/L=43 mg C/L) extracted from archived water quality reports (1965–1973) for USGS gauging station 04192500 located near the bloom origin. Bicarbonate was used as a proxy for dissolved inorganic carbon (DIC) given that it contributed>95% of total DIC at the average pH (7.9; De fiance public water system) of the river from 20–30 May leading up to the bloom. Calculated rates were used to construct photosynthesis-irradiance curves using a non-linear regression curve fitting function (SigmaPlot 12.5, Systat Software, San Jose, CA, USA) based on the equation of Platt et al. (1980). The model returned three parameters: Pmax, the maximum photosynthetic rate at light saturation (g C/g Chl a/h), α, the slope of the curve at low irradiances ([g C/g Chl a/h]/[μmol quanta/(m2·s)]), and β, the slope of the curve associated with photoinhibition at high irradiance.From these parameters, we could calculate Ek(μmol quanta/(m2·s)) to estimate the irradiance at which photosynthesis becomes light saturated.
2.5 Quantitative polymerase chain reaction (qPCR)
Analysis of samples for total and potential toxinproducing Planktothrix gene copies followed the protocol of Briand et al. (2008a) but run as a singleplex assay rather than a multiplex assay. Brie fly,ampli fication was conducted in 96-well plates on a 7500 Fast Real-Time PCR system (Applied Biosystems, Waltham, MA, USA) in a total volume of 20 μL. Each sample was run in duplicate. Individual reactions contained 5 μ L of DNA template, 10 μL of 2× TaqMan®Environmental Master Mix 2.0 (Applied Biosystems), 0.6 μ L of both forward and reverse primers (10 μmol/L, Integrated DNA Technologies,Coralville, IA, USA), 0.4 μ L of either the total or potentially toxic Planktothrix TaqMan®probe(10 μmol/L, Applied Biosystems), and 3.4 μ L of PCR-grade water. Cycling conditions for both the toxic and total Planktothrix consisted of an initial heating step at 95° C for 15 min, followed by 55 cycles of 15 s at 95° C, 30 s at 60° C and 30 s at 72° C. Negative controls,consisting of PCR-grade water in place of DNA template, were run with each plate. A standard curve ranging from 1×10⁸to 1×10²was developed using a gBlocks®Gene Fragment (10 ng/μL; Integrated DNA Technologies) that consisted of the 131 and 140 bp amplicons for the targeted cpcA and mcyA gene regions, respectively, with a spacer of 10 T bases between them. In order to determine the number of gene copies, the following equation was used:
Gene copies/μL=(10 ng/μL×Avogadro’s number(6.022×10²³)÷(656.9×10⁹×gBlocks fragment length).
Once determined, the solution was diluted to a final concentration of 2×10⁷copies/μL, which when 5 μL was added to the qPCR reaction resulted in a final, in well concentration of 1×10⁸gene copies. A 1:10 serial dilution was used to construct the rest of the curve.Using this method, standard curves were linear over seven orders of magnitude (108–102) with an average efficiency of 101±5 ( R2=0.995±0.01). Gene copies in each reaction were calculated using the Applied Biosystems software and back-calculated to copies/mL.
2.6 High-throughput microbial community analysis
DNA was sent to the Genomic Services Lab at Hudson Alpha Institute for Biotechnology (Huntsville,AL, USA) where metagenomics libraries were prepared using the primer pair S-D-Bact-0341-b-S-17 and S-D-Bact-0785-a-A-21 (Klindworth et al., 2013)to amplify the V3-V4 region of bacterial 16S rDNA.Sequencing of the library followed on the Illumina MiSeq platform (San Diego, CA, USA) following the Illumina 16S metagenomics sequencing protocol(Illumina, 2014) to generate 300 bp paired-end reads.Bioinformatics analysis was performed using the 16S Metagenomics app (v 1.0.1.0) in the Illumina BaseSpace platform using an algorithm based on the Ribosomal Database Project Classi fier described in Wang et al., (2007). Taxonomic classi fication of 16S rRNA amplicon reads used the Illumina-curated 2013 release of the Greengenes reference taxonomy(DeSantis et al., 2006).
3 RESULT
Maumee River discharge measured near the bloom origin (Fig.2a) and at a site 66 km downstream(Fig.3a) slowed during the latter half of May to rates 37% and 48% respectively, on average below the 85 year historical median. Lower discharge was consistent with negligible rainfall measured during this period which in turn led to a precipitous decline in river turbidity (Fig.2a). Over the same period, a water quality sonde deployed by the USGS Michigan-Ohio Water Science Center at the downstream site reported rapid warming of river surface waters with temperatures increasing from 13°C to 26°C (Fig.3a).Both locations experienced similar nutrient dynamics(Figs.2b, 3b) with depletion of dissolved nitrate and phosphate (Fig.2b) tracking accumulation of Planktothrix agardhii (Fig.2c) near the bloom origin and a phycocyanin pigment peak diagnostic of cyanobacteria coincident with nutrient depletion downstream (Fig.3b). Independent measures of nitrate, acquired from the De fiance public water system and the USGS gauging station located 7 km downstream changed by -0.75 fold coincident with the rise in P. agardhii abundance. Phosphate depletion likewise tracked bloom formation (Figs.2b, 3b). At both locations, concentrations of nutrients increased to near pre-bloom levels following a rain event in early June (Figs.2b, 3b).
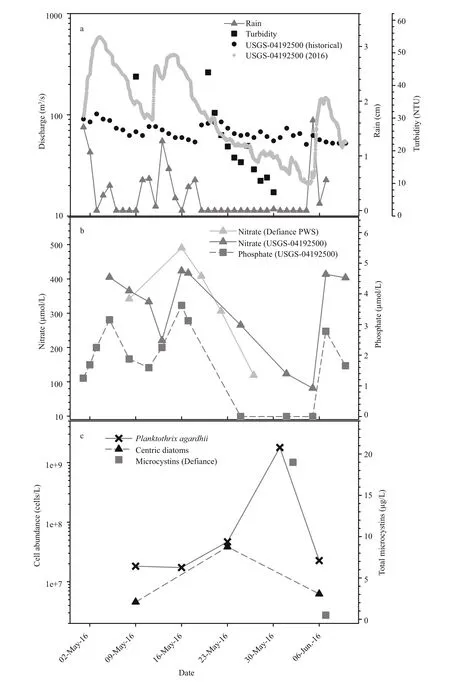
Fig.2 Physico-chemical parameters of Maumee River near De fiance, OH
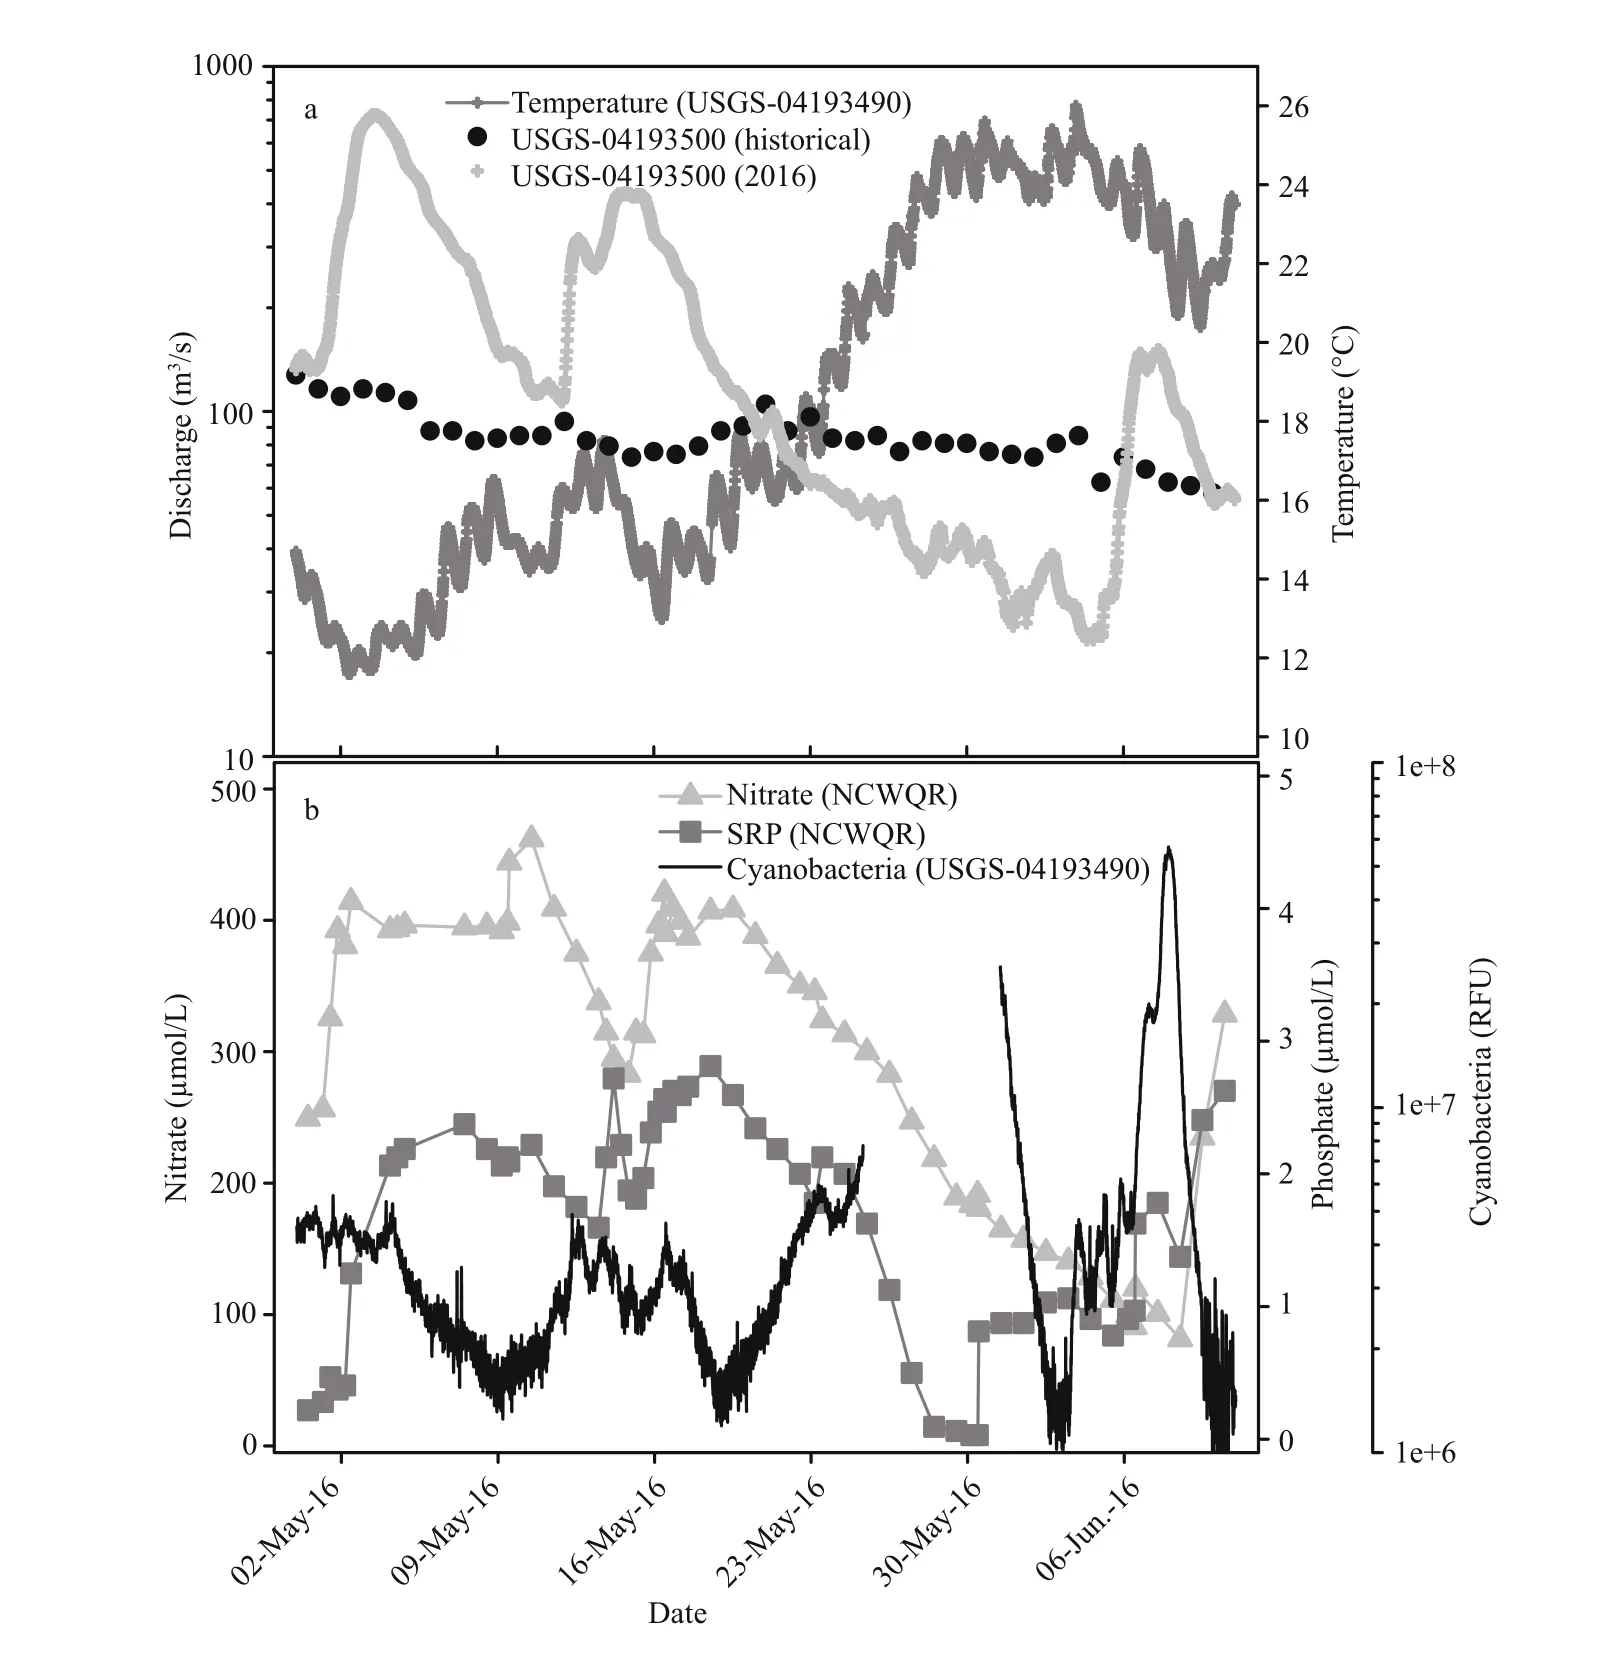
Fig.3 Maumee River discharge at USGS gauging station 04193500 downstream of the bloom origin
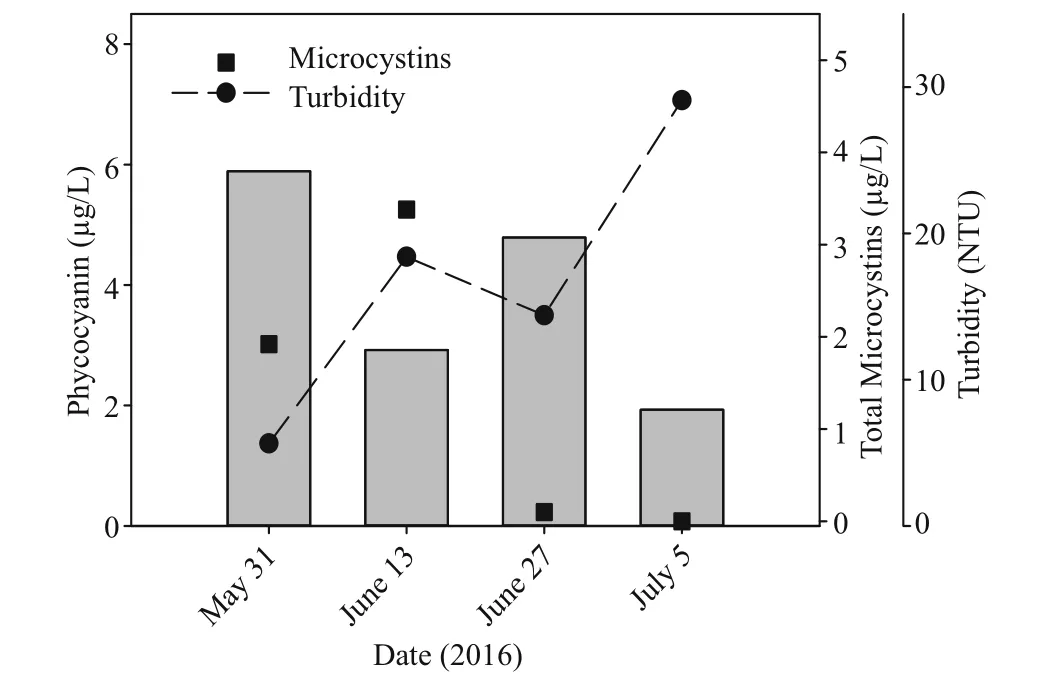
Fig.4 Cyanobacterial abundance assessed through phycocyanin pigment proxy measured at the mouth of the Maumee River through early July 2016
Whereas P. agardhii cell abundance was numerically dominant in the Maumee River bloom, a centric diatom accumulated in step with the cyanophyte until 23 May following which its abundance declined and the abundance of P. agardhii continued to increase,surpassing 1.7×10⁹cells/L by the end of May (Fig.2c).Coincident with the peak in P. agardhii biomass near the bloom origin were elevated total microcystins which exceeded 22 μg/L by 5 June (Fig.2c). As the bloom collapsed in the days following, so did microcystins which declined to 5 μg/L on 6 June and non-detectable one day later (Fig.2c).
Remnants of the cHAB were evident downstream at the mouth of the Maumee River over 100 km from the bloom origin (Fig.4). Seasonal monitoring ofwestern Lake Erie by NOAA-GLERL began on 31 May with elevated total microcystins persisting at site WE09 located at the mouth of the Maumee through at least 13 June, after which microcystins were not detectable again until mid-July. Coincident with elevated microcystins were high values of extracted phycocyanin (Fig.4). In fact, higher readings of phycocyanin were not recorded again at this site until August when cHABs are commonly reported in western Lake Erie. As observed for the river where the cHAB originated, the river plume entering Lake Erie showed reduced turbidity during the late May sampling by NOAA-GLERL following which turbidity increased >4-fold through early July (Fig.4).

Table 1 Physico-chemical data from Maumee River at Napoleon, OH (4–6 June, 2016)
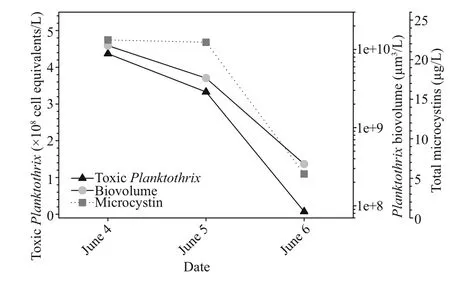
Fig.5 Abundance of potential microcystin-producing Planktothrix estimated by qPCR tracked total Planktothrix biovolume and total microcystins over the peak of the bloom at Napoleon, OH
The cHAB was sampled daily over a 3-day span in early June at Napoleon, OH, located 27 km downriver of De fiance where the bloom was initially reported.Surface water temperature was elevated at this location (23–24°C) similar to the downstream USGS Michigan-Ohio Water Science Center monitoring site and both nitrate and phosphate were depleted (Table 1). Planktothrix biovolume measured at Napoleon tracked the decline in P. agardhii reported from De fiance (Fig.2c) with a reduction of ~one-order of magnitude in biovolume per day between 4–6 June(Fig.5). Likewise, potential toxin-producing Planktothrix as determined by qPCR declined in step with the decline in total Planktothrix biovolume,suggesting the cHAB population was dominated by toxin-producing genotypes (Fig.5). Adding further support to this notion was the decline of total microcystins by -0.77 fold between 5–6 June (Table 1, Fig.5). A photosynthesis-irradiance curve generated from a sample collected during the peak of the bloom on 4 June showed high rates of chl-normalized photosynthesis and kinetics indicative of a low lightacclimated community consistent with typical turbid river conditions (Fig.6). Expressed volumetrically( Pmax=86.9 μmol C/[L/h]), photo-synthetic rates measured here were 25% higher compared to earlier measurements from the Maumee River during nonbloom conditions in spring (Hufford, 1965).
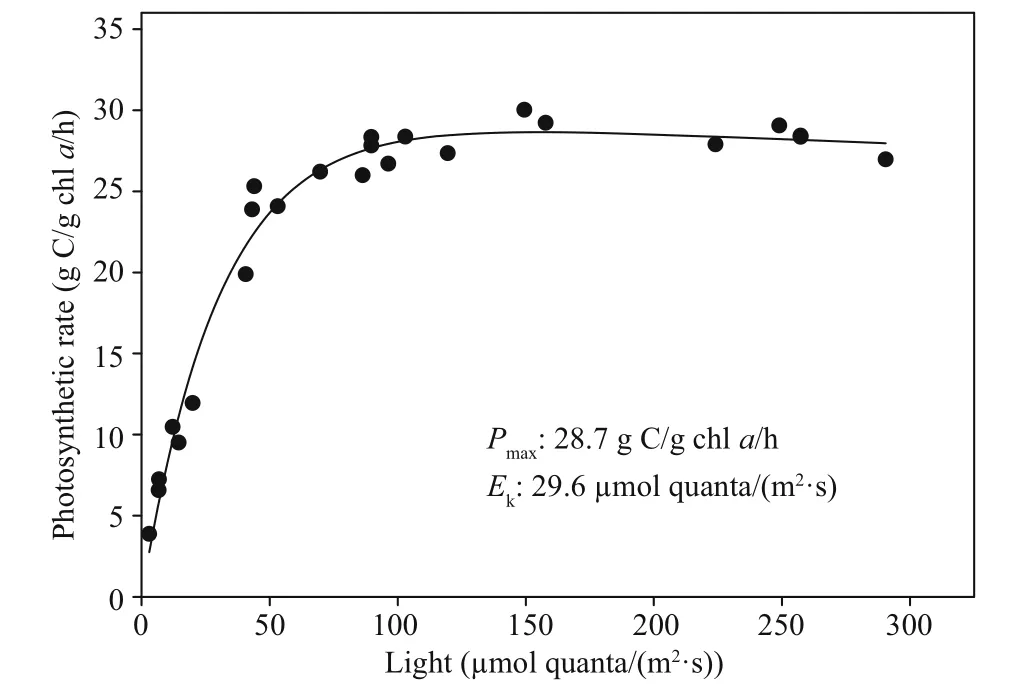
Fig.6 Photosynthesis-irradiance pro file showing acidstable H 14 CO 3 ˉ uptake by phytoplankton sampled from 0.2 m depth in the Maumee River at Napoleon,OH on 4 June during the bloom peak
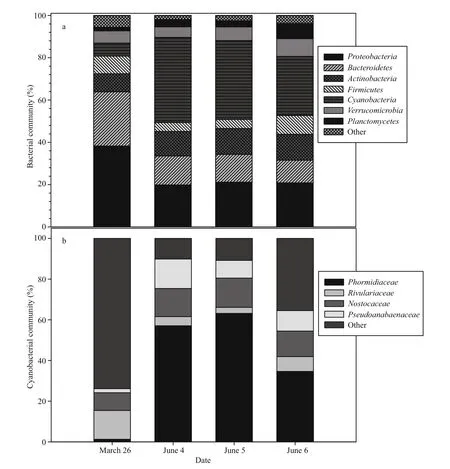
Fig.7 Microbial community pro files by a) phylum ( Bacteria) and b) family ( Cyanobacteria) during the peak of the cHAB in June at Napoleon, OH
Microbial community pro files determined from 16S rRNA gene sequencing spanning the peak and decline of the P. agardhii bloom identi fied relative stability at higher rank taxonomic level amongst both heterotrophs and cyanophytes over the 3-day period of sampling at the Napoleon site (Fig.7). However,comparison to a sample acquired in late March demonstrated distinct seasonality to the microbial consortium highlighted by a 5.5-fold increase in the read contribution by Cyanobacteria observed at the peak of the cHAB in early June and -0.5-fold declines by both Bacteroidetes and Proteobacteria from March to June (Fig.7a). Amongst cyanobacterial families,most taxa increased from March to June with notable increases in Phormidiaceae, Pseudoanabaenaceae and Nostocaceae of 45-fold, 4.5-fold and 0.6-fold,respectively (Fig.7b). Phormidiaceae, the family to which P. agardhii belongs, was dominant amongst all prokaryotes contributing 27% of total microbial reads at the peak of the cHAB. Consistent with this, P.agardhii dominated reads amongst identi fied microbial species (>1 900 total) at 43% of all reads.Amongst heterotrophs, taxa belonging to the genera Planctomyces ( Planctomycetes) and Demequina( Actinobacteria) were most abundant, each contributing ~4% of total reads. The Planctomyces were notable by increasing a further 1.5-fold to >8%of the total microbial community coincident with the decline of the cHAB on 6 June.
4 DISCUSSION
Planktothrix is common in lotic environments, and P. agardhii has been previously described in the Maumee River (Kutovaya et al., 2012) although not previously in bloom concentrations. Various environmental factors likely interacted to promote this Maumee River cHAB. Insights into these factors come from a parametric river eutrophication model applied to China’s Han River which identi fied phosphorus load followed by flow rate and temperature as having the strongest in fluence on bloom occurrence(Xia et al., 2012). These same factors interacted to promote the Maumee River cHAB; negligible precipitation over the final two weeks of May 2016 resulted in river discharge rates up to 50% lower than the 85-year median recorded for the Maumee.Whereas low discharge is common for the river in late summer, such low flow is unusual for spring when nutrients are also elevated. Likely also contributing to the cHAB was rapid warming of river surface water from 13°C to 26°C over the final two weeks of May.
Several known characteristics of Planktothrix also likely assume roles in bloom formation. First,Planktothrix spp. are particularly well adapted to low irradiances that may result from light attenuation due to suspended sediment (Scheffer et al., 1997; Havens et al., 2003; Reynolds, 2003). Consistent with this characterization, a sample collected at the peak of the bloom possessed low Ek(~30 μmol quanta/(m2·s)),the irradiance at which photosynthesis becomes light saturated. With near surface irradiances routinely in this range (Verduin, 1959), the light environment of the Maumee River matches that of other sites supporting Planktothrix blooms (Scheffer et al.,1997). Further, there was little evidence of photoinhibition (β=6.7×10⁻³([g C/g chl a/h]/[μmol quanta/(m2·s)]), at least through the range of light levels tested. As such, P. agardhii could exploit the higher light penetration coincident with greater transparency resulting from low river discharge to promote rapid growth.
Second, among cyanobacterial taxa, Planktothrix is capable of tolerating a wide temperature range relative to common bloom forming genera such as Microcystis, Aphanizomenon, and Anabaena (Foy et al., 1976; Post et al., 1985). Whereas the cHAB coincided with a rapid rise in the temperature of the Maumee River in late May, the bloom had been seeded weeks earlier with Planktothrix assuming cell densities of over 1×10⁷cells/L by early May when the water temperature was <15°C (Fig.2c).
Finally, an oft-overlooked property of Planktothrix is its documented ability to assimilate organic carbon.Besides inorganic carbon assimilation, Planktothrix can use and excrete dissolved organic carbon (DOC).Amino acids and peptides are vital components of DOC, which can help meet the demands of C and/or N, especially when dissolved inorganic nitrogen is limited (Znachor and Nedoma, 2010). Mixotrophy may allow successful competition with other heterotrophic and phototrophic microbes alike (Van den Wyngaert et al., 2011). It has been proposed that DOC uptake might be important for Planktothrix to grow under low irradiance conditions. Indeed, as light availability decreases, uptake of DOC by Planktothrix has been shown to increase (Zotina et al., 2003).
Amongst Planktothrix congeners, both potential toxin-producing and non-toxin-producing genotypes may co-occur. Loss of the mcy gene cluster required for toxin production appears to be speci fic to phycocyanin-dominant taxa such as P. agardhii(Kurmayer et al., 2004) with divergence between toxin genotypes likely occurring early in the evolution of Planktothrix spp. (Christiansen et al., 2008).Under bloom conditions when P. agardhii dominates,the proportion of cells possessing the mcy genotype can vary widely (Briand et al., 2008a; Davis et al.,2015). A two-year study of a suburban Parisian lake in which P. agarhdii was dominant during bloom periods showed wide variation (31% to 83%) in the presence of the microcystin-producing genotype,with the proportion of this genotype negatively correlated with P. agarhdii cell abundance (Briand et al., 2008a). Within the Lake Erie basin, P. agardhii dominates the persistent (May-October)cyanobacterial bloom in Sandusky Bay. In that system, the lower proportion of mcyA reads compared to P. agardhii-speci fic reads of the global nitrogen regulator ntcA derived from a metagenomic analysis suggested that non-toxin producing genotypes were dominant (Davis et al., 2015). An unique attribute of the 2016 Maumee River cHAB was the high proportion of potentially-toxic genotypes associated with the bloom. In fact, qPCR analysis informed that microcystin-producing Planktothrix represented~100% of Planktothrix genotypes on each day of analysis during the peak of the bloom in the Maumee River, a trait more commonly associated with populations dominated by the phycoerythrinpigmented P. rubescens (Ostermaier et al., 2012).Why toxin-producing genotypes dominated the P. agardhii population in the Maumee River cHAB is unknown although may be related to environmental conditions. In competition experiments matching potential microcystin-producing and non-toxinproducing strains of P. agardhii, growth-limiting environmental conditions (light, temperature,nutrients) promoted success of toxin-producing strains (Briand et al., 2008b). The typical growthlimiting environment of the river, at least in terms of the light climate, may play a role in maintaining dominance of potential toxin-producing genotypes of P. agardhii in the Maumee River.
The microbial community pro file based on high throughput Illumina sequencing revealed a cyanobacterial community more complex than ascertained through microscopic analysis alone.Whereas P. agardhii dominated reads amongst identi fied microbial species (>1 900 total) at 43%,Planktothrix spp. contributed <60% of cyanobacterial reads over the peak of the bloom from June 4–5.Notable amongst other cyanobacterial taxa were Pseudoanabaena sp. and Nostoc spp. which contributed 8%–14% and 10%–11%, respectively of cyanobacterial reads over the same period.Pseudoanabaena forms simple trichomes (Acinas et al., 2009) and is closely related to Limnothrix which is known to co-occur with P. agardhii in shallow,eutrophic lakes (Rücker et al., 1997; Zwart et al.,2005). Due to morphological similarities and considering the dominance of P. agardhii in Maumee River samples, it was possible that Pseudoanabaena were enumerated as P. agardhii.
5 CONCLUSION
The early onset bloom of P. agardhii in the Maumee River might have gone undetected if not for recently implemented legislation in the State of Ohio mandating regular monitoring of surface waters supplying municipal public water systems. The new monitoring criteria re flect heightened awareness by state- and municipal governments over contamination of municipal water supplies following the August 2014 Toledo, OH water crisis, during which microcystins persisted above the World Health Organization guideline of 1 μg/L in drinking water,leaving >400 000 residents without access to potable water for several days (Bullerjahn et al., 2016; Steffen et al., 2017) and with reports of negative physicaland mental health effects on area residents (McCarty et al., 2016). The new legislation, detailed in Chapter 3745-90-03 (Harmful Algal Blooms-Monitoring) of the Ohio Administrative Code, took effect 1 June,2016, thus coinciding with the Maumee River cHAB.These rules mandate weekly monitoring of both raw and finished water for total microcystins from May through the end of October with biweekly monitoring of raw water only from November through April.Detection of microcystins >5 μg/L in raw water (or any detectable microcystins in finished water) triggers more frequent monitoring until the concern has abated. In addition to assay for microcystins by ELISA, the State also mandates biweekly year-round screening by qPCR for mcyE, with detections >5 gene counts/μL triggering follow-up microcystins assay by ELISA. It was this state-mandated microcystins assay that reported the bloom having elevated toxicity of 19 μg/L, exceeding both the State threshold triggering higher frequency monitoring and a Recreational Public Health Advisory.
The State of Ohio’s cHAB response strategy is revised periodically to re flect advances in technology as well as continuing efforts to better understand environmental factors that promote blooms.Recognizing that not all surface waters supplying public water systems are equally susceptible to cHABs, the State issued a tiered monitoring schedule effective 1 May, 2017. Whereas biweekly screening by qPCR is retained in the revised schedule, not all public water systems are mandated to conduct weekly testing for microcystins by ELISA. Rather, the majority of public water systems (including those drawing from the Maumee River) will follow monitoring Schedule 2 requiring biweekly screening for microcystins by ELISA, although required in alternate weeks to qPCR screening. Exceedances above the thresholds outlined above (>5 μg/L microcystins or >5 gene counts/μL) will trigger elevation to Schedule 1 monitoring mandating weekly toxin assays by ELISA. Recognizing that Planktothrix does not form surface scums, a bloom can be difficult to discern in an otherwise turbid river system. In the absence of a visible bloom and prior to the implementation of the recent statewide (Ohio)microcystin testing mandate, there would be little incentive for public water system operators to conduct expensive testing, especially during spring and early summer given the higher temperature threshold of most bloom-forming cHAB taxa (Paerl and Huisman,2008). The bloom of microcystin-producing Planktothrix reported here validates the implementation of these recently mandated statewide protocols and argues for their adoption by public water systems elsewhere.
6 DATA AVAILABILITY STATEMENT
Monitoring data that support the findings of this study are available from the following repositories:
USGS Water Data for the Nation: https://waterdata.usgs.gov/nwis
Water Quality Portal: https://www.waterqualitydata.us/
Harmful Algal Blooms (HAB)-Ohio EPA: http://www.epa.ohio.gov/ddagw/hab.aspx
Heidelberg Tributary Loading Program, Heidelberg University-National Center for Water Quality Research:https://ncwqr.org/monitoring/
7 ACKNOWLEDGEMENT
The authors thank Heather Raymond, State HAB Coordinator for Ohio EPA for alerting us to the Maumee River cHAB described in this contribution.Thanks are also extended to Scott Hoover and JeffWeis of the City of Napoleon and Donna Francy of the USGS Michigan-Ohio Water Science Center for their assistance providing data from the Maumee River. Chaoxuan Guo (Nanjing Institute of Geography and Limnology) shared helpful information regarding recent cHABs in Chinese rivers. Ben Beall contributed the map showing sampling sites. The manuscript also bene fitted from helpful comments of two anonymous reviewers.
 Journal of Oceanology and Limnology2018年4期
- Journal of Oceanology and Limnology的其它文章
- Editorial Statement
- Recent insights into physiological responses to nutrients by the cylindrospermopsin producing cyanobacterium,Cylindrospermopsis raciborskii*
- Response of Microcystis aeruginosa FACHB-905 to different nutrient ratios and changes in phosphorus chemistry*
- In fluence of light availability on the speci fic density, size and sinking loss of Anabaena flos- aquae and Scenedesmus obliquus*
- Application of first order rate kinetics to explain changes in bloom toxicity—the importance of understanding cell toxin quotas*
- Regime shift in Lake Dianchi (China) during the last 50 years*
