The effects of electrochemical oxidation on in-vivo fluorescence and toxin content in Microcystis aeruginosa culture*
ROZINA Tinkara , ELERŠEK Tina , Maja ZUPANČIČ JUSTIN , MEGLIČ Andrej ,LEŠTAN Domen , SEDMAK Bojan
1 Envit d.o.o., Vojkova cesta 63, 1000 Ljubljana, Slovenia
2 Department of Genetic Toxicology and Cancer Biology, National Institute of Biology, Večna pot 111, 1000 Ljubljana, Slovenia 3 Arhel d.o.o., Pustovrhova ulica 15, 1000 Ljubljana, Slovenia
4 Biotechnical Faculty, University of Ljubljana, Večna pot 111, 1000 Ljubljana
5 Centre for Soil and Environmental Sciences, Biotechnical Faculty, University of Ljubljana, Jamnikarjeva 101, 1000 Ljubljana,Slovenia
Abstract The increasing occurrence of cyanobacterial blooms in water bodies is a serious threat to the environment. Efficient in-lake treatment methods for the control of cyanobacteria proliferation are needed,their in-vivo detection to obtain a real-time response to their presence, as well as the information about their physiological state after the applied treatment. In-vivo fluorescence measurements of photosynthetic pigments have proved to be effective for quantitative and qualitative detection of phytoplankton in a water environment. In the experiment, chlorophyll and phycocyanin fluorescence sensors were used concurrently to detect stress caused by electrochemical oxidation applying an electrolytic cell equipped with borondoped diamond electrodes on a laboratory culture of cyanobacteria Microcystis aeruginosa PCC 7806. The in flicted injuries were re flected in a clear transient increase in the phycocyanin fluorescence signal (for 104%± 43%) 24 h after the treatment, which was not the case for the chlorophyll fluorescence signal. In the next 72 h of observation, the fluorescence signals decreased (on 40% of the starting signal) indicating a reduction of cell number, which was con firmed by cell count (24% reduction of the starting concentration)and analysis of extracted chlorophyll and phycocyanin pigment. These results demonstrate the viability of the combined application of two sensors as a useful tool for in-vivo detection of induced stress, providing real-time information needed for the evaluation of the efficiency of the in-lake treatment and decision upon the necessity of its repetition. The electrochemical treatment also resulted in a lower free microcystins concentration compared to control.
Keyword: Microcystis aeruginosa; electrochemical oxidation; cyanotoxins; fluorescence; chlorophyll a;phycocyanin; boron-doped diamond electrode
1 INTRODUCTION
Cyanobacterial blooms are a worldwide concern and pose an environmental and health problem(Carmichael, 1992). Many cyanobacterial species produce cyanotoxins. Microcystis aeruginosa, which commonly occurs and dominates in highly eutrophic lakes and ponds (Yamamoto and Nakahara, 2009),produces a hepatotoxic microcystin. Rapid, natural or arti ficially induced cell decay leads to the release of these intracellular biologically active products into the water (Jones and Orr, 1994), where they present a threat to the environment, animals and humans(Carmichael, 1992; Svirčev et al., 2017). In recent years, the number of harmful blooms at the global level has been increasing regarding frequency and duration, as well as in the magnitude of the phenomenon (Paerl et al., 2011; Paerl and Otten,2013; Brooks et al., 2016). Protection of water bodies and prevention of input of nutrients is often not sufficient. For this reason, we also need in-lake methods for the control of cyanobacteria to prevent their excessive growth directly in the water body.
There are several cyanobacteria control measures.Chemical and physical approaches of adding substrates that bind plant nutrients, circulation of water, and others methods can be used (Jančula and Maršálek, 2011). Other options are various methods of induced stress, such as exposure to UV radiation,application of hydrogen peroxide and electrochemical oxidation, which have direct external and also intracellular impact on cyanobacteria by eliciting reactive oxygen species (ROS) overproduction,provoking irreversible cell damage. The unfolding of DNA and changes in auto fluorescence can be detected in affected cells (Ding et al., 2012, 2013; Meglič et al., 2017). Several studies showed that cyanobacterial prokaryotic cells were more sensitive to ROS than eukaryotic phytoplankton, zooplankton and macrofauna (e.g. Drábková et al., 2007; Barrington and Ghadouani, 2008; Matthijs et al., 2012; Barrington et al., 2013). Their higher sensitivity was re flected in collapse or decay at lower applied doses of hydrogen peroxide. For the targeted effect on cyanobacteria, the right concentration of ROS should be produced to avoid the unwanted effect on other lake biota. In our case, we have selected electrochemical oxidation processes with the application of electrolytic cell equipped with boron-doped diamond (BDD)electrodes. Application of electrochemical oxidation with BDD anodes has been demonstrated as a promising method for disinfection of water after biological treatment (Schmalz et al., 2009; Frontistis et al., 2011; Haaken et al., 2012; Daghrir et al., 2014),for disinfection of ballast marine water from ships(Lacasa et al., 2013), degradation of recalcitrant organic matter in wastewater, such as textile dyes(Martínez-Huitle and Brillas, 2009), land fill leachate(Cabeza et al., 2007), residues of medical pharmaceuticals and phytopharmaceuticals (García-Montoya et al., 2015). Within the electrolytic cell,free radicals, in the most part hydroxyl radicals (•OH),are produced directly from water with the use of electric power (Chen, 2004). The BDD electrodes are advanced, inert electrodes (high stability in strong acid media), with a wide potential window and high overpotential for oxygen evolution, producing the highest amount of •OH (Liao et al., 2014). Degradation and inhibition of toxicity of microcystins,cyanobacterial toxins, with the use of electrochemical oxidation in a laboratory electrolytic cell equipped with a BDD electrode have also been proven (Zhang et al., 2009; Sharma et al., 2012; Liao et al., 2014;Meglič et al., 2017).
In the case of the use of selective or target-design cyanobacteria control techniques, when targeted treatment is directed merely to cyanobacteria, and not to the rest of the phytoplankton in the water body, it is appropriate to act in the early stages of the growth of cyanobacteria, well before the onset of a pronounced blooming. This would reduce the required input of energy and resources for the control of cyanobacteria,as well as prevent the sudden release of intracellular cyanotoxins in the case of lysis of cyanobacterial cells. To be able to take action at an early stage, as well as directly monitor the effects of the measures or treatment, a method of detection and quanti fication of phytoplankton and bacterioplankton need to be available that provides real-time information from the greatest possible area of the water body. The occasional withdrawal of samples from only a few locations of the water body, with a conventional laboratory extraction of the photosynthetic pigments,taxonomic analysis and biovolume determination is in this case not sufficient. A useful approach would be on such occasion the application of submersible fluorometers, with, for example, a simultaneous measurement of the fluorescence of chlorophyll and phycocyanin. This would help to obtain a large number of continuous measurements that may be carried out over a large area of the water body. They allow us to distinguish between cyanobacteria and the rest of eukaryotic algae, as well as their quanti fication.In the last few years, advances in sensor technology have enabled the measurement of the fluorescence of photosynthetic pigments in-vivo, providing a new approach for fast detection of changes in a water body, with high spatial and temporal resolution(Bastien et al., 2011).
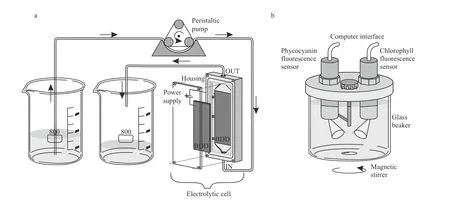
Fig.1 Experimental set-up
In previous studies, we have shown that we can successfully follow the development of the phytoplankton in the water body, with the use of chlorophyll and phycocyanin sensors ( Rozina et al.,2017 ). Also, our studies using small laboratory electrolytic cell under different operation regimes have shown that the formation of hydroxyl radicals causes various types of damages to the cyanobacteria,thereby controlling their further growth as well as inactivation of their cyanotoxins (Meglič et al., 2017).Therefore, the first objective of the research presented in this paper was to find out the rate of the cyanobacteria population decline under the selected operation setting of the larger scale electrolytic cell. We wanted to know whether there are direct lysis of cells and thereby release of cyanotoxins, or a progressive collapse of the cells occurs due to the induced stress to the point where the cellular repair mechanisms fail.The second objective of the study was to evaluate whether we could follow the changes in phytoplankton population caused by the electrolytic cell activity with the use of submersible phycocyanin and chlorophyll sensors. The studies represented a basis for the transfer of both methods on a floating platform(Zupančič Justin et al., 2017) which should allow real-time detection of cyanobacteria as well as a direct inhibition of their proliferation, in the case of detected increased concentrations by activation of the electrolytic cell.
2 MATERIAL AND METHOD
2.1 Cyanobacterial strains and cultivation
Experiments were performed on an axenic microcystin-producing unicellular strain Microcystis aeruginosa PCC7806 obtained from Institute Pasteur(Pasteur, France). Cells were maintained under sterile conditions in 100-mL flasks with 50 mL of Jaworski medium and kept under natural daylight. Cell counts were determined with a Bürker-Türk haemocytometer(Blaurand, Germany) under an inverted Eclipse TE300 microscope (Nikon, Japan), minimum 400 cells were counted.
Relatively high concentrations of cells were used(about 4× 10⁶cells/mL) in order to effectively monitor different responses, including cell proliferation,fluorescence and cyanotoxin content.
2.2 Electrolytic cell
The electrochemical treatment was carried out in a single-compartment electrolytic cell with 12 mL working volume and Plexiglas housing. Two borondoped diamond (BDD) electrodes (Condias,Germany) placed parallel 2 mm apart served as the anode and cathode (Fig.1a). The BDD plate had a niobium (Nb) base coated with a conductive polycrystalline diamond layer. The surface area of each electrode was 60 cm2. The surface of the electrodes was cleaned with ethanol, Milli-Q water and Jaworski growth medium before each experimental run. The current density was adjusted to 10 mA/cm2using a laboratory DC power supply(Gwinstek, China) in constant current mode at room temperature. The processed volume of the culture of each experimental set was 500 mL.
2.3 Fluorescence measurements
Measurements of chlorophyll a and phycocyanin fluorescence were made before electrochemical treatment and after the treatment for 72 h. A portable KM 245 (Arhel, Slovenia) water quality system equipped with submersible chlorophyll and phycocyanin fluorescence sensor (Cyclops 7, Turner,USA) was used. The sensors, fitted with a selfcleaning function, were fixed on the cover of the measuring chamber. The container (500 mL) of the measuring chamber was for this experiment made of glass and put on a magnetic stirrer (C-MAG MS4,IKA, Germany) to prevent settling (Fig.1b). For the further application, the cover of the measuring chamber was converted into a flow-through system that allows continuous measurement of the in flow water (Zupančič Justin et al., 2017). The chlorophyll sensor excited at 460 nm and measured emission at 685 nm. The phycocyanin sensor excited at 595 nm and measured the fluorescence emission at 650 nm.Data sampling frequency was set to 4.5 Hz. The KM 245 includes an electronic interface with an analogue to digital converter (ADC) and RS232 bus for communication with the computer, which served as a data logger. An average fluorescence was calculated for distinctive time periods of 5 min fluorescence measurements; the average signal was presented in relative units [r.u.] that correspond to the voltage output of the sensors.
2.4 Determination of chlorophyll a and phycocyanin concentrations
CHL a concentrations were determined spectrophotometrically according to ISO(1992). In short: the sample was filtered through a GF/C glass fibre filter (Sartorius Stedim Biotech, Germany). The filter was placed in a glass centrifuge tube, poured with ethanol, shaken and stored overnight in a refrigerator.The tube was then placed for 5 min in a water bath at 75°C. Absorbance at 665 and 750 nm was measured before and after acidi fication with hydrochloric acid.
Phycocyanin was extracted according to a modi fied protocol (Meriluoto et al., 2017) with a freezingthawing-sonication procedure followed by a spectrophotometric determination at 565, 620, 650 and 750 nm. The PC concentrations were calculated according to Fujita (1979) in Lee et al., (1994). The analysis was done in triplicate.
2.5 Microcystins determination
A Microcystins-ADDA ELISA (Abraxis, USA) kit was used to determine free and total microcystins.Measurements were done at the same time intervals as the fluorescence measurements and cell concentration measurements: immediately after treatment in the electrolytic cell and after 24, 48, and 72 h. For determination of total (free and cell-bound)microcystins, samples were lysed by a freeze and thaw procedure. Before analysis, all samples were filtered using GF/C glass fibre filters (Sartorius Stedim Biotech, Germany). Samples with a higher concentration than 5.0 ng/mL were diluted using Jaworski medium. The test is an indirect competitive immunoassay for the congener-independent detection of microcystins and nodularins. The kit consists of a 96 well microtiter plate with immobilised Microcystins-protein analogue. Assays of standards or samples were performed following the kit instructions. Brie fly, a 50-μL volume of the standard solutions, control or samples were added to the wells;50 μL of the antibody solution was then added to the individual well and incubated for 90 min at room temperature. The wells were emptied and washed three times with 250 μL of washing buffer. A volume of 100 μL of the enzyme conjugate solution was added and incubated for 30 min and again washed three times with 250 μL of washing buffer; 100 μL of substrate solution was then added. A colour signal was generated with the blue colour inversely proportional to the concentration of microcystins present in the sample. After 20–30 min of incubation,50 μL of stop solution was added to stop the reaction,and the solutions turned yellow. Absorbance was recorded within 15 min at 450 nm using a microplate reader (Synergy TM Mx, BioTek, USA). Evaluation of the ELISA was performed using a 4-parameter dose-response curve. The analysis was done in triplicate.
2.6 Experimental procedure
The effect of electrochemical treatment was studied on the PCC 7806 strain. An undisturbed cell culture without electrochemical treatment was used as a negative control. A volume of 500 mL of suspension with approximately 4× 10⁶cells/mL was channelled through the electrolytic cell at a constant flow of 75 mL/min using a peristaltic pump Master flex EW-07553-75 (Cole-Parmer, USA) in a batch-wise flowthrough mode from one beaker to another. The peristaltic pump was used to avoid contamination of the cell culture and maintenance of sterile conditions,as well as to reduce the shear force to the cells. In previous experiments (results not shown), several negative control tests were carried out with 50 mL samples in duplicates, comparing undisturbed samples and once, five times and ten times pumped samples through the switched off electrolytic cell at 10 mL/min flow. The results showed no difference between undisturbed samples and pumped samples. Therefore only undisturbed samples were used as a control in the presented experiment. The treatment consisted of five passages through the electrolytic cell under conditions as already described, which represents joint electro-oxidation contact time of 48 s. This contact time was selected upon previous results obtained by Meglič et al. (2017), working with smaller sample volumes and achieving pronounced effects on cyanobacteria. After the treatment, the samples were kept for 72 h under natural daylight at room temperature. The effects were followed by fluorescence measurements, cell counts, extraction of CHL a and PC and determination of total and free microcystins. The available quantity of cyanobacterial culture allowed work in three replicates.
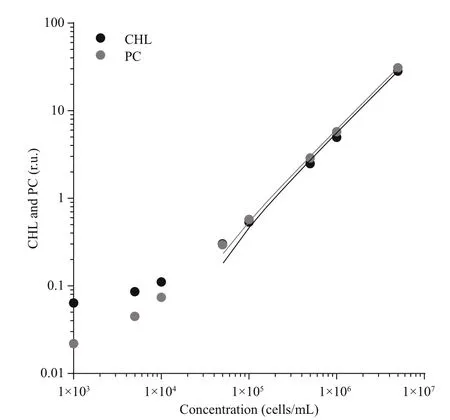
Fig.2 Correlation between chlorophyll (CHL) and phycocyanin (PC) fluorescence and cell count
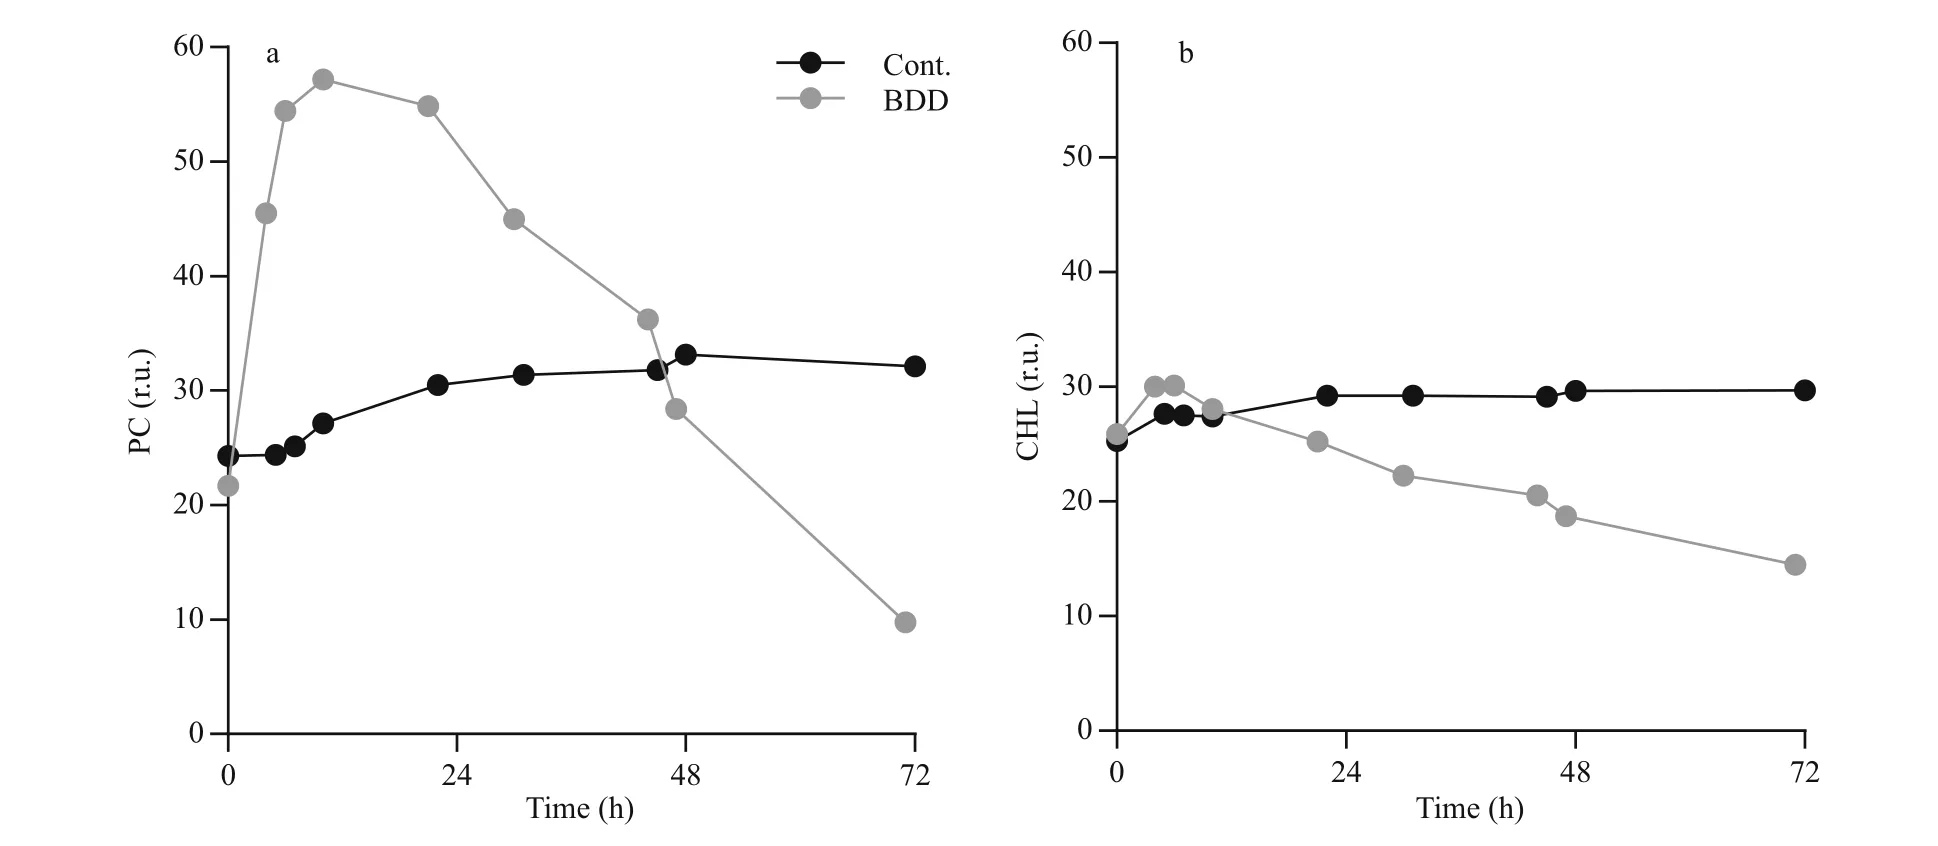
Fig.3 Chlorophyll a (CHL) and Phycocyanin (PC) fluorescence changes
3 RESULT
The relation between fluorescence signal and cell concentration was evaluated using different dilutions of Microcystis aeruginosa PCC 7806 suspension,ranging from 1× 10³to 5× 10⁶cells/mL. The results(Fig.2) show a linear response for CHL and PC sensor with R2higher than 0.99 in the range from 5× 10⁴to 5× 10⁴cells/mL. With cyanobacteria concentration between 6.6× 10⁴and 6.2× 10⁶, we were able to reliably follow the changes in fluorescence with simultaneous use of PC and CHL sensor. In the case of our cyanobacteria culture and set of sensors, the intensity of both signals was the same; the PC/CHL ratio was approximately 1.
Immediately after the BDD treatment, the intensity of the PC signal unlike CHL sharply increased (Fig.3).The peak of the signal was reached 6 and 10 h after the treatment for CHL and PC, respectively. The PC signal started to decline only 12 h after the treatment(0.6±0.2 r.u./h decline rate) and reached the values,which were measured in the control series, 48 h after the treatment. The intensity of the PC signal was decreasing in the remaining part of the observation.After 72 h, the PC signal declined to 35% of the control value. The intensity of the CHL signal increased slightly immediately after the BDD treatment (10%±6% increase compared to the control)and reached the intensity of the CHL signal of the control samples 12 h after the treatment. The signal of the control samples slightly, but steadily increased(0.03 r.u./h) during 72-h observations, while CHL fluorescence of experimental samples decreased at the rate of 0.24±0.001 r.u./h.
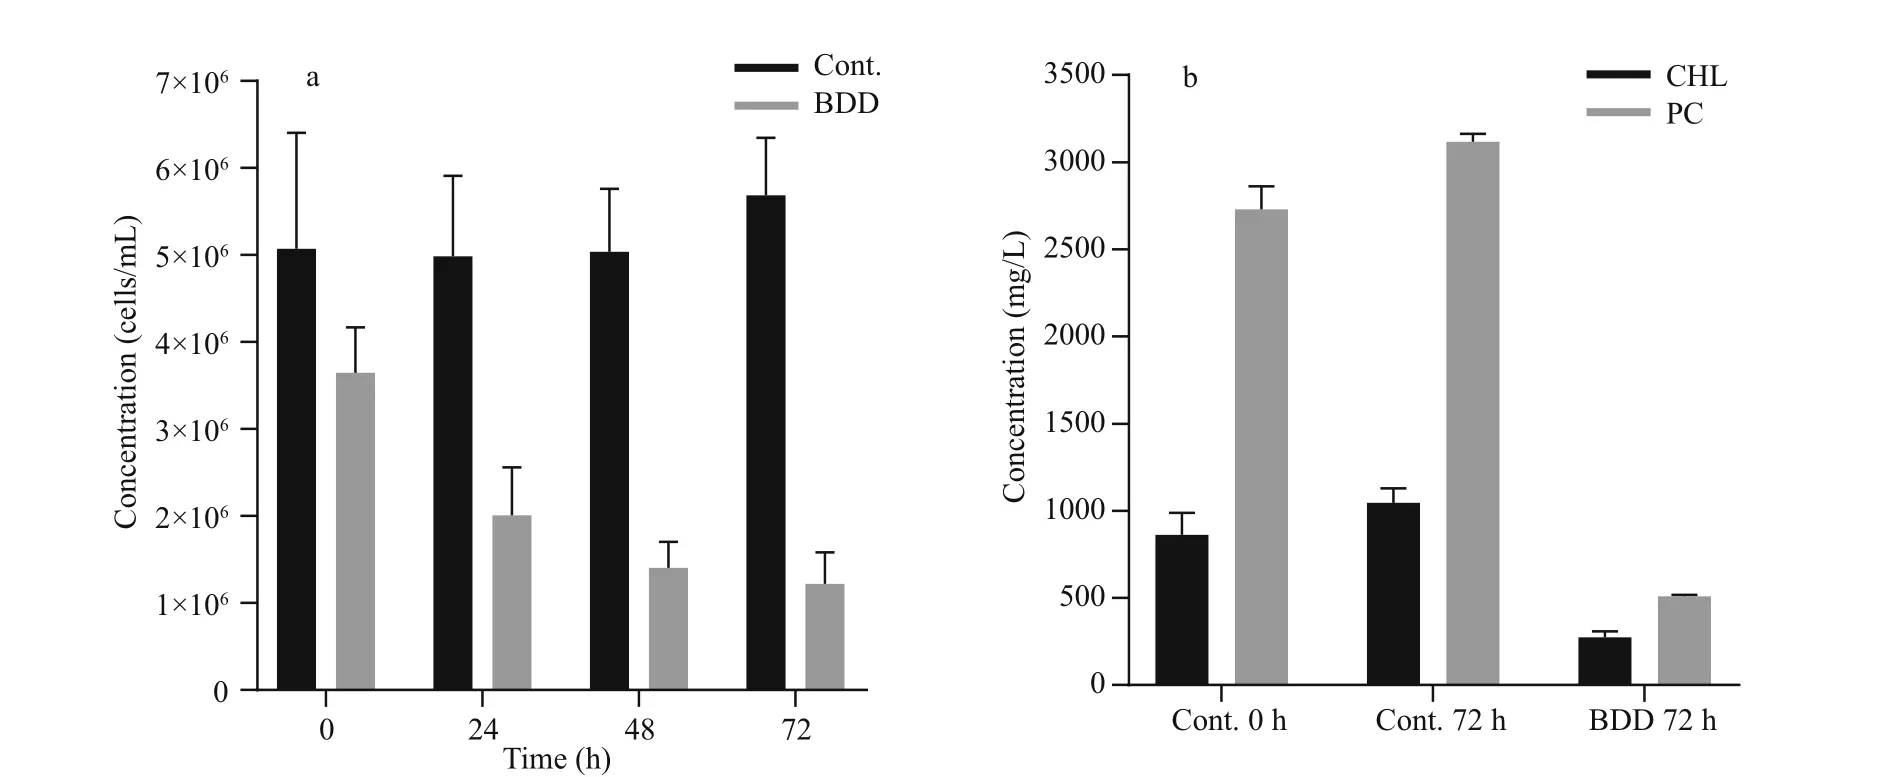
Fig.4 Cell concentration and content of extracted PC and CHL in control and treated samples
The drop in PC and CHL fluorescence of the experimental samples after 72 h was in accordance with lower cell counts and lower concentration of extracted CHL and PC pigments (Fig.4). The cell count (Fig.4a) showed a drop in the cell number(27±9%) in the experimental series already immediately after the treatment ( t=0). Further on, the number of cells in the experimental series all the time gradually decreased, while the concentration of the cells of the control samples slightly increased during 72-h observation period. After 72 h, the number of cells in the treated samples dropped to 24% of the starting concentration. A statistically signi ficant decrease in cell count appeared on the second day ( P-value 0.027). A reduction in the concentration of extracted CHL and PC was also observed (Fig.4b).The PC concentration dropped to 19 and CHL to 32%of the starting concentration in 72 h after the treatment,although the relative concentration of CHL and PC per cell did not change in 72 h after treatment (data not shown). In the control samples, the concentration of both pigments slightly increased (CHL for 22%±8%and PC 14%±4%) , the same as the number of cells (2%to 26% increase). With the given set of CHL and PC fluorescence sensors, our pure culture of PCC 7806 cells gave PC/CHL fluorescence ratio around one under control experimental conditions (Fig.5). After a single BDD treatment, the PC/CHL ratio increased up to 2, and remained increased for 48 h (Fig.5).
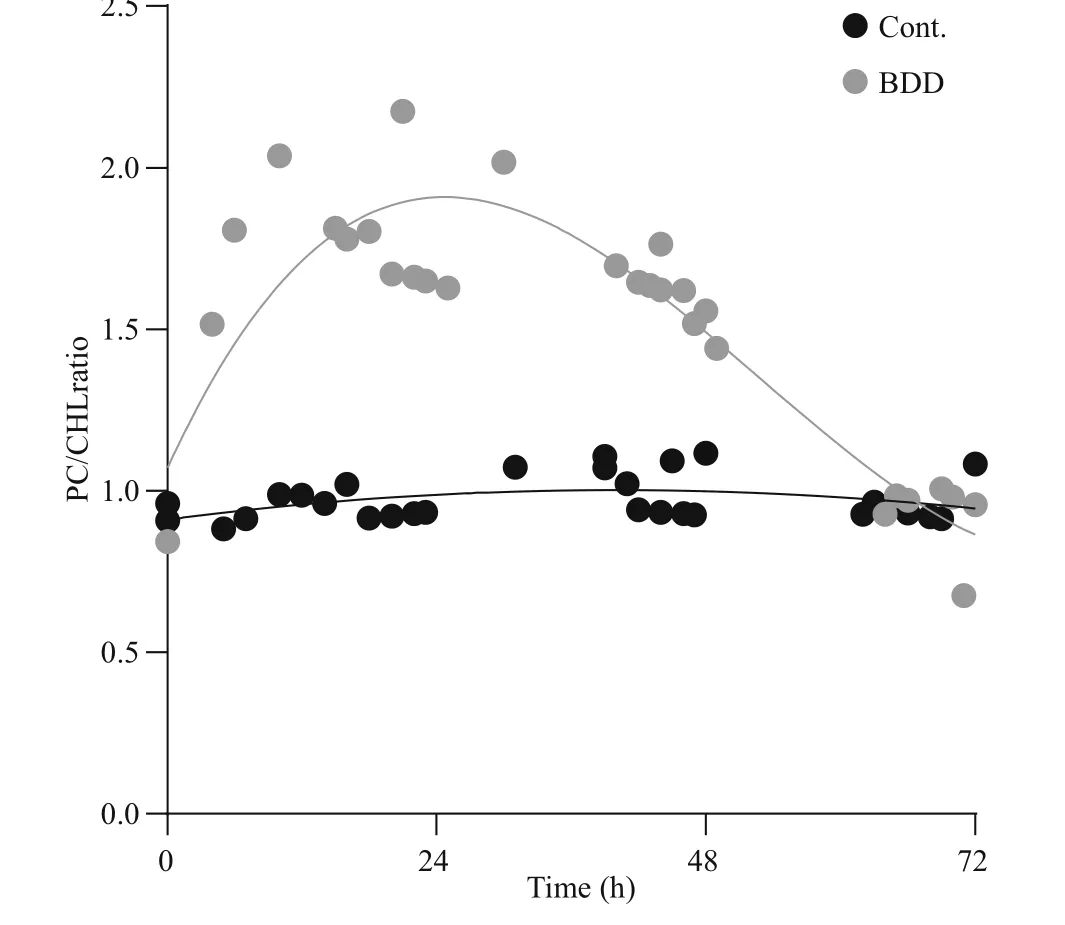
Fig.5 Cells fluorescence response presented as a ratio between PC and CHL fluorescence
The concentration of free microcystins (usually up to 5% of all microcystins was assessed during our studies) in the control samples remained constant throughout the 72 h, while the concentration of the total microcystins was increasing together with the increasing cell count (from 345±34 to 450±42 ng/mL).Immediately after the treatment ( t=0), the concentration of free toxins in the experimental samples dropped practically to zero (1.0±0.1 ng/mL). Afterwards, the concentration of free cyanotoxins steadily increased in the experimental samples during the 72 h of observation(1.36±0.06 ng/mL increase per hour; 101±6 ng/mL after 72 h), but did not exceed the concentration of free toxins in the control samples after 72 h of observation(143±21 ng/mL). The concentration of the total cyanotoxins in the treated samples was increasing until the analysis performed 24 h after the treatment(from 102±8 to 178±79 ng/mL); afterwards, the concentration of the total cyanotoxins remained constant, between 164 and 178 ng/mL.
4 DISCUSSION
4.1 Monitoring cyanobacterial concentration and physiological response after treatment
The development of methods for reliable real-time monitoring of cyanobacteria and in-lake control of their abundance is the basis for safe management of water bodies. In contrast to other groups of algae,which usually contain high amounts of chlorophylls,cyanobacteria also contain accessory photosynthetic pigments, such as phycocyanin. Both chlorophyll and phycocyanin express auto- fluorescence. In contrast to green algae, cyanobacterial photosystem II contains only 10% to 20% of the total CHL (Bryant, 1987), the rest is located in photosystem I, which does not dissipate energy through fluorescence. Consequently,in-vivo CHL fluorescence of cyanobacteria is relatively low regardless of the CHL pigment content in the cell (Campbell et al., 1998). The chlorophyll(CHL) fluorescence is mainly emitted by CHL a of photosystem II (PS II) antenna system, which consists of an evolutionary conserved CHL a containing core and species-dependent peripheral antennae (Beutler et al., 2002). In cyanobacteria, phycobilisomes,containing phycocyanin (PC), function as peripheral antennae. CHL a and PC have a strong fluorescence response at different wavelengths, enabling differentiation between two groups (Yentsch and Yentsch, 1979; Oldham et al., 1985; Hilton et al.,1989; Beutler et al., 2002; Gregor and Maršálek,2004; Gregor et al., 2007), which was also con firmed by our experiment and our previous long-term field observations ( Rozina et al., 2017). Due to a high correlation between the fluorescence signal and the cell count (Chang et al., 2012) or biovolume (Seppälä et al., 2007; Macário et al., 2015), simultaneous quanti fication of cyanobacteria biovolume can be performed.
Since the intensity of the fluorescence depends on the physiological state of the organism, such measurements provide, in addition to biomass estimation, also an insight into the physiological condition of the cyanobacteria (Sedmak et al., 2009;Ding et al., 2012, 2013). Changes in the ratio between CHL a and PC response re flect the efficiency of photosynthesis and cell integrity of the cyanobacteria.In the case of cell disruption or lysis, which can be a consequence of ageing or stress conditions,phycocyanin may disassemble from the photosystem and be released into the water (Gantt et al., 1979;Zilinskas and Glick, 1981; Wlodarczyk et al., 2012),producing a lower fluorescence signal. Alternatively,a change in the re-emitted energy of the photons,observed as increased fluorescence emission of the phycocyanin may be observed, when the energy transfer to reaction centres with chlorophylls in the photosystem is disrupted. This can be observed, for example, when phycobiliproteins, important cyanobacterial light-harvesting extra-membranous complexes, energetically decouple from photosystems(Zilinskas and Glick, 1981). Such transient increase of in-vivo fluorescence of PC was evident in our experiments after the treatment of the cyanobacterial sample in the electrolytic cell producing hydroxyl radicals. The increased fluorescence of PC was a consequence of decoupled phycobiliproteins form of chlorophyll-containing PS II reaction centres, to which the energy from phycobiliproteins could no longer be transferred and re flected in increased fluorescence, a signi ficant stress response to induced stress (Zilinskas and Glick, 1981). After the cell lysis and PC release into the water, the fluorescence signal decreased.
The PC signal increased by almost 2.5 times in the first 10 h after the electrochemical treatment (Fig.3).Given the linear relationship between the PC signal and cell concentration, the cell number should have been more than doubled in less than 24 h. The cell doubling time for the most bloom-associated cyanobacterial species ranges from 10 h in optimal laboratory conditions to a few days (Chorus and Bartram, 1999). For Microcystis aeruginosa, the average doubling time is in our experimental conditions 48 h. The performed cell counts and the measured amount of extracted CHL and PC pigments from remaining cells after the treatment con firmed that there was an increase in fluorescence due to stress and not due to the increase in cell concentration.
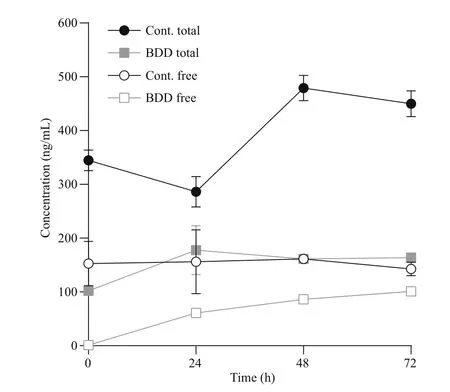
Fig.6 Concentration of total and free microcystins
Slight increases in the PC/CHL ratio in the control sample can be attributed to disturbances of the cells in the medium due to regular measurements with sensors and shaking of the sample. In the case of the application of such measurements and treatment methods in a water body, a ratio between PC and CHL would be more appropriate because it is independent of the biovolume.
4.2 Achieving a progressive decline of cyanobacteria by electrochemical stimulation
Several suggested in-lake treatment methods,mostly chemical, for the removal of cyanobacteria and microcystin, result in the production of harmful byproducts, or the accumulation of heavy metals in ecosystems (Tsuji et al., 1997; van Hullebusch et al.,2003). In the case of the in-lake cyanobacterial control interventions, it is important to avoid rapid cyanobacterial bloom collapse and consequently immediate release of microcystins and other toxic substances into the water environment. Two approaches are possible, prevention of bloom formation or achieving a gradual decline of cyanobacterial concentration (Meglič et al., 2017).Our treatment with the electrolytic cell resulted in the gradual decline of Microcystis aeruginosa proliferation evident through 72 h of observation (Fig.4a). With the production of hydroxyl radicals and other reactive oxygen species, such as hydrogen peroxide (H2O2),the electrochemical oxidation process in an electrolytic cell is similar to the method of direct application of H2O2for cyanobacteria control. The application of H2O2has been already shown to be a high potential in-lake cyanobacteria-speci fic growth control method(Cornish et al., 2000; Drábková et al., 2007; Matthijs et al., 2012), as well as for the use in wastewater treatment plants and waste stabilisation ponds(Barrington and Ghadouani, 2008; Barrington et al.,2013). Through catalysis, H2O2is converted in water into •OH, which also has the capacity to destroy the toxicity of cyanotoxins, such as microcystins, by inducing oxidative cleavage (Antoniou et al., 2008).Hydroxyl radicals, as well as other produced reactive oxygen species in an electrolytic cell (e.g. O3, H2O2,and •O2ˉ), promote cell lysis through inhibition of photosynthetic activity in cyanobacteria by impairing electron transfer and oxygen evolution, which can lead to the inactivation of photosystem II and eventual cell death (Samuilov et al., 2004; Barrington et al., 2013).Damage after exposure to electrochemical oxidation affects cell proliferation, the buoyancy mechanism,thinning of extracellular mucilaginous sheaths, cell shrinkage with the loss of nucleoid homogeneity and loss of auto fluorescence (Meglič et al., 2017).
4.3 Maintenance MC concentrations at acceptable levels
The dynamic of the release of intracellular microcystins into the water environment is of special importance in the case of applying techniques for cyanobacterial removal or destruction of the cyanobacterial bloom directly into the natural environment (Falconer et al., 1989). Rapid cyanobacterial lysis can lead to a release of intracellular microcystins into the water environment(Jones and Orr, 1994). The sudden release of toxins has an adverse impact on the environment and other organisms like phytoplankton, protozoa, bacteria and zooplankton (Martins et al., 2011). Information on the concentration of free (extracellular) and intracellular microcystins before and after the application of inlake treatment method is therefore important.
Immediately after the treatment ( t=0), the concentration of free toxins fell practically to zero,which can be attributed to their decomposition in the electrolytic cell (Fig.6). In a similar experiment, but with double the electro-oxidation time (95.0 s), the efficiency of microcystin degradation was 30% at 10 μmol/L of starting microcystin concentration(Meglič et al., 2017). Tests on microcystin-LR treatment with BDD electrodes also proved it to be a promising alternative to chlorination in a study by Zhang et al. (2009).
Most of the effects of BDD treatment are immediate.The half-life of hydroxyl radicals and other reactive oxygen radicals is less than a second (Pryor, 1986).Ozone and hydrogen peroxide, which are also products of electrochemical reactions, are more longlived, 20–90 min in the case of ozone, depending on the environmental conditions (da Silva et al., 2003). A decrease in cell count after 24 h and a consequent increase in free toxin concentration could therefore not be contributed to a prolonged presence or activity of the radicals formed during electrolysis. The increase in dissolved toxin concentration was largest in the first 24 h after the treatment, which correlated with the period of the highest stress response of the cells, expressed as a peak of PC/CHL fluorescence ratio, and with the largest drop in the cell count. Both effects, the response of cells to oxidative stress and their lysis, are therefore re flected in increased toxin release. The increase in toxin release was subsequently slower and in correlation with lower cell counts and slower further growth rate. The growth rate of cyanobacteria after electrochemical oxidation namely resulted in a two-day delay of cell division. The concentration of free toxins would have eventually reached the total toxins level if all of the cells were lysed immediately after the treatment.
Since the microcystin concentration was measured using immunological assay, there was a possibility that the toxins had only gone through partial degradation and that the concentrations were underestimated and toxicity not reduced. However,we have shown in previous experiments, analysing the biological activity of the products, using a colourimetric protein phosphatase 1 (PP1) inhibition assay, that the degradation products are less active after BDD treatment (Meglič et al., 2017).
Three days (72 h) after the initial treatment of cyanobacteria in the electrolytic cell a visible gradual decline of cells, as well as the concentrations of toxins in comparison to the control group, was detected(Figs.4a, 6). This indicates that by inducing oxidative damage leading to apoptosis or other forms of programmed cell death, a slow and controlled release of toxic cyanobacterial products can be achieved,what was evident from our experiment under selected electrolytic cell operating conditions. The treatment method with BDD electrodes, therefore, indicates high potential in reducing both cyanobacteria and microcystins. In the case of application in a natural environment, additional reduction of released microcystins can be expected by bacterial degradation,photolysis and adsorption to particles (Harada and Tsuji, 1998; Zurawell et al., 2005). For the further environmental application, it is important to consider the triggers of cyanotoxins production in cyanobacterial cells and the role cyanotoxins have in cyanobacterial adaptation to environmental conditions(Boopathi and Ki, 2014). Yang et al. (2015) for example demonstrated that intracellular and extracellular microcystin concentrations decreased markedly when toxin-producing strains were exposed to UV-B radiation. On the other hand, Yang et al.(2015), as well as Ding et al. (2013), con firmed that exposure of microcystin and non-microcystin producing bacteria to UV-B favours microcystinproducing cyanobacteria. The use of hydrogen peroxide, UV radiation and other photo end electrochemical oxidation approaches can induce oxidative stress, which can provoke irreversible cell damage to cyanobacteria through a direct external impact on cells or through stimulating intracellular reactive oxygen species overproduction (Ding et al.,2012, 2013; Meglič et al., 2017). The environmental treatment regarding time of exposure, dosage and repetition of treatment should be therefore such,which would avoid favouring toxin-producing cyanobacteria or avoid triggering toxin production genes in cyanobacteria.
5 CONCLUSION
Treatment of Microcystis aeruginosa PCC 7806 in an electrolytic cell equipped with BDD electrodes caused a visible stress response, resulting later in an apparent decrease in cyanobacterial cell number.Changes in cyanobacterial cell physiology were detected by CHL and PC fluorescence sensors, showing a transient increase in the signal with a peak 12 h after the treatment. Measurements with combined use of PC and CHL sensors measuring in-vivo fluorescence have therefore shown that we can successfully follow the effects caused to cyanobacterial cells by electrochemical stimulation. A signi ficant increase in the signal of the PC sensor in relation to the CHL signal should not be interpreted in this case as an increase in the number of cyanobacterial cells, but as a stress response of cyanobacterial cells. In the case of our experimental settings, the stress response of cyanobacteria cells was evident even 48 h after a single treatment with BDD.The concentration of the cells has been declining even 72 h after a single BDD treatment. The return of the PC/CHL ratio to the value 1 after the induced treatment tells us that survived cyanobacterial cells have transferred to a normal physiological state, while the absolute intensity of the PC and the CHL signal gives us the information on the remaining concentration of cyanobacterial cells. The information of the remained cell concentration is the basis for the further decision upon the necessity of a repetition of the treatment to maintain the population of cyanobacteria on the environmentally acceptable level.
The results showed that under the given settings of the electrolytic cell operation, the concentration of cyanobacterial cells gradually declines, which was followed by a gradual release of intracellular microcystins re flected in the increase of the total cyanotoxins measured in the sample. The concentration of the total cyanotoxins was, though,lower as it would be in the case when the cyanobacterial control would not be implemented, what was evident from the control samples. However, the noticed beginning increase in the total cyanotoxins 24 h after the treatment indicates the possibility that the electrochemical treatment can stimulate the cells to form cyanotoxins. Further tests are therefore necessary to examine the response of cyanobacteria or their cyanotoxins synthesis in the case of lower intensities of electrolytic cell operation when the cyanobacterial cells are subjected to stress and damages only to the level where the cellular repair mechanisms can prevent cell death. Tests on cyanobacterial populations from the natural environment are planned as a follow-up, including testing different settings (current density, flow rate) of the electrolytic cells operation with larger surfaces and working volumes to achieve minimum energy consumption while obtaining optimum results in cyanobacterial growth control.
6 ACKNOWLEDGEMENT
The authors are grateful to the Engineering team of Arhel d.o.o., Gorazd Lakovič and Marko Gerl, for the development and assistance in the use of sensor equipment and an electrolytic cell.
 Journal of Oceanology and Limnology2018年4期
- Journal of Oceanology and Limnology的其它文章
- Editorial Statement
- Recent insights into physiological responses to nutrients by the cylindrospermopsin producing cyanobacterium,Cylindrospermopsis raciborskii*
- Response of Microcystis aeruginosa FACHB-905 to different nutrient ratios and changes in phosphorus chemistry*
- In fluence of light availability on the speci fic density, size and sinking loss of Anabaena flos- aquae and Scenedesmus obliquus*
- Application of first order rate kinetics to explain changes in bloom toxicity—the importance of understanding cell toxin quotas*
- Regime shift in Lake Dianchi (China) during the last 50 years*
