Flow structure at the downstream of a one-line riparian emergent tree along the floodplain edge in a compound open-channel flow *
Ayse Yuksel Ozan
Civil Engineering Department, Engineering Faculty, Adnan Menderes University, Aydın, Turkey
Introduction
Compound open-channel flows are characterized by complicated flow structures due to the presence of a shear layer at the junction between the main channel and the floodplain[1]. The shear layer generated by the velocity difference between the main channel and floodplain flows, results in vortices in a streamwise direction as well as the vertical direction[1]. However in nature, most floodplains are vegetated, thus rendering the flow structures more complicated[1]. There has been a lot of experimental and numerical studies about vegetation in open-channel and compound open-channel flows recently such as Refs. [2-8].
Wang et. al.[9]performed a review study about the vegetation and its effect on the water flow and sediment transport. They emphasize that the vegetation characteristics, such as the shape, the flexibility and the height, have significant effects on the flow structure. Moreover, they stated that the density and the arrangement of the vegetation influence the flow velocity in varying degrees and the flow resistance increases with the increase of the plant density. As a result, they represent the importance of the optimum planting density of the vegetation to keep a balance between the flood discharge capacity and a healthy environment.
Huang et al.[10]studied on the flow structure for a compound channel with the vegetated floodplain experimentally. They obtained that velocity in the main channel increased significantly after the floodplain is covered with vegetation. Sun and Shiono[11]investigated the flow resistance of one-line emergent vegetation along the floodplain edge of a compound channel and used rigid rods to simulate trees along the edge of floodplain. They obtained that the structure of the flow is totally different from no vegetation case and the boundary shear stress is significantly reduced by the additional flow resistance caused by the vegetation.
White and Nepf[12]performed an experimental study on the shear instability in a shallow open channel partially filled with a model porous layer of circular rigid cylinders. They discovered that largescale coherent vortices were formed between the non-vegetated and vegetated domains, and the momentum exchange which enhanced the intensities of the secondary flows was increased rapidly at the vegetation edge.
Zong and Nepf[13]studied the turbulent wake behind a two-dimensional porous obstruction, consisting of a circular array of cylinders in an open channel flow. They found that the wake behind a porous body has two unique features compared with the wake behind a solid body. First, the length of the steady wake region increases as porosity decreases and second, the formation of the von Karman street is delayed until the end of steady wake. Chen et. al.[14]also studied on the mean and turbulent flow structure in the wake of a circular array of cylinders, which is a model for a patch of emergent vegetation. They found that the velocity exiting the patch,eU, is reduced relative to the upstream velocity, U∞and Ue/U∞decreases as flow blockage increases. Moreover, they obtained two peaks in turbulence intensity at the wake behind the patch. The first peak occurs directly behind the patch and is related to turbulence production within the patch at the scale of individual cylinders.The second peak in turbulent intensity occurs at distancewL, which is called wake formation length,downstream from the patch and is related to the wake-scale vortices of the von Karman street.
Gurnell et. al.[15]reviews knowledge on the hydrogeomorphological significance of riparian and aquatic vegetation with a particular emphasis on humid temperate, mixed load, gravel bed, floodplain rivers. They stated that the fluvial riparian and aquatic patch mosaic varies along rivers according to geomorphological setting, hydrological regime, sediment supply and surface–groundwater connectivity. This relation between physical processes and plants is not unidirectional. Once established, riparian and aquatic plants frequently act as physical ecosystem engineers by trapping and stabilizing sediments, organic matter and the propagules of other plant species, modifying the local sedimentary and morphological environment by driving the development of landforms and associated habitats, and so facilitating the rapid establishment of other plants that can in turn reinforce the development of landforms such as river banks,vegetated islands and floodplains[15].
Vegetation such as trees and shrubs commonly occurs along the river banks and the edges of floodplain[11]. Trees vegetated in rivers have important functions which are reducing flow, regulating streamlines and protect shoreline against erosion[16]. The effect of vegetation on the hydrodynamics of openchannel flows was investigated generally with artificial vegetation elements such as rigid rods since they are easy to be analyzed as comparing with other flexible vegetation in the studies. There are some studies[17-18]about the effect of natural type vegetation which is tree in an open-channel. For the compound channels, the flow structure in a vegetated floodplain studied generally considering rigid stems with partly vegetated floodplain[16]and rigid stems with fully vegetated floodplain[10].
Moreover, the most studies about the flow structure along the cross-section of the channel defines the flow structure within the vegetation layer[19]. However, the effects of vegetation layer over the channel is not limited with vegetated part. The vegetation layer also affects the flow along its downstream. The downstream flow structure of a natural type vegetation layer, especially at a compound channel, has gained little attention in the literature. Addition to this, Sun and Shiono[11]emphasize that choosing vegetation spacing when the vegetation is planted at the edge of floodplain for bank protection is very important for flood risk management. Therefore, investigation of the effects of tree spacing becomes very important for river management.
Compound open channel flow with emergent vegetation appears especially at rainy seasons due to flood conditions. Streamwise velocity profile along and cross-section of the compound channel is the main hydraulic parameter for detailed examination of vegetation drag, channel capacity, sediment and pollutant transport. These parameters are key factors to control flood and to design artificial waterways. For the reasons detailed above, the main motivation of this study is that to investigate the flow structure at the downstream of the natural type vegetation along the cross-section of the compound open channel flow with different tree spacing. In this paper, the flow structure at the downstream of a one-line emergent natural tree on the flood plain edge in a compound open-channel flow is investigated. For this purpose, an experimental study were conducted in a rectangular compound open-channel and velocity measurements were performed along the cross-section of the flume at the downstream of the tree line for different tree spacings.
1. Experimental procedure
Measurements were conducted in an 11 m long,1.2 m wide and 7.5×10⁻³m height flume with glass walls and a concrete base in the Civil Engineering Laboratory at Adnan Menderes University (Fig. 1).The flume has an interior re-circulating system providing a steady flow. Figure 1(a) shows the schematic of the experimental set-up where Bm=0.6 m, Bf=0.6 m , B = 1.2 m , h = 0.1m and H =0.25 m. Cupressus Macrocarpa, which can be seen in Fig. 1(c), were used for the natural vegetation along the edge of floodplain. Flow depths were measured by means of a pointer gauge and the turbulence velocity measurements were performed by SONTEK Acoustic Doppler Velocimeter (ADV).

Fig. 1(a) A-A cross-section of the flume

Fig. 1(b) The plan view of the flume where trees planted
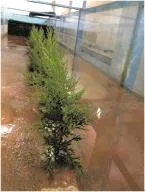
Fig. 1(c) (Color Online) The view from the downstream of the tree line
Cupressus Macrocarpaswere mounted on the floodplain over length of 2.4 m (=2)Bbetween 5.25 m-7.65 m from the beginning of the compound channel.To provide smooth inlet conditions, bricks with 0.6 m length were installed along the cross section of the flume at the entrance of the flume. Trees were installed with two different spacing. The first one is1=0.15mGcorresponds 9 trees(Type 2) where1Gand2Gis the distance between the axis of the trees. The spacing of the trees was selected according to AWWMWG[20]. It is stated that trees are planted at spacings of 3 m-4 m for small trees and 8-10 m for large trees, which are roughly 10-100 times a grown tree diameter depending on a state of trees[20]. The experiments were conducted for no-tree line0()Tand two different tree line arrangements which are Type 11()Tand Type 22()Twith three different discharges and one water depth ( =H0.25 m). Experimental conditions for Case0Tare summarized in Table 1.corresponds 17 trees (Type 1) and second one is2=0.30 mG
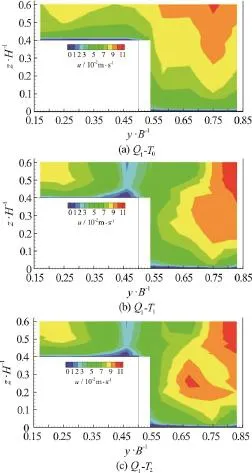
Fig. 2 (Color Online) Contours of streamwise velocity distributions along the measurement cross section for 1Q

Table 1 Summary of experimental conditions for Case 0T
whereQis discharge,udmis depth averaged velocity at the centerline of the main channel for no-tree line case (T0),udfis depth averaged velocity at the center of the floodplain for no-tree line case(T0),Qmis discharge in the main channel,Qfis discharge in the floodplain,Qt(Qm+Qf) is total discharge,Rem(Re=udmH/ν) is Reynolds number for the main channel,Ref(Re=udf H/ν) is Reynolds number for the floodplain. Here,His flow depth and ν is kinematic viscosity. The depth averaged velocity values given in Table 1 were calculated by integrating velocity along the vertical line at the center of the main channel and floodplain.Discharge and Reynolds number values were calculated using calculated depth averaged velocity values.
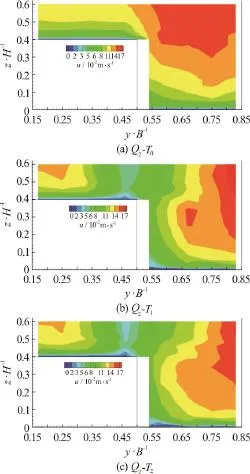
Fig. 3 (Color Online) Contours of streamwise velocity distributions along the measurement cross section for 2Q
The measurement cross-section was set atG1/2=0.075mdownstream of the tree line which corresponds to 7.725 m from the inlet of the flume(Fig. 1(b)). Ten vertical measurement lines, which are 0.2 m (1), 0.3 m (2), 0.4 m (3), 0.5 m (4), 0.55 m (5),0.65 m (6), 0.7 m (7), 0.8 m (8), 0.9 m (9) and 1.0 m(10) in lateral direction, were chosen for the cross-section measurements (Fig. 1(a)). Herein the values in the bracket represent the measurement locations denotedin F ig. 1(a). Vertic al mea surement intervalsbetweentwoverticalpointsvariesbetween 0.005 m and 0.025 m at different flow depths. The velocity measurements were performed during 120 s with 3 000 sampling number at 25 Hz with ADV.
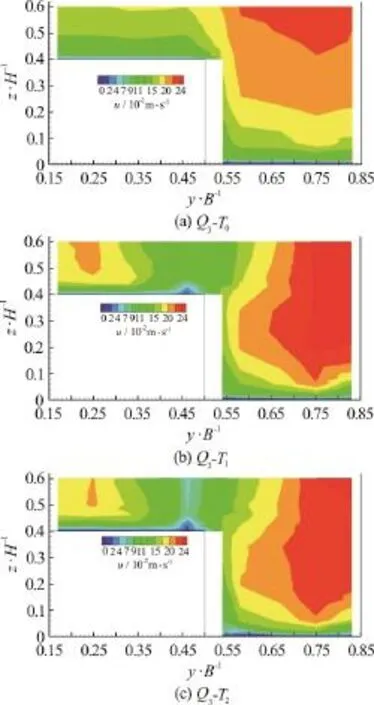
Fig. 4 (Color Online) Contours of streamwise velocity distributions along the measurement cross-section for 3Q
2. Experimental results and discussion
2.1 Isovel distributions of velocity
Figures 2-4 present the contours of streamwise velocity distributions along the measurement crosssection for all cases (T0,T1andT2) and forQ1,Q2andQ3respectively. The bulge in the shear layer between the main channel and floodplain is seen in the figures. This is an essential issue for a deep water depth of compound channel flows. This bulging pattern is similar to those observed by Sun and Shiono[11]. They have explained that this is caused by the secondary currents and the transfer of highmomentum fluid from the main channel to the floodplain. It is obvious that tree line results in velocity decrease close to junction in the main channel and floodplain. But, there is remarkable velocity increase in the main channel and the maximum velocity zone moves towards to main channel wall and floodplain wall which is far from the junction which is same with Sun and Shiono[11]. Sun and Shiono[11]explained that this is caused by the secondary currents and large transverse shear stress due to presence of rigid cylinder array. The presence of a tree line causes more pronounced bulging phenomenon close to the walls of main channel and floodplain. There is an obvious variation in streamwise velocity distribution in lateral direction which causes variation in lateral transfer of streamwise momentum. Moreover, smaller spacing2()Tbetween the trees results in higher velocity close to the channel banks at both floodplain and also main channel. This results emphasize increasing velocity near the channel banks may cause undesirable effect which is additional erosion at the banks of the channel.
2.2 Velocity distributions
Figure 5 shows the normalized streamwise velocity (u/udm) distribution along the vertical lines at different lateral distances along the floodplain (FP)and main channel (MC) for all cases (T0,T1andT2)andQ3. The lines crossing the velocity values of non-vegetat ed case (T0) r epre sent the best fitted logarithmicregressionlinefornon-vegetatedcase(T0) in the figures. The logarithmic lines were obtained by using the law for rough boundaries which is

whereuis streamwise point velocity,u*is local shear velocity, κ is von Karman’s constant,zis distance from the measurement point to the bed,skis the Nikuradse equivalent bed roughness.
Figure 5 represents that the vertical distribution of streamwise velocity for the non-vegetated case fits the logarithmic relationship very well for both main channel and floodplain. However, logarithmic velocity distribution is not valid where the floodplain is vegetated. Streamwise velocity decreases in the vicinity of the tree line because of the blockage effect of vegetation in floodplain. Presence of the floodplain vegetation causes S-shaped streamwise velocity distribution in thef/3Bparts of the floodplain(betweeny/B= 0.33 andy/B= 0.50) and in theBm/3 parts of the main channel (betweeny/B=0.50 andy/B= 0.67) close to the junction. The S-shaped velocity distribution divides the flow area into two parts in the vertical direction. First, the bottom part is affected by channel bed. Second, the upper part is affected both channel bed and tree (vegetation). It can be said that the flow is affected both channel bed and vegetation induced drag in this type of (emergent one-line tree vegetation) flows. Higher velocity occurs generally at Case1Tcomparing to Case2Texcept the upper part of S-shaped velocity distribution close to junction in the main channel. This is because of the higher drag force occurred in the denser tree line.
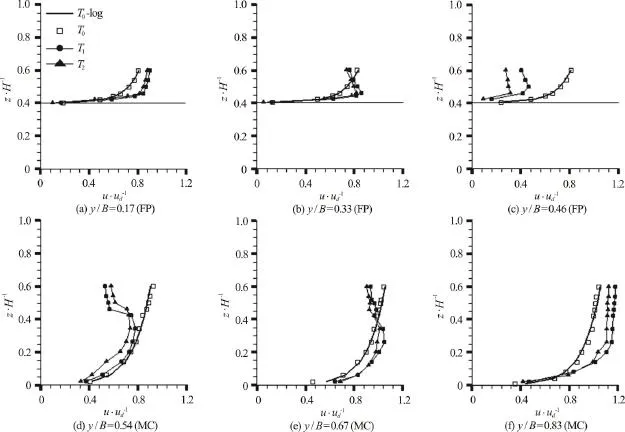
Fig. 5 Normalized streamwise velocity (u/ u d m) distributions along the vertical lines for all cases and Q 3
Yang et al.[19]studied on the flow patterns in a compound channel with vegetated floodplains. They used artificial submerged vegetation in the experiments and obtained S-shaped velocity distribution on the floodplain. Yagci et al.[17]studied on the role of different forms of single natural emergent vegetation elements on kinetic energy characteristics and the flow structure in open channel flow. They carried out the experiments for both forms of “erect” and“compressed” vegetation and found that the form of“erect” has greater retaining influence on time-averaged mean velocity characteristics than “compressed”form. They also defined two major zones which are“dead zone” and “sub-canopy” zone at the downstream of the vegetation. Sub-canopy flow region corresponds to the velocity field with the highest values.
Figure 6 shows the depth-averaged streamwise velocity profiles for all cases (0T,1Tand2T) and discharges. The presence of tree causes velocity decrease in the vicinity of the tree and the velocity values increases at the outer region of the tree line.This is because of the blockage effect of the vegetation which causes strong shear layer at the outer region of the tree line along the cross section over the streamwise direction. This strong shear layer starts atBm/2 (y/B= 0.75) andBf/2 (y/B= 0.25) distances from the junction at both main channel and also floodplain forQ1and extends to 2Bm/3 (y/B=0.67) and 2Bf/3 (y/B= 0.33) for main channel and floodplain respectively. The magnitude of the streamwise velocity close to the main channel wall is higher in1Tthan2T. This is because of the denser tree line causes stronger shear layer. This is because of the higher Reynolds stresses and turbulence intensities occurred in the higher vegetation density.
2.3 Turbulence intensities
Figure 7 presents streamwise turbulence intensity(rmsu) profiles along the cross section atz/H=0.6 for all cases (T0,T1andT2) and discharges.Turbulence intensity in the streamwise direction was obtained by calculating the root mean square (rms) of the fluctuating velocities

Fig. 6 Depth-averaged streamwise velocity distributions along the cross section

It is obtained that there are two maximum turbulence intensity regions. First one is located at the boundary between floodplain and main channel for no tree-line case (T0). It is clear that the turbulence intensity increases at the junction of the main channel and floodplain. Second one is located at the edge of the tree line on the floodplain for the vegetated cases(T1,T2). Turbulence intensity increases dramatically at the edge of the tree and maximum turbulence intensity occurs in the vicinity of tree at the downstream of the tree line. The presence of the floodplain vegetation increases turbulence intensity along the cross-section. Furthermore, it increases turbulence intensity dramatically causing highest values at the vicinity of the tree on the floodplain. It is obtained that rmsuvalue increases in general with the denser tree line1()Tbecause of the higher drag force occurred in the denser tree line.
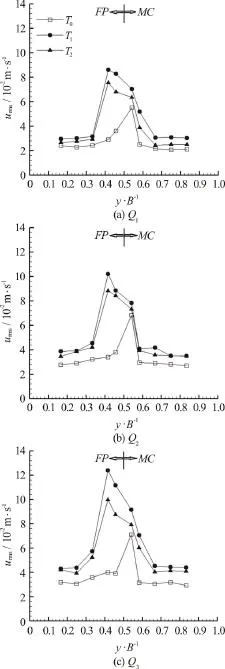
Fig. 7 Streamwise turbulence intensity (rmsu) profiles along the cross section at z/ H =0.6
2.4 Statistical analysis of raw data
Figure 8 illustrates the histogram of streamwise velocity distributions for 3 000 sampling number aty/B= 0.25 forQ3and all cases (T0,T1andT2).It is clearly seen that the peak of the histogram decreases and the base of the histogram widened for tree line cases (T1,T2) comparing to no-tree line case(T0). Decreasing peak and wider plane histogram show the turbulence obviously increases as a results of the presence of the tree line (vegetation). Skewness factors ofuare obtained such as -0.030, -0.008 and-0.080 forT0,T1andT2respectively. The values of the skewness factors close to zero which means that the velocity distribution is Gaussian with a symmetric probability density distribution.
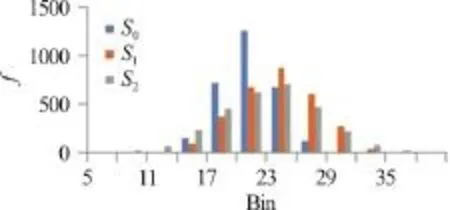
Fig. 8 (Color Online)Histogram ofstreamwise velocity (u)distributions at z/ H = 0.6 and y/ B = 0.25 for Q 3
2.5 Temporal variation of fluctuating velocities
In this study, time series of streamwise velocity distribution at different lateral directions and different discharges were also evaluated to examine the periodic flow at the downstream of the tree line.Figures 9-11 present the time series of streamwise velocity distributions aty/B= 0.25,y/B=0.58 andy/B= 0.75 respectively forz/H=0.6 during 30 s forQ3. It is obtained that the time series of streamwise velocity distribution show similar behavior over the floodplain. Therefore, only one distribution aty/B= 0.25 which corresponds to the center of the floodplain is given here (Fig. 9). However, the time series of streamwise velocity distribution show different behavior over the main channel. Its behavior different atBm/3 (0.50 ≤y/B≤0.67) part close to the junction from the part which is 2Bm/3 (0.67≤y/B≤ 1 .00) in the main channel. The oscillation period is present atBm/3 part close to the junction where it is not present at 2Bm/3 part. Because of this, two distributions which are aty/B= 0.58 and at the center of the main channel (y/B= 0.75) were presented here (Figs. 10, 11).
Additionally, the time series of streamwise velocity distribution aty/B= 0.25 andz/H=0.6 forQ2, andQ1are presented in Figs. 12, 13 respectively. The time series show the periodic and stochastic nature of streamwise fluctuating velocity.The obvious result is th at there i s os cillati on in the time series of streamwisevelocityforbothtreeline cases (1T,2T) where there is no oscillation in nonvegetated case0()T. This oscillation occurs because of the vortex shedding of the vegetation at the downstream of the tree line on the floodplain.

Fig. 9 Time series of streamwise velocity distribution at z/ H = 0.6 and y/ B = 0.25 for Q 3
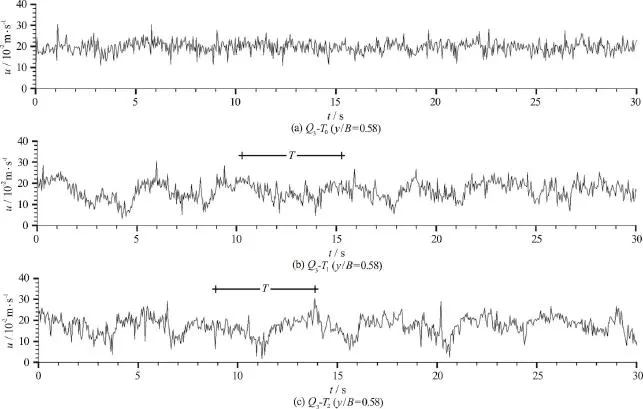
Fig. 10 Time series of streamwise velocity distribution at z/ H = 0.6 and y/ B = 0.25 for Q 3

Fig. 11 Time series of streamwise velocity distributions at z/ H = 0.6 and y/ B = 0.75 for Q 3

Fig. 12 Time series of streamwise velocity distributions at z/ H = 0.6 and y/ B = 0.25 for Q 2

Fig. 13 Time series of streamwise velocity distributions at z/ H = 0.6 and y/ B = 0.25 for Q 1

Table 2 Oscillation periods ()T for different type of tree lines
The approximate oscillation periods are presented in Table 2. When we compare the oscillations in floodplain and main channel, it is seen that the streamwise velocity oscillates strongly everywhere on the floodplain where they oscillates atBm/3(0.50 ≤y/B≤0.67) part close to the junction in the main channel for both tree line cases (T1,T2). In the table, the results are only presented fory/B=0.54 andy/B= 0.58 since there is almost no oscillation aty/B= 0.67. It can be clearly seen at Fig. 13 which presents the time series of streamwise velocity distribution aty/B= 0.75. It is obvious that there is no oscillation at this lateral position in the main channel. It is obtain that the oscillation at the downstream of the tree line was not affected by the different spacing of the tree line. Apart from this, time series of streamwise velocity distribution shows similar behavior for different discharges. But, the oscillation period increases with increasing discharge over the compound channel. Additionally, oscillation period in the floodplain is higher than the period in the main channel. Ghisalberti and Nepf[21] defines that the vortex street generated in flows with submerged vegetation results in strongly periodic flow and transport. They found that streamwise velocity within a canopy oscillating at the vortex passage frequency of between 0.01 Hz and 0.11 Hz for a submerged flexible artificial vegetation.
Higher oscillation period in the floodplain and the presence of oscillation over the floodplain shows that the wake region caused by tree layer affects whole floodplain which is different from the main channel. This means the presence of a tree line on the floodplain near the main channel results in stronger three-dimensional flow in the floodplain during the flood conditions. This tree dimensional flow field affects the fluvial ecology such as sediment and pollutant transport etc..
3. Conclusions
Based on the experimental data, the flow structure at the downstream of a one-line emergent tree line along the floodplain edge in a compound openchannel is investigated in this paper. For this purpose,natural type vegetation (Cupressus Macrocarpa) is used. In general, it is found that the presence of a tree line at the edge of the floodplain significantly changes the flow structure in the compound channel.
Tree line decreases the velocity in the vicinity of the tree while it results in velocity increase at the rest of the compound channel. Additionally, maximum velocity zone moves to the floodplain wall and the main channel wall. Moreover, denser tree line causes higher velocity in the main channel because of the higher drag force occurred in the denser tree line. This result is very important for the river management since higher velocity can cause higher erosion at river banks. Because of this the space between the trees should be arranged properly to decrease erosion problems at flood conditions. The emergent tree line leads to S shaped velocity profile in the compound channel close to the junction and as a result it divides flow area into two parts in vertical direction.
Turbulence increases dramatically with tree line and occurs peak at the edge of the tree line.Furthermore, denser tree line causes higher turbulence in the flow.
Strong oscillation period is obtained in the flow caused by tree line. This oscillation is present everywhere in the floodplain and present at almostBm/3 part of the main channel which is close to junction. Additionally, the oscillation period is higher in the floodplain than the main channel and the oscillation period increases with increasing discharge.
Acknowledgements
The author would like to acknowledge the funding of the research project (MF14010) from Adnan Menderes University which allows establishing the experiment flume in the laboratory. The author also thank to Dr. Didem Yilmazer from Namik Kemal University who provides ADV for the velocity measurements.
[1] Kang H., Choi S. Turbulence modeling of compound open-channel flows with and without vegetation on the floodplain using the Reynolds stress model [J].Advances in Water Resources, 2006, 29(11): 1650-1664.
[2] Nepf H. M., Vinoni E. R. Flow structure in depth-limited,vegetated flow [J].Journal of Geophysical Research, 2000,105(C12): 28547-28557.
[3] Zhang M., Li C. W., Shen Y. Depth-averaged modeling of free surface flows in open channels with emerged and submerged vegetation [J].Applied Mathematical Modelling, 2013, 37(1): 540-553.
[4] Huai W., Wang W., Hu Y. et al. Analytical model of the mean velocity distribution in an open channel with double-layered rigid vegetation [J].Advances in Water Resources, 2014, 69(4): 106-113.
[5] Li Y., Wang Y., Anim D. O. et al. Flow characteristics in different densities of submerged flexible vegetation from an open-channel flume study of artificial plants [J].Geomorphology, 2014, 204(1): 314-324.
[6] Shan Y. Q., Liu C., Luo M. K. et al. A simple method for estimating bed shear stress in smooth and vegetated compound channels [J].Journal of Hydrodynamics, 2016,28(3): 497-505.
[7] Rao L., Wang P. F., Lei Y. et al. Coupling of the flow field and the purification efficiency in root system region of ecological floating bed under different hydrodynamic conditions [J].Journal of Hydrodynamics, 2016, 28(6):1049-1057.
[8] Li C., Xue W., Huai W. Effect of vegetation on flow structure and dispersion in strongly curved channels [J].Journal of Hydrodynamics, 2015, 27(2): 286-291.
[9] Wang C., Zheng S. S., Wang P. F. et al. Interactions between vegetation, water flow and sediment transport: A review [J].Journal of Hydrodynamics, 2015, 27(1): 24-37.
[10] Huang B. S., Lai G. W., Qiu J. et al. Hydraulics of compound channel with vegetated floodplains [J].Journal of Hydrodynamics, Ser. B, 2002, 14(1): 23-28.
[11] Sun X., Shiono K. Flow resistance of one-line emergent vegetation along the floodplain edge of a compound open channel [J].Advances in Water Resources, 2009, 32(3):430-438.
[12] White B. L., Nepf H. M. Shear Instability and coherent structures in shallow flow adjacent to a porous layer [J].Journal of Fluid Mechanics, 2007, 593: 1-32.
[13] Zong L., Nepf H. Vortex development behind a finite porous obstruction in a channel [J].Journal of Fluid Mechanics, 2012, 691: 368-391.
[14] Chen Z., Ortiz A., Zong L. et al. The wake structure behind a porous obstruction and its implications for deposition near a finite patch of emergent vegetation [J].Water Resources Research, 2012, 48(9): W09517.
[15] Gurnell A. M., Bertoldi W., Corenblit D. Changing river channels: The roles of hydrological processes, plants and pioneer fluvial landforms in humid temperate, mixed load,gravel bed rivers [J].Earth-Science Reviews, 2012,111(1-2): 129-141.
[16] Uotani T., Kanda K., Michioku K. Experimental and numerical study on hydrodynamics of riparian vegetation [J].Journal of Hydrodynamics, 2014, 26(5): 796-806.
[17] Yagci O., Tschiesche U., Kabdasli M. S. The role of different forms of natural riparian vegetation on turbulence and kinetic energy characteristics [J].Advances in water Resources, 2010, 33(5): 601-614.
[18] Wilson C. A. M. E., Xavier P., Schoneoom T. et al. The hydrodynamic drag of full scale trees [C].Proceedings of the International Conference on Fluvial Hydraulics, River flow 2010, Braunschweig, Germany, 2010, 453-460.
[19] Yang K., CAO S., Knight D. W. Flow patterns in compound channels with vegetated floodplains [J].Journal of Hydraulic Engineering, 2007, 133(2): 148-159.
[20] Albury/Wodonga Willow Management Working Group(AWWMWG). Watercourse revegetation using indigenous plants [R]. Landcare Note Series, 1998, TG0020.
[21] Ghisalberti M., Nepf H. M. Mixing Layers and coherent structures in vegetated aquatic flows [J].Journal of Geophysical Research, 2002, 107(C2): ID3011.
- 水动力学研究与进展 B辑的其它文章
- Numerical simulation of wave-current interaction using the SPH method *
- The coupling between hydrodynamic and purification efficiencies of ecological porous spur-dike in field drainage ditch *
- Simulation of violent free surface flow by AMR method *
- Experimental research on kinematics of breaking waves *
- Fundamental problems in hydrodynamics of ellipsoidal forms *
- Case study on wave-current interaction and its effects on ship navigation *

