New Islanding Detection Method with Better Performance in Presence of Non-resistive Load
Fang Jun-long, Wang Ji, Zou Shi-qi, Sun Xiao-yong, Zhou Yang, Yang Yu-qi, Feng Chong-yang, and Li Xiang-yun
College of Electrical and Information, Northeast Agricultural University, Harbin 150030, China
Introduction
Islanding detection is one of the most important problems for common grid-connected photovoltaic(PV) agriculture power systems. Islanding occurs when the distributed PV power generation unit is isolated from the utility but, it continues running and powers the local load. This situation may endanger the devices inside the island and be hazardous to workers operating on the lines. Therefore, islanding detection is crucial for the safe operation of grid-connected PV power systems (Chenet al., 2013; Maet al., 2013).
Passive islanding detection methods monitor parameters, such as voltage or frequency at the output of the inverter to determine if islanding has occurred.These methods are simple and inexpensive, and they neither require installation of additional equipments nor degrade the quality of the power they deliver(Gonget al., 2013). However, the non-detection zone(NDZ) may be large, when the power output of PV unit happens to be in balance with the load, in which case islanding will not be effectively detected. Passive methods include over-voltage protection (OVP), undervoltage protection (UVP), over-frequency protection(OFP), under-frequency protection (UFP), harmonic detection (HD), phase jump detection (PJD), etc.
Active islanding detection methods inject an intentional perturbation to the output of the inverter and then monitor if the corresponding parameter of the inverter changes accordingly. The advantage is that NDZ is effectively reduced, but the control is relatively complex and affects the quality of the electrical energy more or less. Active methods mainly include voltage shift, power shift, frequency drift, phase shift, etc (Liet al., 2015; Zhouet al., 2013). Among these methods,active frequency drift (AFD) is a common detection method widely used nowadays.
Methods
Islanding detection methods resident in the inverter could be classified as either passive or active (Liuet al., 2010; Cao and Tian, 2011).
Fig. 1 showed the waveform of the current injected by the inverter in a typical AFD (Yang and Jin, 2013).The inverter periodically perturbed the output currentIinvby inserting a dead timetz, and the frequency at the PCC was constantly monitored. When the utility was disconnected, the continuous injection of this signal would quickly alter the frequency at PCC and trigger OVF, thus alarming the occurrence of islanding. The intensity of the perturbation signal was characterized by the chopping fraction (cf), which was expressed as:Where,Tgwas the period of the utility voltage at PCC (Luet al.., 2006; Zhanget al., 2007).
Fig. 2 illustrated how AFD worked. Here,fgwas the frequency of the voltage at PCC,finvwas the frequency of the current injected by the inverter, and Δfwas the perturbation to the frequency.

Fig. 1 Islanding detection by active frequency drift (AFD)
AFD was a practical method that was easy to implement. It also effectively prevented the persistence of islanding for purely resistive load. However,degradation to the quality of the output power could not be avoided. Besides, it might cause radio frequency interference and lead to anomalies in the frequency of the grid system. These problems reduced the effectiveness of AFD in islanding detection (Liuet al., 2008; Cao and Tian, 2010).
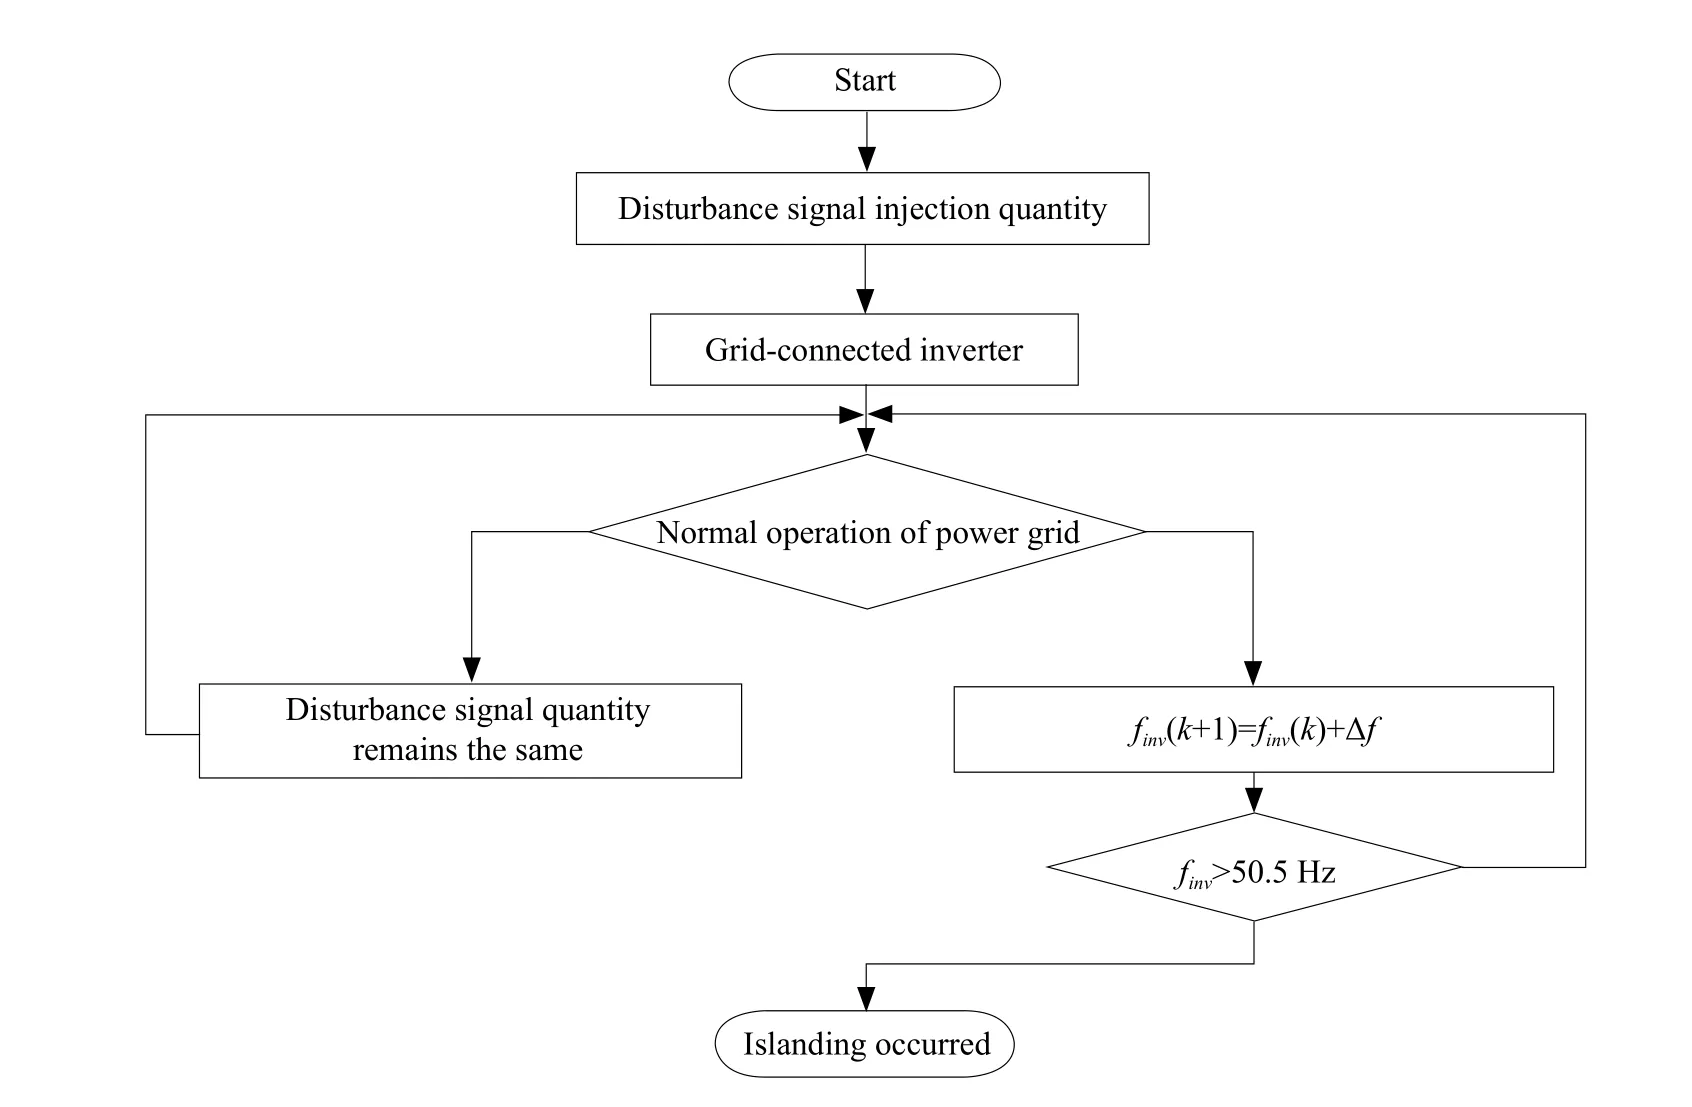
Fig. 2 Flowchart of AFD
Improvement to AFD in Islanding Detection
The perturbation signal in AFD drifted the output current of the inverter in the same direction. Therefore,when the load was purely resistive, islanding could be successfully determined by reading the voltage at PCC.However, for capacitive or inductive load, the voltage at PCC might not be in phase with the perturbation signal. The impedance from the load might offset the signal, which might then delay or even frustrate the detection (Chenet al., 2013; Zhenget al., 2005).Besides, AFD might also identify a false islanding, due to fluctuation in the grid and then wrongly disengage PV system from the grid.
Here, an improved AFD method was proposed to take into account the load characteristics. Islanding was identified, when OVP/UVP was noticed by the detection method.
Consideration of load characteristics
The power output of the inverter must meet the quality requirement of the grid, i.e., the harmonic waveform of the current must have acfthat did not exceed ±5%(Liet al., 2015). To make sure the perturbation signal would not be offset by inductive or capacitive load,alternating signals were applied (cf1=5%,cf2=-5%)at different times and then the resulting changes(Δf1and Δf2) in the voltage frequency at PCC were measured. Subsequent perturbations were further applied to the same direction that gave greater voltage shift in the initial period. In this way, the voltage frequency at PCC was drifted more rapidly and the impact from load characteristics was reduced, and the detection was improved. Fig. 3 showed the flowchart of the method.
Accurate measurement of frequency
Frequency must be measured accurately in AFD to ensure correct detection of islanding (He and Zhao,2013; Yanget al., 2016). However, the stability of frequency might be interfered, giving false alarms that triggered wrongful disconnections. In conventional AFD, a noise was created when the output current from the inverter stayed at zero during the dead timetz(Liu and You, 2011; Zhanget al., 2012). In the following,a three-point method was proposed to determine frequency, which was more accurate and was not affected by noise.

Fig. 3 Islanding detection for non-resistive load
Principles of three-point frequency measurement
The unperturbed voltage at PCC could be expressed as the following:

In which,ω=2πfandfwas the real frequency ofs(t).
Samples(t) at a frequency offs. Then, the consecutive samples collected could be expressed as the followings:
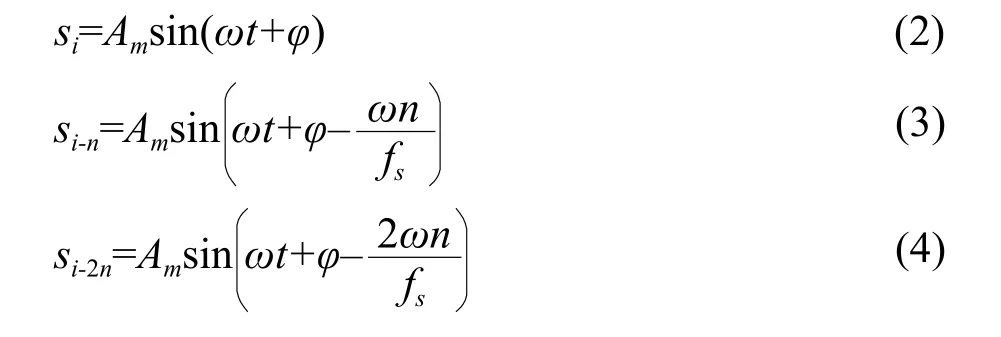
Where,siwasithsample,ncould range over all the integers, andn/fswas the period at the corresponding point. It could be inferred from (2) to (4) that:

Therefore, the angular frequencyωofs(t) at PCC was

The frequencyfofs(t) at PCC could then be expressed as:

Eq. (7) was valid only, whensi-n≠0. If a sample set gavesi-n≠0, it was discarded and the next sample set was used to calculatefofs(t) at PCC.
Source of error in of three-point frequency measurement
Assuming the frequency ofs(t) at PCC was as a functionf=y(x). When an errorred of ∆xoccurred inx,fwould be affected accordingly to result in an error of ∆f. Therefore, the first derivative offcould be approximated as:

That was,

Wrote Eq. (7) alternatively as

Selection of optimal sampling interval
As the above stated, an appropriate sampling interval was crucial for the accuracy of the three-point frequency measurement. For grid-connected PV power systems, the voltage frequency at PCC must comply with GB/T19939-2005, that was,f=50±0.5 Hz.
Assuming the arccosine function had a range in [0,π], (10) then became:

Furthermore, becausef=50±0.5 Hz andn≥1, the range ofnbecame:

In which, the upper limit ofnwas floored to the nearest integer.
According to the range ofnin (14), (12) could be simplified to
模型中黑色部分为谐振杆与耦合筋;黄色部分为调谐螺杆与耦合螺杆;棕色部分为实现容性耦合的飞杆;绿色部分为低通模块。同样通过HFSS与Designer的协同仿真,协同方法参照文献[10],最终确定全腔尺寸大小,相应的双路滤波器实物如图7所示,其中左图为腔体内部结构图,右图为组装并调试好的成品图。

It had been found whenfcomplied with the requirement in GB/T19939-2005 (i.e.,f=50±0.5 Hz),setting a sampling frequency offi=3.2 kHz, then gave the range ofnas 1<n<31. Asnincreased,f'firstly decreased rapidly and then increased slowly. Therefore,to determine the minimumf ', it could be assumede(n)=nsin(2πnf/fs), and the maximum ofe(n) would then be the minimum off '. Iteration by the Newton-Raphson method then gave the optimal values as shown in Table 1.

Table 1 Optimal value comparison
For all the possible voltage frequency values at PCC(i.e.,f=50±0.5 Hz),e(n) had a maximum, whenn=20.Therefore, the optimal sampling interval was set ton=20.
Removal of frequency outlier
Removing outliers in the sampling series could help further improve the accuracy of the three-point frequency measurement. Assumingfiandfi-1were the measured frequency at PCC forsiandsi-1, respectively.The sampledfiwas removed when

Where,Thwas the threshold to determine the outlier, usually set toTh=0.05 Hz.
Simulation
Using MATLAB/Simulink, a single phase grid-connected PV power system was simulated (2 kW, 220 V)to validate and evaluate the proposed islanding detection method. Fig. 4 showed the simulation scheme,and Fig. 5 showed the encapsulated islanding detection module. The Universal Bridge represented the currentsource grid-connected inverter, S-Function1 was the proposed AFD-based islanding detection that tolerated non-resistive load, and S-Function2 was the antiinterference frequency measurement module. A local parallel RLC circuit was built to simulate most problems that occurred during islanding detection. AC represented the utility, and the Step module regulated the control system that activated the breaker, when islanding occurred. The utility had a voltage and frequency of 220 V and 50 Hz. In order to simulate the worst islanding scenario specified in IEEE Std.929-2000 and confirm the successful detection of over/under voltage, RLC load was adjusted to render the maximal and minimal power mismatch between the load and PV system (i.e., quality factor approximated 2.5). The resonance frequency was 50 Hz.The initial chopping factor was set tocf=0.05, while maintaining the total harmonic distortion (THD) of the inverter output. The principle was complied with the GB/T15945-1995 standard on permissible deviation of frequency for power system. The threshold of OVP/OFP was set to 50±0.5 Hz.

Fig. 4 Simulation scheme
The utility was disconnected att=0.06 s. Fig. 6 showed the simulation results. Fig. 6(a) showed the current and voltage waveforms of the passive detection in the presence of power mismatch. Fig. 6(b) and Fig. 6(c) showed the waveforms of the active detection for capacitive and inductive loads, when passive detection failed. It could be seen that frequency shifted in the same direction for inductive and capacitive loads. According to the anti-interference module, the frequency of the output was not overly disturbed by the sudden disconnection of the utility. The inverter stopped feeding current after islanding occurred, and the voltage at PCC gradually decayed to zero after oscillation.

Fig. 5 Islanding detection module

Fig. 6(a) Simulation waveforms of passive detection

Fig. 6(b) Simulation waveforms of active detection for capacitive load
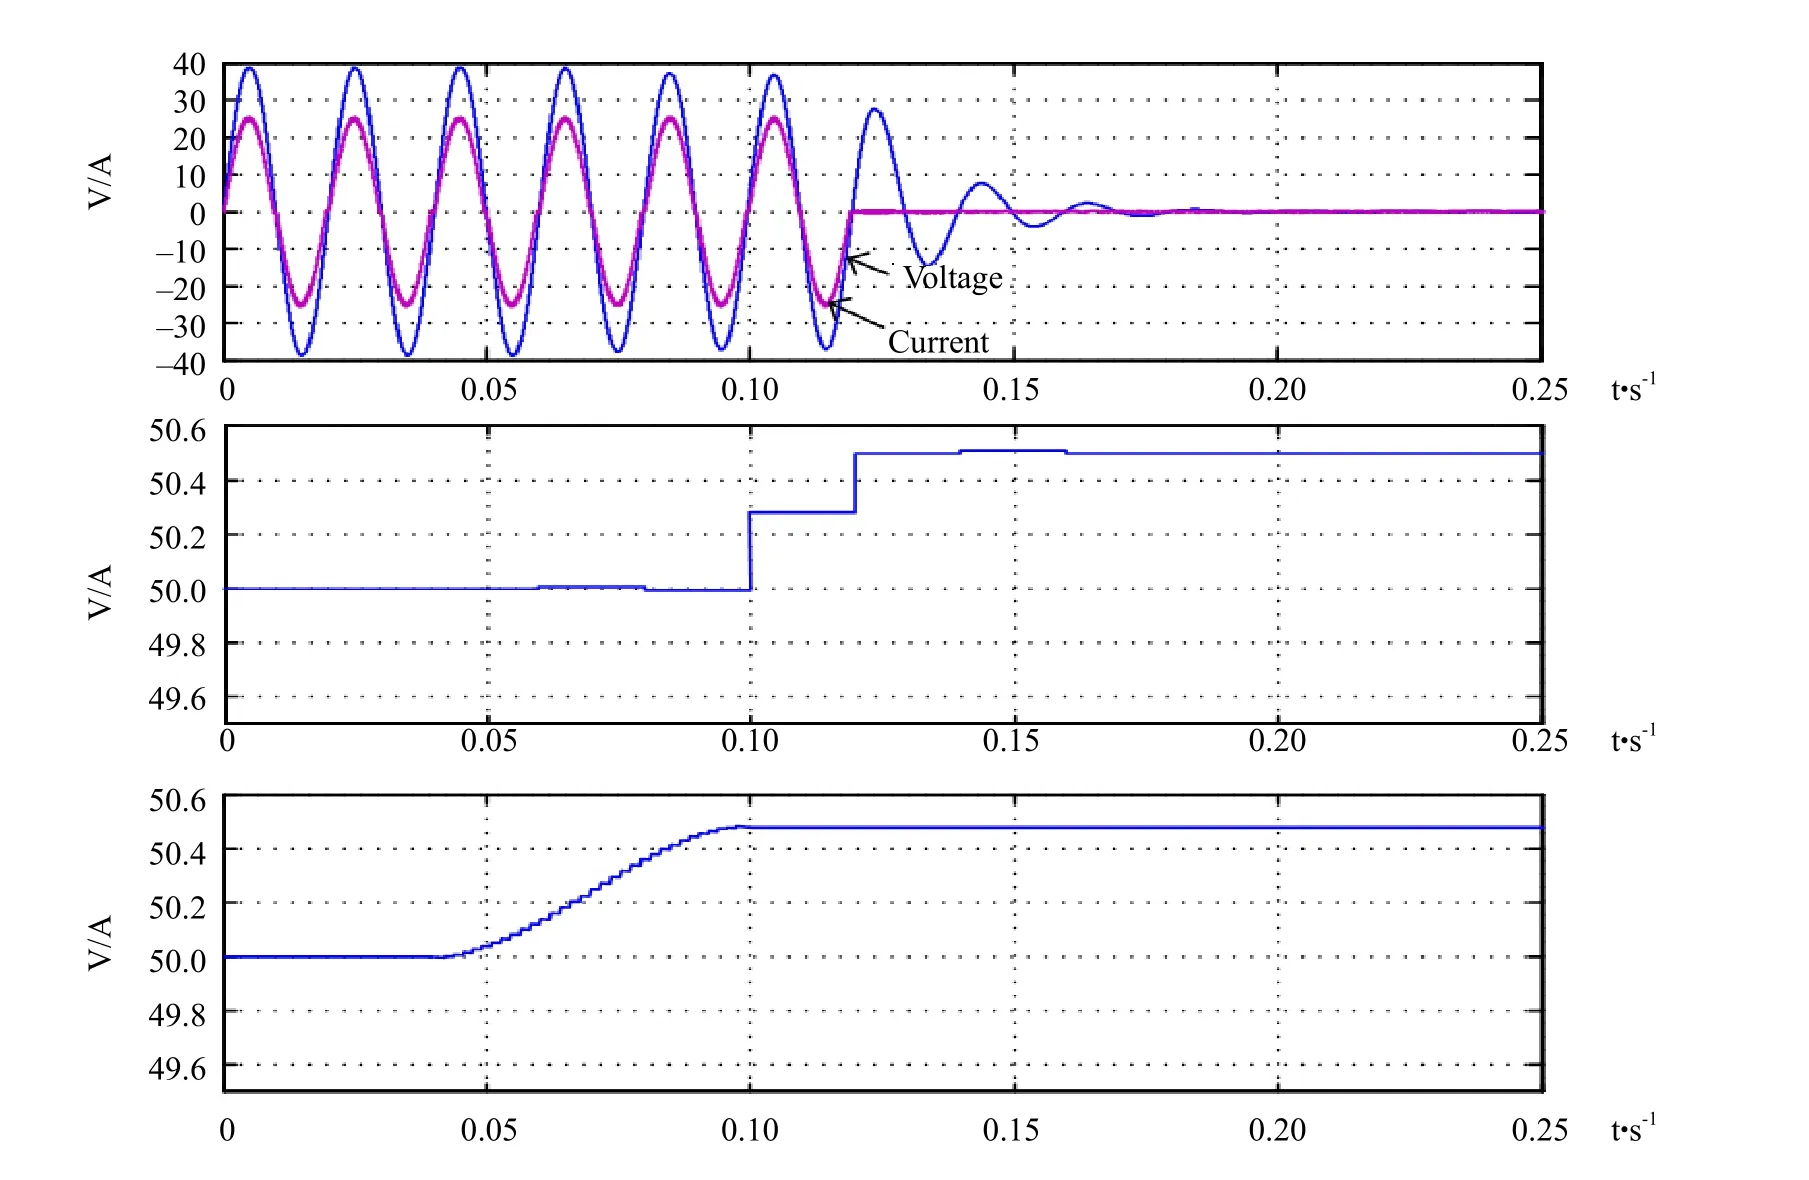
Fig. 6(c) Simulation waveforms of active detection for inductive load
Validation
Hardware architecture
Fig. 7 showed the hardware architecture of the designed system, whose components mainly included PV array, Boost converter, H-bridge inverter, output LC filter, grid relay, DSP controller, AC-DC sampler,grid isolation drive circuit, auxiliary power circuit, etc.The one-way DC-DC converter was located between PV array and DC bus, which consisted of Boost circuits and tracked the maximum power point of the PV cells.
H-bridge inverter circuit was located between DC bus and grid. The current transformer sampled the voltage and current of PV cells and the grid, as well as the voltage of DC bus. The signal conditioning circuit received the data and delivered the signal to TMS320F28335 processor. The processor then controlled the system accordingly.
The voltage transformer used a QBV10/25A Hall effect voltage sensor with insulation between the primary and the secondary. It had a turns ratio of 2 500 : 1 000 and could measure AC-DC voltage signal. The current transformer used a QBC100BS Hall effect current sensor. It had a turns ratio of 1 : 1 000 and could measure AC-DC current signal.The signal conditioning circuit consisted of a currentvoltage conversion circuit, a filter circuit and a proportional circuit. The current signal of the transformer was converted into the voltage signal by the current-voltage conversion circuit. The voltage signal was filtered and trimmed by the proportional circuit to within therange of permitted input of the analog-todigital converter. The analog-to-digital converter was a 16-bit 8-channel simultaneous sampling AD converter(Analog Devices Inc., MA, USA). This converter operated with a single 5 V power supply, accepts±10 V true bipolar analog input, and communicated through high-speed SPI and DSP. The digital signal processor was a TMS320F28335 32-bit floating point DSP processor (Texas Instruments Inc., TX,USA). It had a high processing capability of 150 MHz with rich resources, including a 32-bit floating point processing unit, a 6-channel DMA processor,16-bit and 32-bit external interface (XINTF), 18 pulse width modulation (PWM), six inputs of event capture and eight 32-bit timers. Specifically, EPWM6B pin on PWM piped to CVA and CVB pins of AD7606 and triggered AD7606. SPICLKA, SPISIMOA, SPISTEA and SPISOMIA were piped to SPI of AD7606 to exchange data and commands. GPIO13 worked as an external interrupt to receive BUSY signal from AD7606 and read data. EPWM5B controlled the one-way DC-DC converter through the optocoupler and the driver chip. EPWM4A and EPWM4B gave complementary PWM output to control the inverter.The circuit of the isolation driver consisted of the bootstrap driver circuit and the optocoupler isolation circuit. It separated the signals of power transmission and information transmission, and it also elevated the output voltage of TMS320F28335 to enable the on-off control of the power switch. DC-DC converter worked at a high speed, because the pulse width of PWM was constantly changing during power inversion, when tracking the maximum power point,and therefore, 6N315 high-speed optocoupler was used.

Fig. 7 Hardware architecture
Software design
Fig. 8 showed the software design of the system,which included the main program, the interrupt service routine, etc. The main program was responsible for initializing the system and the peripherals, including the system clock, phase-locked loop, GPIO,interrupt, etc. To avoid interruption, when initializing the timer and the peripherals, the total interrupt must be turned off after GPIO was initialized and turned back on after ADC, ECAP and EPWM had been initialized. The system clock was set to a maximum frequency of 150 MHz to improve the real-time performance.
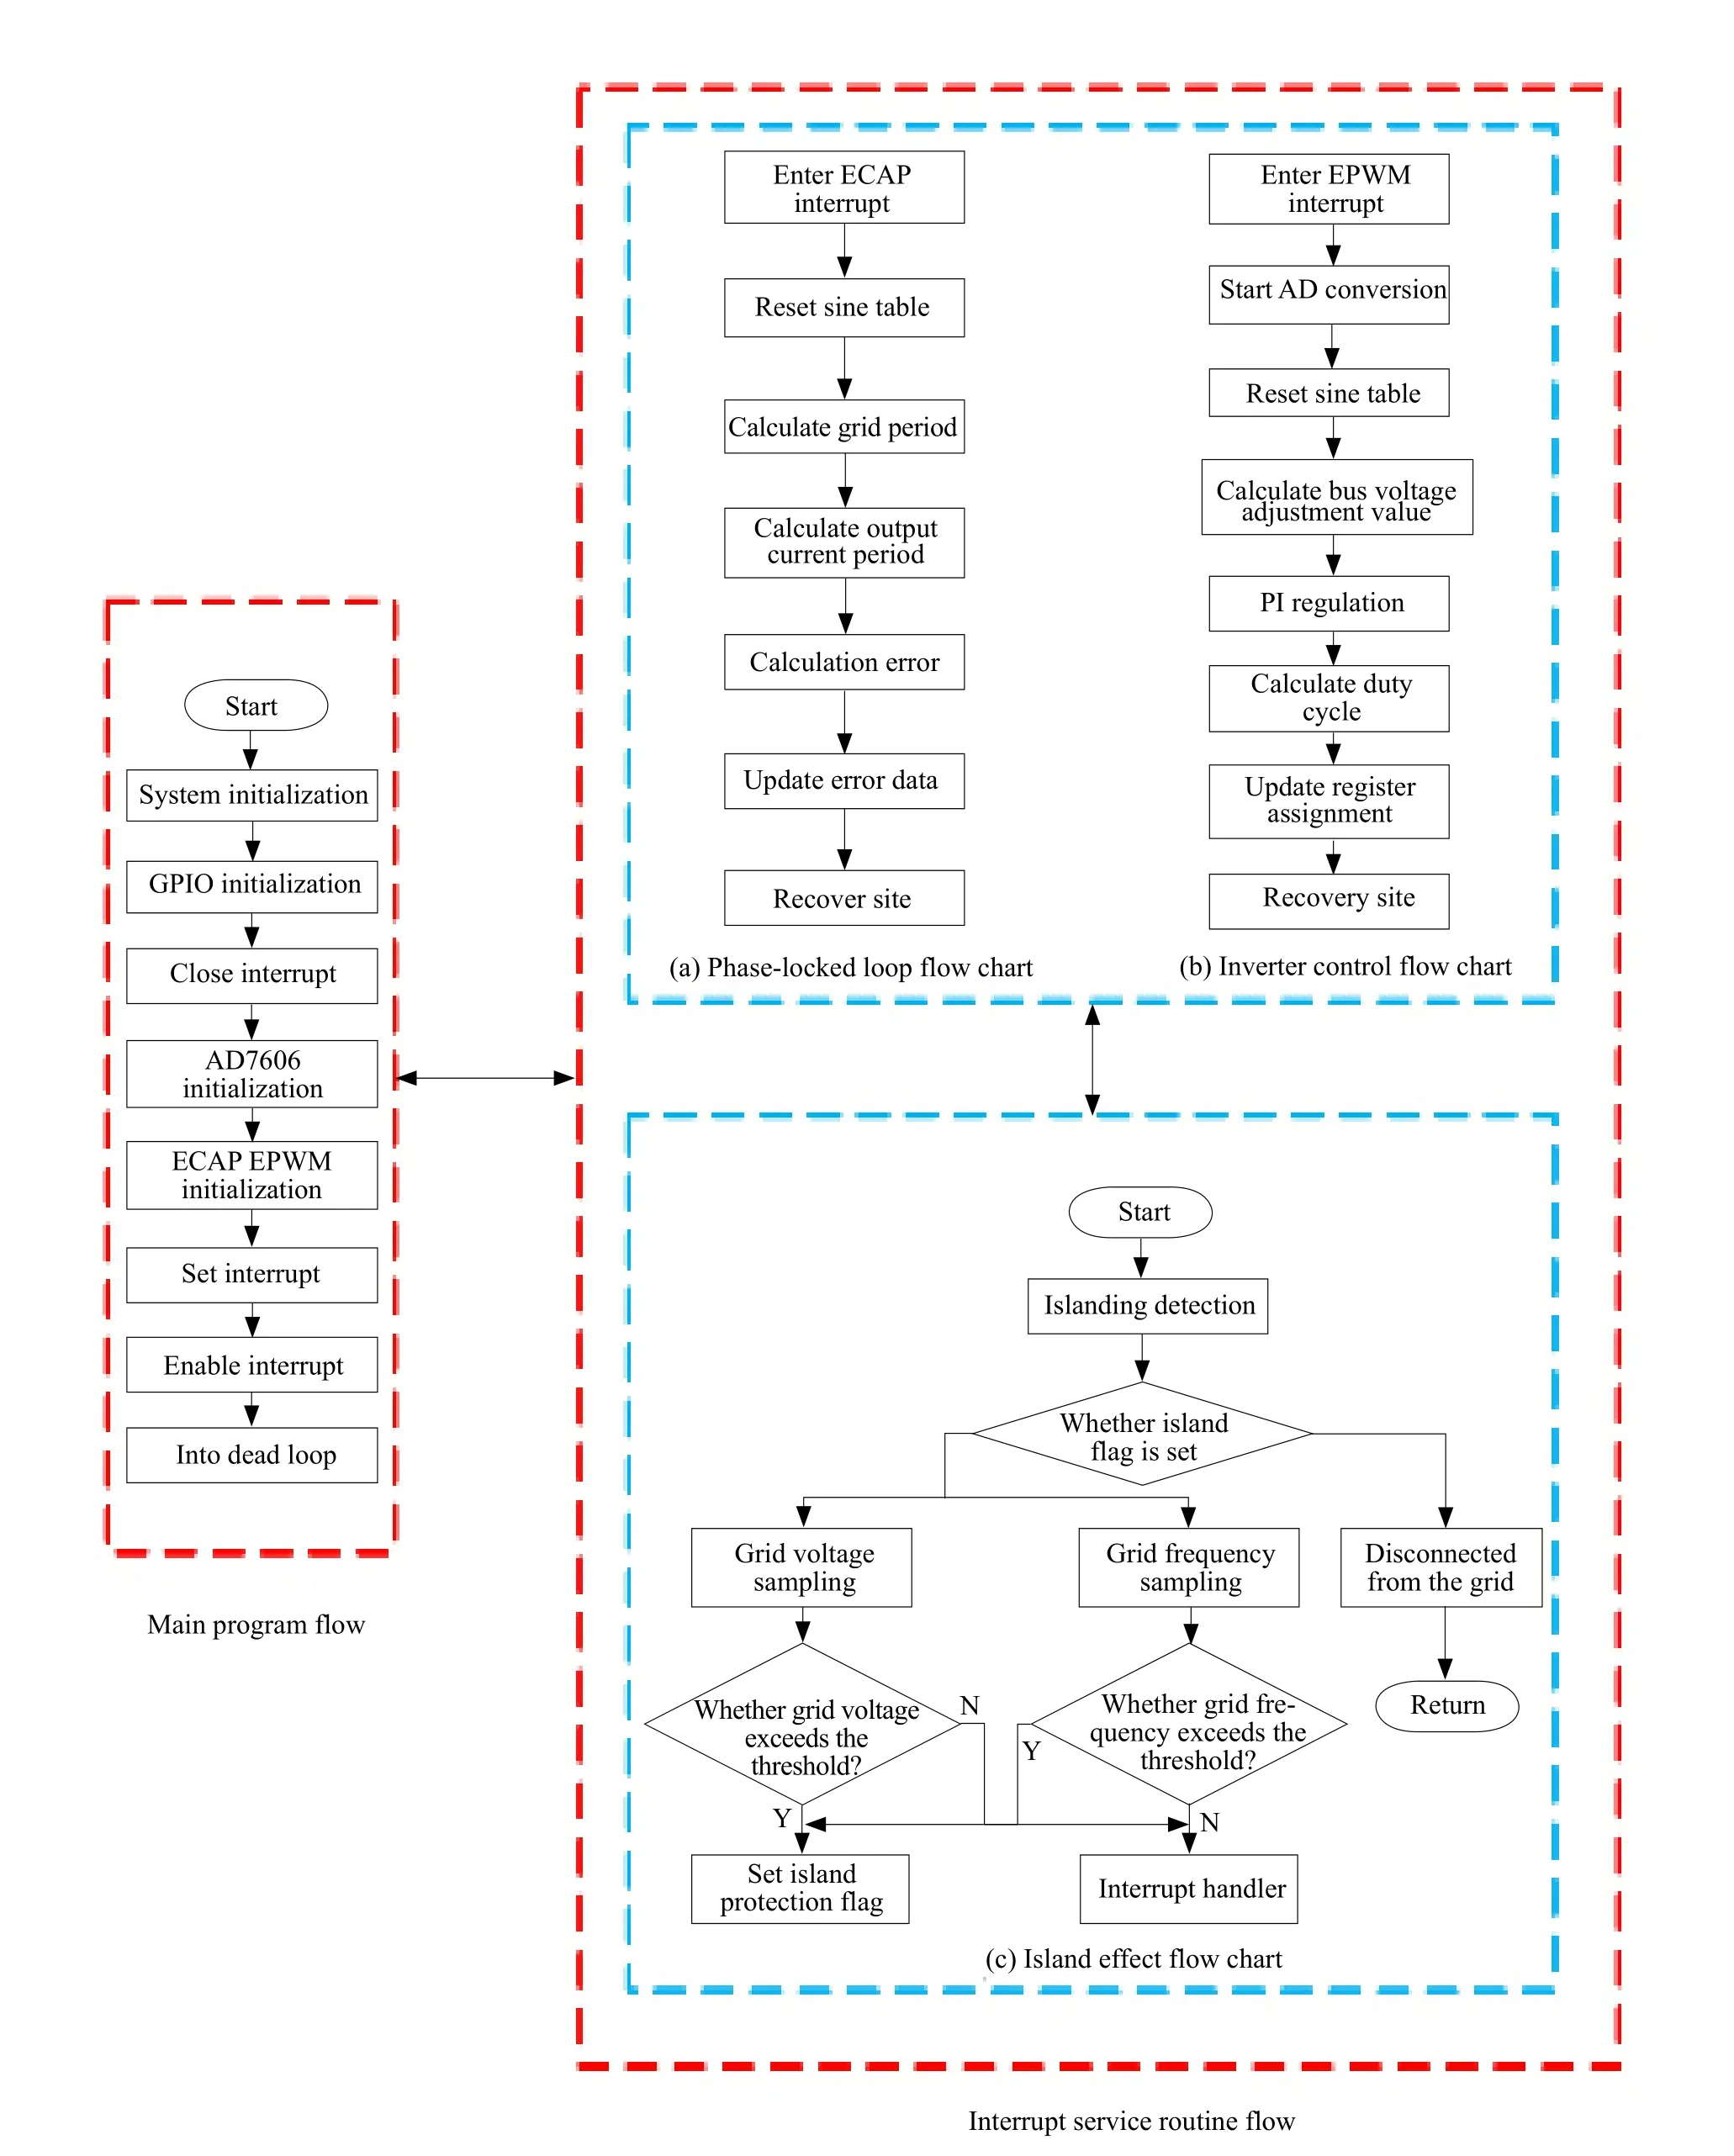
Fig. 8 Software flowchart
Fig. 8(a) showed the digital phase-locked loop,which made sure that the voltage and current of the inverter were in phase and at the same frequency with the current of the grid. Hall effect sensor at the grid detected the voltage signal and piped it through both the signal processing circuit and the hysteresis circuit. The resulting square wave synchronization signal was fed into the pin that corresponded to ECAP in DSP. When DSP detected the upper bound of the voltage, CAP was interrupted and the pointer of the sine table was reset. The period of the grid voltage was calculated in the interrupt subroutine, and the period of the current was calculated from TBPRD. The offset between these two periods were then used to constantly adjust the carrier period of PWM and thus ensured that the inverter current and the grid voltage were locked in phase and frequency.
Fig. 8(b) showed the inverter control program,which consisted of mainly the voltage loop control and the current loop control. The register was configured to set the frequency of the triangular wave to 15 kHz,and the increment/decrement counter was used.Upon PWM interrupt, the sinusoidal value was read through AD sampling, and both the duty ratio and the voltage adjustment to the bus were calculated. The corresponding value in the register was then updated and the interrupt flag bit was reset.
The islanding detection program was in ECAP interrupt routine, as shown in Fig. 8(c). The program first checked whether ECAP interrupt had occurred,and if so, the islanding detection program was called after the interrupt was entered. If the islanding flag was not set, then the program sampled the voltage value and the voltage frequency at PCC and checked, if they were within bounds. If they were, then the rest of the interrupt routine was executed, otherwise the islanding flag was set.
Testing
This above design was experimentally tested and verified. In the experiment, PV array was a SM3300 PV simulator (Delta Electronics Inc., VA, USA), and a RIGOL MSO2072A oscilloscope was used. The results are shown in Fig. 9, in which CH0 and CH1 showed the waveform of the voltage and the current, respectively.Fig. 9(a) showed the islanding detection under power mismatch. Fig. 9(b) and Fig. 9(c) showed the active islanding detection for capacitive and inductive loads during the failure of passive detection, respectively.The waveforms clearly showed the experimental results. In sum, the proposed newed method for islanding detection could reduce interference in the connected grid and allow timely detection of islanding with higher accuracy.
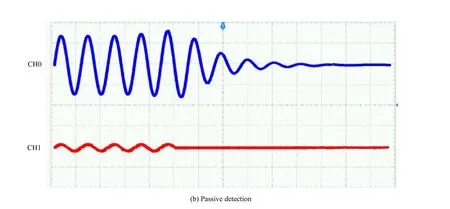

Fig. 10 Waveform of test runs
Conclusions
In this work, an overview was given on the islanding effect in grid-connected PV power systems as well as islanding detection methods. The strength and weakness of the detection methods were discussed.An improved islanding detection method was then proposed based on AFD.
The new method could to a certain degree reduce false alarms and prevent capacitive or inductive loads from offsetting the per-turbation signal. The new method was then evaluated in a simulated grid with MATLAB/Simulink. It was found that under power mismatch, passive detection responded promptly, and the active detection could make up for the passive detection, when the passive detection failed. It could be confirmed that the new method could rapidly and reliably detect islanding in the grid-connected PV power system.
Cao H Y, Tian Y X, 2010. Grid inverter control technology.Power System Protection and Control, 38(9): 72-74.
Chen W, Ai X, Wu T,et al. 2013. Impact of photovoltaic grid connected power generation system on power grid.Power Automation Equipment, 33(22): 26-32.
Chen Y, Zhen S, Qi X M,et al. 2013. Improvement of islanding detection algorithm for active phase shifting in PV grid-connected system.Journal of System Simulation, 25(4): 748-752.
Gao J H, Chen J, Yang H B,et al. 2013. Photovoltaic grid-connected inverter composite islanding detection method. Power SystemProtection and Control, 40(11): 122-126.
Gong W Y, Gong R X, Yan C G,et al.2013. An improved PV islanding system with active frequency shift detection method.Journal of Guangxi University, 38(3): 7620768.
Guo X Q, Zhao Q L, Wu W Y,et al.2007. Photovoltaic grid generation system islanding detection technology.Transactions of China Electrotechnical Society, 22(4): 157-162.
He J, Zhao G. 2013. Analysis of improved active frequency offset island detection.Electrical Measurement and Instrumentation, 50(3):41-44.
Li Y, Chen H, Guo J H,et al.2015. Study on the method of islanding detection for distributed generation grid connection system.Electronic Technology Applications, 41(11): 108-111.
Li Z X, Luo X S, Liao Z X,et al.2015. Improved positive feedback active frequency shift islanding detection method.Journal of Power Systems and Automation, 27(4): 13-17.
Liu F R, Kang Y, Duan S X,et al.2008. Parameter optimization of active frequency shift island detection method.Chinese Society for Electrical Engineering, 28(1): 95-99.
Liu F R, Kang Y, Wang H,et al.2010. An improved algorithm for active displacement islanding detection.Transactions of China Electrotechnical Society, 25(3): 172-176.
Liu F R, Kang Y, Zhang Y,et al.2008. Parameter optimization of active phase shift with positive feedback.New Electrician Technology, 27(3): 22-25.
Liu G Q, You X K, 2011. Simulation analysis of improved method of islanding detection with active feedback frequency shift.Power Grid and Clean Energy, 27(11): 41-45.
Lu T, Duan S Y, Kang Y,et al.2006. Inverter islanding grid detection method.Communication Power Technology, 23(3): 38-52.
Ma J, Mi C, Xia B Y,et al.2013. A new method of islanding detection based on positive feedback.Transactions of China Electrotechnical Society, 28(4): 191-195.
Yang H D, Wu L, Li X R,et al.2016. Improved periodic active frequency shift islanding method.Power System Protection and Control, 44(16): 50-55.
Yang H Z, Jin X M, 2005. Anti-islanding control of photovoltaic grid connected inverter based on positive feedback frequency shift.Journal of Solar Energy, 26(3): 409-412.
Zhang D, Wu J, Pan L,et al. 2007. Research on photovoltaic grid inverter island detection technology.China Testing Technology,33(4): 67-70.
Zhang X G, Wang R, Liu X L,et al. 2012. Improved active frequency offset islanding detection algorithm.Automation of Electric Power Systems, 36(14): 200-204.
Zheng S C, Ding M, Su J H,et al. 2005. Simulation and experimental research on photovoltaic power generation system and its island effect.Journal of System Simulation, 17(12): 3085-3088.
Zhou S M, Yuan X L, Fan F J,et al. 2013. Influence of active frequency shift islanding detection parameters on the power quality of power grid.Machinery Manufacturing and Automation, 41(1):184-186.
 Journal of Northeast Agricultural University(English Edition)2018年2期
- Journal of Northeast Agricultural University(English Edition)的其它文章
- Research on Market Risk Assessment of Dairy Farms: Taking 75 Dairy Farms in Heilongjiang Province as Examples
- Agricultural Exports Competitiveness of Pakistan in Global Market
- Design of Greenhouse Environment Control System Based on Internet of Things
- Identification and Genetic Diversity Analysis of Chinese Mitten Crab(Eriocheir sinensis) in the Liao River Area
- Effect of Lactobacillus acidophilus as a Dietary Supplement on Nonspecific Immune Response and Disease Resistance in Juvenile Common carp, Cyprinos carpio
- Evaluation of Post-operative Anti-stress Response of Dexmedetomidine in Dogs
