Elevated temperature intensity, timing, and duration of exposure affect soybean internode elongation, mainstem node number, and pod number per plant
Leon Hrtwell Allen Jr. *, Lingxio Zhng Kenneth J. Boote, Bernrd A. Huser
a U.S.Department of Agriculture-Agricultural Research Service,Gainesville,FL 32608,USA
b Department of Agronomy,University of Florida,Gainesville,FL 32611,USA
c Department of Biology,University of Florida,Gainesville,FL 32611,USA
1.Introduction
In soybean(Glycine max L.Merr.),the ultimate effects of climate change are likely to be decreased yield and seed quality in most production areas owing to increased temperature[1].Atmospheric general circulation models[2]indicate a potential global mean temperature rise of 1.4 °C to 5.8 °C by 2100.Such increases in temperature are expected to have adverse impacts on vegetative growth,reproductive development,and grain yield of important seed-producing crops,including soybean,in many regions of the world[3].Recent modeling studies also indicate that higher temperatures would decrease the yields of crops,including soybean[4,5].
Predicted increasing temperatures of future climates are likely to be associated with heat waves that may be more extreme than in climates of the 20th century.The severity,duration,and frequency(alternatively labeled as intensity or amplitude,longevity,and occurrences)of heat waves is expected to increase in the 21st century[6–9].Based on simulations under the Parallel Climate Model for the late 21st century(2080 to 2099)compared to the late 20th century(1961 to 1990),Meehl and Tebaldi[6]predicted an increase in annual heat wave occurrences from 1.66 to 2.08 for Chicago and from 1.64 to 2.15 for Paris.Furthermore,predictions of annual heat wave durations increased from ~7.3 days to ~8.8 days for Chicago and from ~8.8 days to ~13.4 days for Paris.Later,Lau and Nath[7]predicted increases in the frequency(range of 1.2 to 2.2)and duration(range of 2.2 to 3.8)of annual heat waves for eight key regions of North America for the mid-21st century in comparison with the end of the 20th century.
An early study[10]showed that increasing temperatures from 15.6 °C to 32.2 °C at a photoperiod of 14 h caused an increase in plant height and number of nodes of soybean cultivars Clark and Midwest.Such responses to temperature should increase the number of potential flowering sites associated with increasing racemes and/or branches,but these relationships may be tenuous and associated with specific cultivar responses[11].In a study with day/night treatments of 18/14 °C,22/18 °C,26/22 °C,and 30/26 °C,Thomas and Raper[12]found that,for soybean cultivar Ransom[Maturity Group(MG)8],the number of mainstem nodes increased with temperature and,generally,height and mean internode lengths also increased with temperature.Furthermore,pod-to-node ratios generally increased with temperature,except under their highest-temperature treatment.Employing day/night temperatures of 26/19 °C,31/24 °C,and 36/27°C,Baker et al.[13]found decreases in plastochron interval and small monotonic increases in final mainstem node number of Bragg soybean(MG 8)with increasing temperature.
Few experiments have investigated the effects of timing and duration of short-term elevated temperatures on soybean.However,Ferris et al.[14]studied the effect of eight days of elevated temperature(ELT)on Fiskeby V soybean(MG 00,a determinate,photoperiod-insensitive cultivar)at CO2concentrations of 360 and 400 μmol mol−1.Elevated temperature(daily mean of 30.1 °C versus 16.6 °C)was imposed beginning 41 days after sowing(DAS)at the R4 stage[15].The ELT on pod number per plant and individual seed weight was not significant,probably because the base temperatures were relatively low and the elevated temperatures were near the optimum for soybean[5].However,the higher temperature decreased the seed number per plant and seed yield(g m−2)under the 360 μmol mol−1CO2treatment but increased seed number and seed yield under the 400 μmol mol−1treatment.Although pod number was not measured,the seed weight per plant increased about 75%on the mainstem but did not increase on the branch stems.Mainstem seed yield per plant increased with temperature.
Recently Siebers[16]and Siebers et al.[17]used infrared heaters to study the effects of heating the soybean(cv.Pioneer 93B15,MG 3)canopy by 6°C(or slightly more)under five different 3-day treatments in 2010 and 2011.The growth stages at the beginning of ELT treatments were:(1)V6 with 10%of plants in R1;(2)V14,R3(beginning pod fill);(3)V18,R5(seed fill);(4)V7 with 10%of plants in R1;and(5)V15,R4.Seeds per pod and individual seed weight were not affected by any of the treatments.The numbers of pods m−2and seed yield were decreased significantly when the ELT treatments were initiated at stage R3 or R4,but not significantly affected when treatments were initiated earlier at the beginning of stage R1 or later at stage R5.
Tenorio[18]reported that node initiation rate and node appearance rate(nodes day−1)increased linearly with temperature across the 12–24 °C range.Generally,taller soybean plants grown in the field have more mainstem nodes than shorter plants.Linear regressions of soybean node number on mainstem height by Heatherly and Smith[19]yielded the following relationship:node number=0.125×[plant height]+5.07,R2=0.49.In similar regressions by Zhang[20],node number=0.186×[plant height]+0.349,R2=0.74 and pod dry weight(g per plant)=1.66×[number of mainstem nodes]+9.11,R2=0.65.Differences in number of mainstem nodes and plant heights were caused by photoperiods obtained from a range of planting dates[21].Finally,the most convincing information relating nodes per plant to plant height and pods m−2to nodes m−2was provided by Egli[22]in a two-year study using four cultivars of soybean with MG ranging from 0.7 to 5.3.Values for both years yielded the following relationships:mainstem nodes per plant=14.26–0.159×[plant height]+0.0016×[plant height]2,R2=0.87.For 2010,pods m−2=− 949+5.150 × nodes m−2–0.0026×[nodes m−2]2,R2=0.97.For 2011,pods m−2=−1103+5.017×nodes m−2–0.002 × [nodes m−2]2,R2=0.95.Together,these studies indicated that taller soybean plants produce more mainstem nodes,which in turn should produce more pods.Furthermore,short-term ELT treatments at various stages of development might affect quite differently the number of pods set and subsequent seed yields.This information indicates the need for research on factors that influence soybean node numbers,and consequent pod and seed yields,especially under different temperature treatments.
The primary objective of this study was to assess the effects of several intensities of long-term ELT on morphology,phenology,vegetative growth,and reproductive growth and yield of soybean when ELTs are applied at various stages of growth including shortly after seedling emergence,at first flowering,and just before beginning of pod fill.A second objective was to assess the effects of short-term(10-day)exposures to ELT beginning at four different stages of development from pre-flowering to immediately before the beginning of pod fill(emulating short-term heat waves during various parts of the crop life cycle).To accomplish these objectives,three experiments were performed.The scope of this paper is limited to effects of intensity,timing,and duration of ELT on morphological responses of mainstem node numbers and internode elongation(lengths),and the total number of pods per plant.This research is important because the number of nodes affects the number of potential flowering sites and number of pods,and the combination of internode lengths and internode numbers affect the strength of the mainstem.Detailed effects of the treatments on reproductive growth,seed yield,and components of seed yield are reported elsewhere.
2.Materials and methods
2.1.Plant growth environment
Three experiments(EXP 1,EXP 2,and EXP 3)were conducted on the University of Florida campus at Gainesville(29°39′N,83°40′W).Soybean was grown in pots in four rooms of an eight-room,controlled-environment,polycarbonate greenhouse with sensors,actuators,and control programs for controlling environmental conditions.Air temperatures were controlled to squarewave,equal-12 h-length thermoperiods of 30/22 °C,34/26 °C,38/30 °C,and 42/34 °C.Carbon dioxide concentration was maintained at 700 μmol mol−1in all rooms during the daylight period,but could rise higher during the dark period owing to plant respiration.A CO2concentration of 700 μmol mol−1is within a midrange of projections for the year 2100[2].The warm period of each day extended from08:00 h to 19:00 h Eastern Standard Time(EST)[09:00 h to 20:00 h Eastern Daylight Saving Time(EDT)]followed by 1 h of linear transition to the cool period.The cool period extended from 20:00 h to 07:00 h EST the next day(21:00 h to 08:00 h EDT)followed by 1 h of linear transition to the warm period.Air relative humidity was controlled to 55%and 70%during the 11-h high-and 11-h low-temperature times of day,respectively,and ranged between these two setpoints during the transition periods.A special solar-radiation-shielded,aspirated cover for the air temperature and relative humidity sensors was installed to assure control to actual set points with minimal errors due to sunlight.A second set of aspirated,radiationshielded sensors of a different type were used to check and confirm the proper operations of the primary control temperature and relative humidity sensors.Further information about the eight-room greenhouse and environmental control systems,as well as the effect of UV radiation exclusion on increasing internode lengths of soybean,was reported by Zhang et al.[23].Fig.1 shows the annual distribution of duration of daylight and duration of daylight plus civil twilight for 30°N latitude as extracted from List[24].The periods of growth of each experiment during the annual light cycle are indicated on this figure.
The number of mainstem nodes and number of mainstem internodes are considered identical throughout this paper,and the terms will be used interchangeably.Designations of vegetative stage(V-stage)and reproductive stage(R-stage)of soybean follow the definitions of Fehr and Caviness[15].Additionally,in the plant sampling procedure used,the number of mainstem nodes and mainstem internodes reported is equal to V-stage plus 1(V-stage+1).
2.2.Cultivar and cultural practices
The cultivar Maverick(MG III,indeterminate)was selected because the plan of the USDA grant(see Acknowledgments)included a study to compare ELT effects on four transgenic lines of Maverick with those on the non-transgenic cultivar.[Maverick was transformed with the promoter from the lipid transfer protein(LTP4)used to drive the expression of several reactive oxygen species(ROS)-scavenging genes in ovules as a possible option for promoting higher yields at elevated temperatures.The results of this specific experiment will be reported elsewhere].Seeds were pre-inoculated with Bradyrhizobium.Plant culture practices,potting soil preparation,and fertilizer nutrition were as reported previously[23].Four seeds were sown in 5-L pots(20 cm inner diameter×20 cm depth)filled with 4 L of potting soil.The potting medium was Metro-Mix 200 and perlite mixed at a ratio of 6.6:1.0(v:v),and fertilized with 3 g L−1(12 g per pot)slow release Osmocote 19–6-12(N-P2O5-K2O)fertilizer.Metro-Mix 200 is formulated with vermiculite,Canadian sphagnum peat moss,coarse perlite,starter nutrient charge(with gypsum),and dolomitic limestone.Pots were placed in shallow(4-cm depth)trays for sub-irrigation and water was replenished to a 3-cm depth as needed,usually every 2–3 days to avoid water stress.After emergence,plants were thinned to one per pot.Additional nutrient solution with micronutrients was added about 30 days after sowing(DAS).
2.3.EXP 1–ELT treatments from early flowering(R1)to maturity
Experiment 1 investigated the effect of ELT applied at an early reproductive stage,R1(vegetative stage V6).EXP 1 was conducted in the greenhouse from May 16,2011(day of year,DOY,136)to September 22,2011(DOY 265).A total of 68 plants were germinated and grown initially under 30/22°C until June 6,2011.Then ELT treatments in 4 °C steps above 30/22 °C control(34/26,38/30,and 42/34°C)were imposed on 16 plants in each room(except for 20 plants in the 38/30°C room).The ELT treatments began at 23 DAS(V6)one day before the first flowers opened(24 DAS)which signaled the R1 stage.The time from sowing to pod setting for EXP 1 occurred during the longest day-lengths of the year(Fig.1),which corresponds with timing of field crops in soybean-producing regions of the USA.
Data were collected on six dates:July 5(50 DAS),July 26(71 DAS),August 10(86 DAS),August 24(100 DAS),September 6(113 DAS,except for the 38/30°C treatment)and September 22(129 DAS,for the 38/30°C treatment only).Four plants of each temperature treatment were sampled on each date for measuring lengths of each mainstem internode beginning with the first node above the cotyledons.From these data,the number of mainstem internodes(same as the number of mainstem nodes)of each plant was calculated.Since the number of internodes reported was equivalent to V-stage+1,all values for number of internodes can be interpreted also in terms of V-stage.Also,the mainstem length was the sum of the lengths of each sequential mainstem internode.The pods on each plant were counted.Other data,including leaf area and dry weights of stems,petioles,leaves,roots,pods,podwalls,and seeds,were collected for other purposes(to be reported elsewhere).The plastochron rate or rate of expression of trifoliolates day−1[25,26],equivalent of nodes per day or internodes per day,was calculated by the number of mainstem nodes gained between measurements at 23 and 50 DAS divided by 27 days.
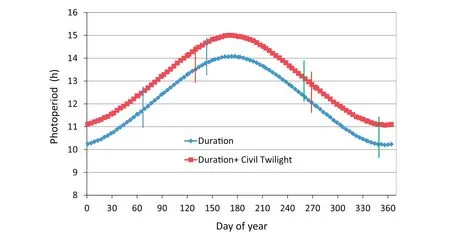
Fig.1 –Annual duration of daylight for Gainesville,FL(data for Latitude 30°N).Data extracted from Smithsonian Meteorological Tables(Table 171,Duration of daylight,and Table 172,Duration of civil twilight),List[24].Plant responses based on phytochrome should lie somewhere between these two photoperiod ranges.Intervals between the vertical red,green and blue lines show the periods of experiments(EXP)1,2,and 3,respectively.
2.4.EXP 2–elevated temperature from beginning pod fill(R5+stage)to maturity
Experiment 2 investigated the effects of ELT on soybean vegetative growth when treatments were applied at a later reproductive stage,R5+(vegetative stage V16–V17).Cultural practices and procedures were generally the same as those of EXP 1,except the period of EXP 2 was from September 15,2011 to December 21,2011(DOY 258 to DOY 355),when the natural photoperiod was much shorter and continuously decreasing,compared with that of EXP 1(Fig.1).Plants were started at the control temperature in three rooms rather than four to allow the continuation of the 38/30°C treatment of EXP1 until the 22 September harvest.
A total of 68 plants were initially grown under 30/22°C conditions until November 2(DOY 306,48 DAS,R5+stage),when six plants were selected at random from the rooms for assessment of agronomic traits including plant height,number of nodes,and lengths of internodes.On the same day,ELT treatments of 34/26 °C,38/30 °C,and 42/34 °C were imposed in three rooms.Data similar to those for EXP 1 were recorded for four plants sampled from each of the four temperature regimes on November 15(61 DAS),November 28(74 DAS),December 9(85 DAS),and December 21(97 DAS).
2.5.EXP 3–ETL treatments for 10 days at various growth stages
Experiment 3 investigated the growth and development of soybean plants with exposures to short periods of ELT applied at various vegetative and reproductive stages of development compared with long-term ELT applied at stage VC+at 9 DAS.Growth conditions and cultural practices in EXP 3 were the same as in the previous experiments,except that it was conducted from February 28,2012 to May 29,2012(DOY 59 TO DOY 150),when the natural photoperiod was relatively short at the beginning but increased throughout the experimental period(Fig.1).
A total of 47 plants were used in EXP 3.Seeds were sown on February 28(DOY 59).Plants were grown in rooms at 30/22°C until March 8(9 DAS),about one day past the time when the unifoliolate leaves of the seedling fully opened,defined as vegetative stage(VC)[15].At this stage,five plants each were continuously exposed to 30/22 °C,38/30 °C,or 42/34 °C temperature regimes throughout the entire experimental period.The other 32 plants remained in the 30/22°C rooms until short-term ELT treatments were implemented.Four plants were moved from the 30/22 °C regime to 38/30 °C and 42/34°C regimes at four different stages[V3 at 15 DAS;R2 at 23 DAS(V6);R3 at 32 DAS(V10);and R5+at 48 DAS(V16-V17)]for 10 days and then were moved back to the 30/22°C room.Plant height and the number and length of mainstem internodes were recorded at the end on May 29(91 DAS).Other plant data similar to those of EXP 1 and EXP 2 were also recorded but will not be discussed here.
2.6.Statistics
Analyses of variance(ANOVA)using PROC GLM of SAS were fitted for the numbers of internodes,the mainstem lengths,and total pods per plant for end-of-season measurement across the 19 treatments(4 of EXP 1,4 of EXP 2,and 11 of EXP 3).Means were separated using Tukey's Studentized Range(HSD)Test at the 0.05 level of probability.Standard error of the mean was calculated for internode lengths for display in bar graphs of internode length versus internode position number along the mainstem.For EXP 1,an ANOVA was fitted for the internode lengths of the four temperature treatments at each internode position number,and differences of mean internode lengths among the four treatments were tested using Tukey's Studentized Range Test(HSD).Polynomial curves were fitted to mean internode lengths for each of the four temperature treatments.For EXP 3,at each of the four times of the 10-day exposures to 38/30 °C and 42/34 °C,an ANOVA was fitted comparing each internode length at each internode position at the final sampling with values from plants exposed to 30/22°C throughout the life cycle.Differences of mean internode lengths among the three treatments at each internode position were tested using HSD.Polynomial curves were fitted to internode lengths versus internode position number to illustrate the lag effects of 10-day ELT treatments on internode lengths.Relationships among total pod numbers per plant and internode numbers(node numbers),mainstem length,and treatment temperatures were estimated with regression analyses.
3.Results and discussion
Table 1 shows the dates of sowing,time and duration of temperature treatments,and final number of mainstem internodes,overall mainstem lengths,and total number of pods per plant for temperature treatments imposed at three different stages of soybean development.
3.1.EXP 1:ELT treatments imposed from flowering(R1)to maturity
Fig.2 displays the final patterns of soybean mainstem mean internode lengths for plants treated with four different temperatures starting at the R1 stage(V6 stage,with seven nodes and internodes).For all plants,the first three to four internodes formed before ELT treatments were imposed.These first internodes ranged from 2 to 4 cm in length.Except for the highest-ELT treatment,the lengths of internodes progressively increased,reaching a maximum length of 14 cm for the 10th internode.Long internodes were maintained until almost the end of vegetative growth.With one exception,there were no significant differences in the mean internode length of the 34/26 °C and the 38/30 °C ELT treatments from the 30/22°C controls treatment over the range of internode position number 4 to 27.The 38/30°C ELT treatment resulted in significantly smaller internode lengths for internode position numbers 25 and 26(Fig.2).The internode lengths were shorter for the 42/34°C ELT treatment,but more nodes formed in these plants(Fig.2),likely because pollen failed to form and seed set failed at this temperature.
While internode lengths in 34/26 °C and 38/30 °C ELT treatments were similar in length to those at equivalent positions in the control plants,they formed nodes at different rates.Based on linear regression of the values at 23 DAS and at 50 DAS,the calculated plastochron rates were 0.4815,0.5741,0.5926,and 0.4444 day−1for the 30/22,34/26 °C,38/30 °C,and 42/34°C treatments,respectively(Fig.3).Based on the mean total number of nodes(23.2)present in the 30/22°C treatment(Fig.3)and plastochron rate,theoretically,it should take 56.65 days to form all the nodes of the plant.At 56.65 DAS,the calculated mean number of nodes(and internodes)would be 26.3,27.0,and 22.0 for the 34/26 °C,38/30 °C,and 42/34 °C ELT treatments,respectively.Apparently,ELT treatments continued to add nodes(internodes)for longer durations to achieve the values in Fig.3 and Table 1.
The ELT treatments applied at stage R1(stage V6 at 23 DAS)significantly affected the final number of nodes(Figs.2 and 3,Table 1).Plants grown at control temperatures produced fewer nodes,whereas plants exposed to higher temperatures showed prolonged vegetative growth and produced more nodes,with potentially more flowering and fruiting sites.The increase in number of potential fruiting sites in temperature-stressed plants may have resulted from fewer seeds per pod that mature,as predicted by the hypothesis of serial adjustment of maternal investment[27].
3.2.EXP 2:ELT imposed from pod fill(R5)to maturity
An ANOVA indicated no significant difference in the final patterns of the internode lengths at each internode position number among the four temperature treatments(Fig.4-A–D),but the later internode lengths of the plants with the 42/34°C treatment were somewhat reduced in the later part of the growth period(Fig.4-D,Table 1).This result shows that these late ELT treatments had little effect on the final pattern of internode number and internode elongation.By stage R5+of EXP 2(48 DAS),about 18 nodes were formed(Fig.5),and this number did not increase throughout the remainder of the experiment(91 DAS)under any of the temperature treatments(Fig.5,Table 1).These results suggest that successful fruit set causes a reduction in the production of additional reproductive meristem formation and a reallocation of resources toward seed growth in soybean.
3.3.EXP 3A–continuous temperature treatment component
In the first part of EXP 3,continuous ELT temperature treatments of38/30 and 42/34°C were imposed at 9 DAS on seedlings initially grown at 30/22°C.The effect of ELT on internode elongation and number of internodes for these treatments was more pronounced compared with those in EXP 1 and EXP 2(Fig.6-A–C).For plants grown under the 30/22°C treatment,internodes started to elongate progressively from the fifth internode and reached the longest point around internode position numbers 11 or 12(Fig.6-A),a pattern similar to those seen in the two previous experiments under the same control temperature(Figs.2-A,4-A).Above position 12,internode lengths at each increasing internode position number decreased progressively.An ANOVA comparing the internode lengths at each internode position among EXP 1,2,and 3 for the 30/22°C treatment showed no significant differences for the first 19 internode position numbers.However,the mean final number of nodes was greater for EXP 1 than for EXP 2 and EXP 3 for this control temperature(Figs.2,4,7,Table 1),probably because of the longer day length for the May 16 planting date(Fig.1)[28,29].Total mainstem length tended to be greater for the May 16 planting date also(Table 1).
For plants grown under 38/30 °C and 42/34 °C treatments,the final patterns of both internode elongation and internode numbers differed(Fig.6-B,C)from plants grown under 30/22°C(Fig.6-A).First,means of29 and 40 nodes were produced in plants of 38/30 and 42/34°C treatments,respectively,compared to a mean of 18 nodes in the 30/22°C treatment(Table 1).Second,the internodes,beginning after the 5th internode,were much shorter in plants at 38/30 °C and 42/34 °C treatments.In plants exposed to 42/34°C,the lengths of all internodes were less than 10 cm(Fig.6-C).No ANOVA was fitted to compare internode lengths at each position number because of the wide range of total internode position numbers,as shown in Fig.6.
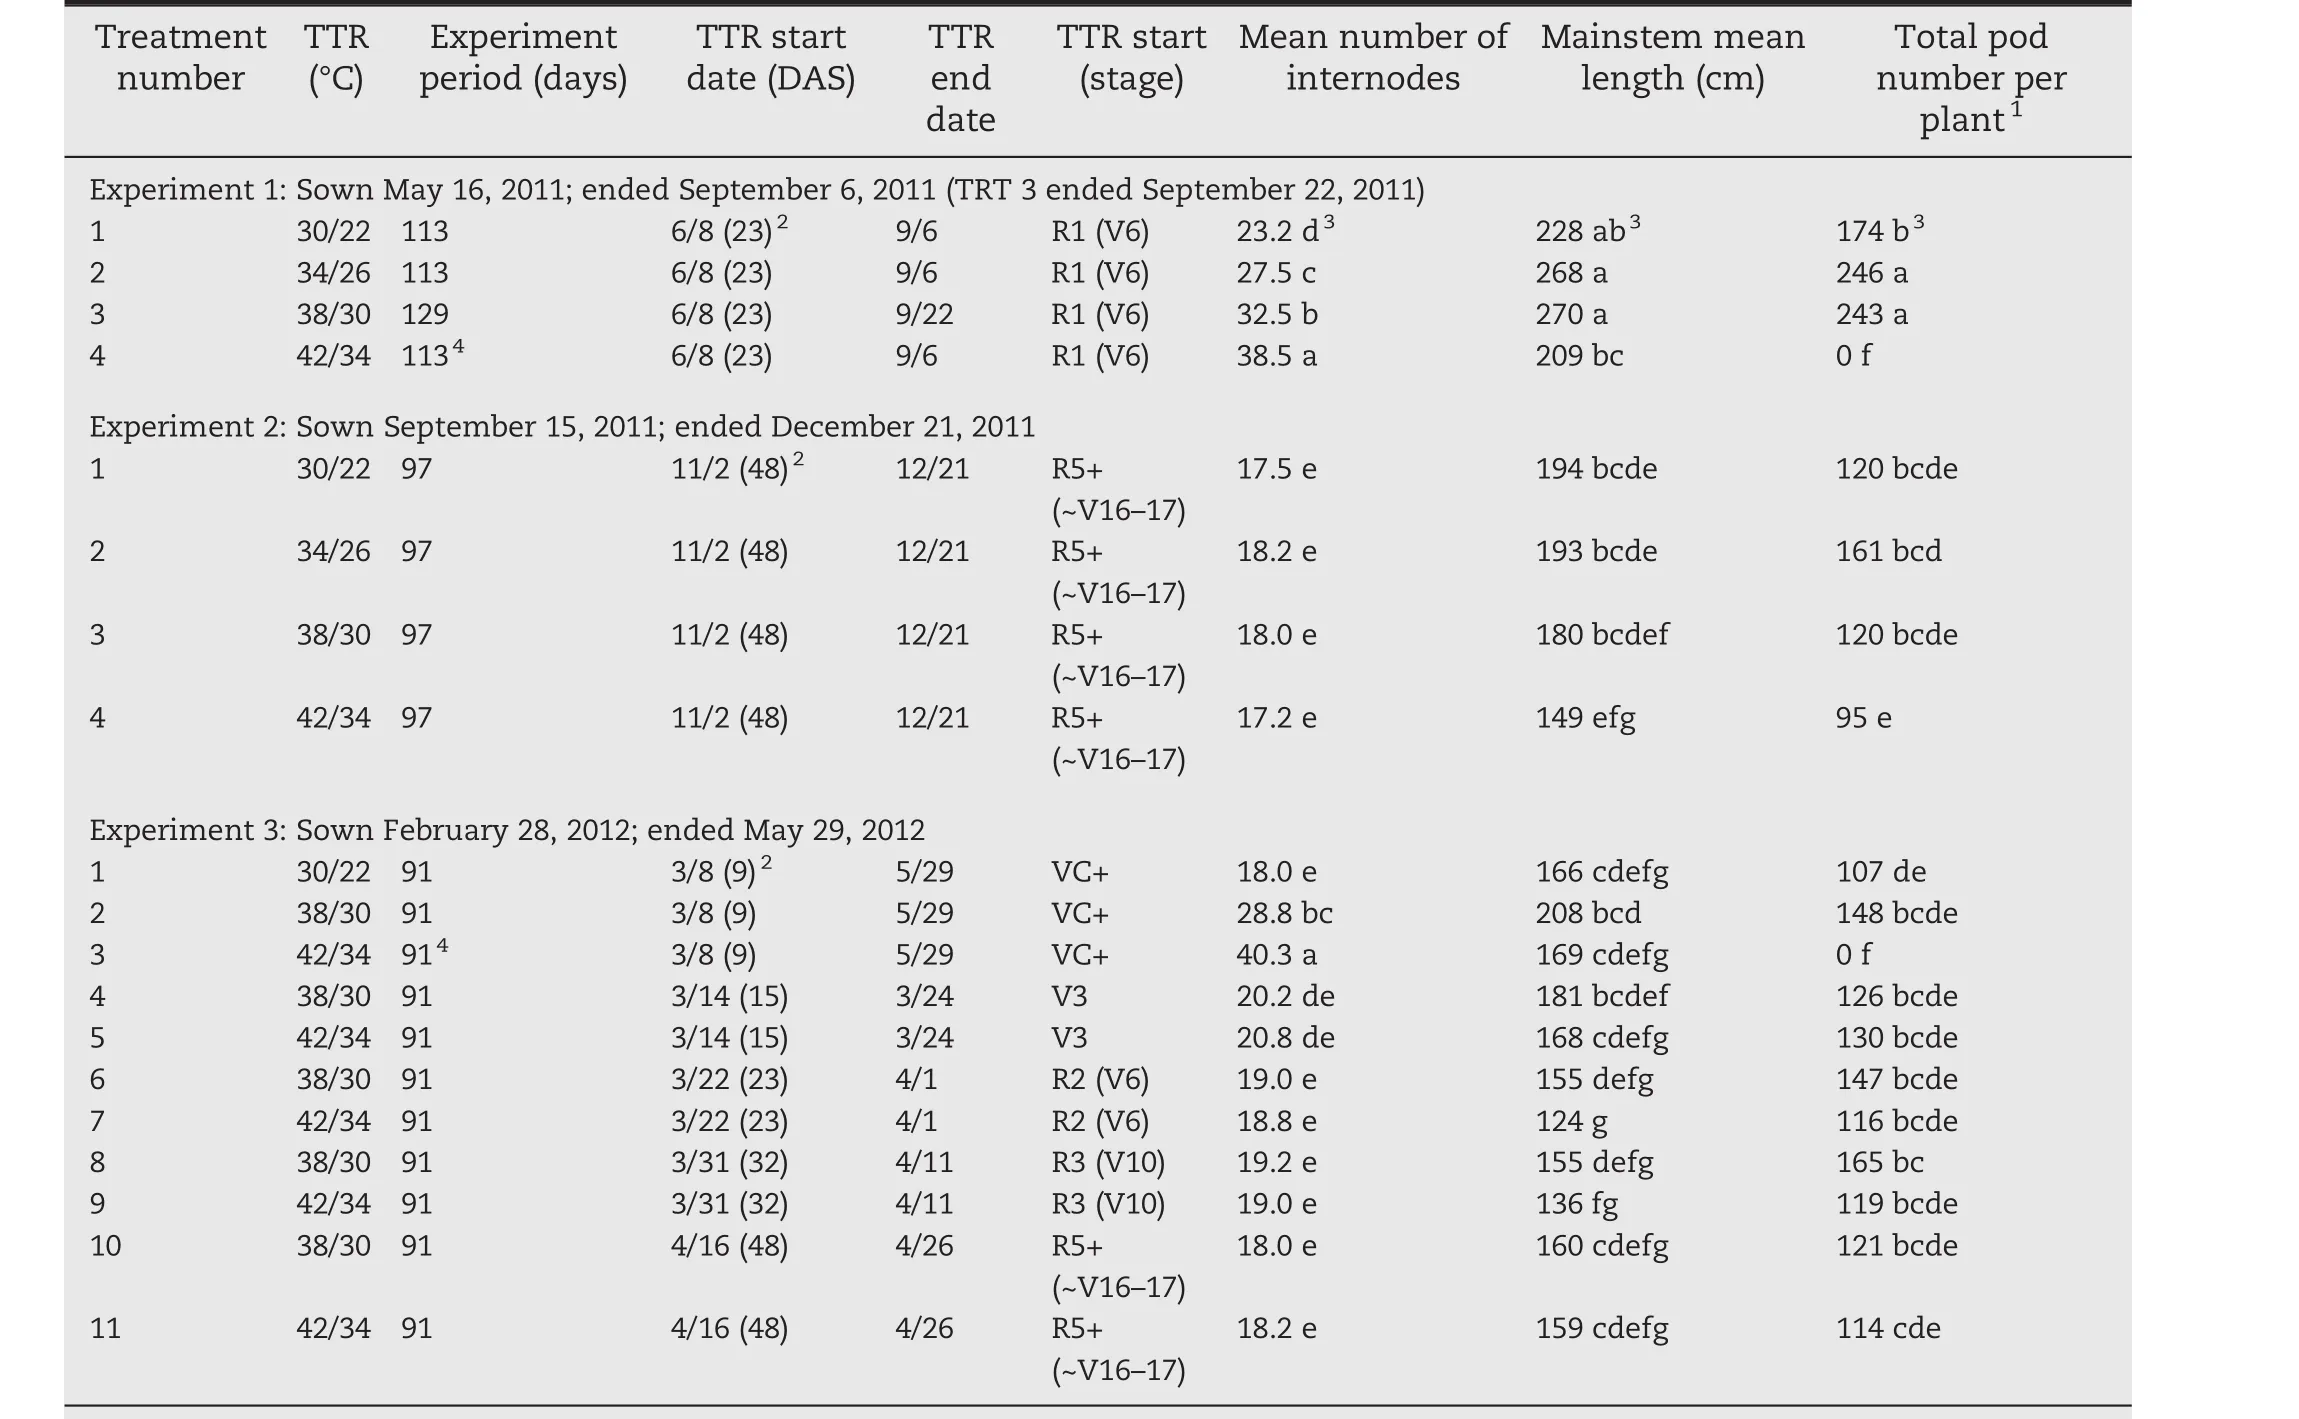
Table 1–Summary of final mean numbers of internodes,mean mainstem lengths,and pod number per plant of Maverick soybean under different temperature treatment regimes(TTR)in three experiments.The total number of samples was 89.The mean number of internodes shown in this table will usually be slightly smaller than the maximum number of internodes shown in the figures.
3.4.EXP 3B–short-duration treatments at different stages:timing and intensity of ELT
The second part of EXP 3 examined effects of short-term ELT exposure on internode elongation and node formation(Fig.7).Sets of six soybean plants were moved to the 38/30°C and 42/34°C treatments for 10-day periods beginning at four different stages[V3,R2(V6),R3(V10),R5+(V16-V17)]and then returned to the 30/22°C treatment for the remainder of the experiment.Polynomial regressions were used to compare internode lengths versus internode position number of 10-day ELT treatments at the four stages with respect to the constant 30/22°C treatment.There were significant reductions in internode elongation in comparison with the constant 30/22°C treatment following the ELT treatments except for those beginning at the R5+stage(Fig.7).Reductions in internode elongations in plants treated with 42/34°C were greater than those in plants treated with 38/30°C.The effect of the shortterm ELT treatment on internode lengths was greatest for the treatment that began at the R2(V6)stage of development with internode lengths significantly reduced at internodes 8 through 14 of the 42/34°C treatment and reduced at internodes 9 through 13 of the 38/30°C treatment(Fig.7).In all cases,the maximum reduction in main stem length was expressed in internodes that formed at 3 to 4 node positions after initiation of ELT treatments.
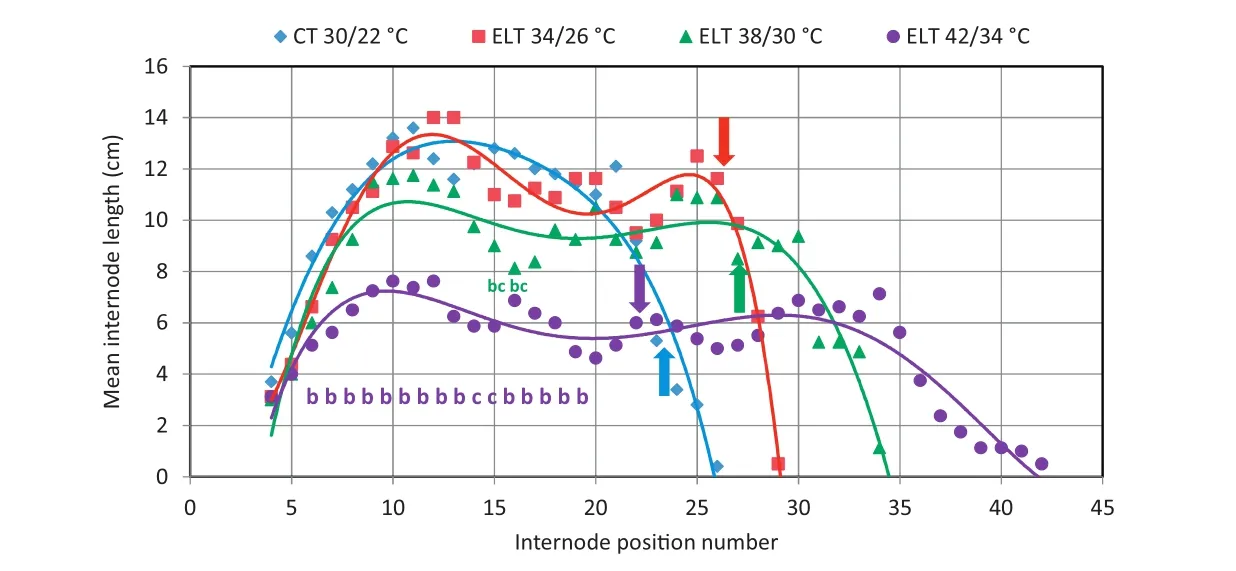
Fig.2–Polynomial(5th-degree)fits of internode lengths versus internode position number for four temperature treatments of Experiment 1.Elevated temperature(ELT)treatments were started at 23 days after sowing(DAS)(R1 stage at the V6 stage).Blue diamonds indicate control temperature(CT 30/22 °C),red squares indicate ELT 34/26 °C,green triangles indicate ELT 38/30 °C,and violet squares indicate ELT 42/34°C.The blue solid vertical arrow shows the mean internode number(23.2)reached at a calculated DAS of 56.65 by the control temperature treatment,CT 30/22 °C,which had a plastochron rate(PR)of 0.4815 day−1.The other solid vertical arrows indicate the mean internode number that was reached by the other treatments of ELT 34/26°C(DAS 26.3)with a PR of 0.5741 day−1(red solid vertical arrow),ELT 38/30 °C(DAS 26.9)with a PR of 0.5926 day−1(green solid vertical arrow),and ELT 42/34 °C(DAS 22.0)with a PR of 0.4444 day−1(violet solid vertical arrow).Note that the PR increased with increasing temperature,but decreased at the greatest ELT.
3.5.Comparisons of temperature effects among the three experiments
Soybean plants treated at growth stage V3 or R1 with ELTs of 38/30 °C and 42/34 °C for the remainder of the life cycle initiated more nodes while producing shorter internodes than plants grown under the control temperature(30/22°C)[Fig.2(R1),Fig.6(VC+),Table 1].This effect was most pronounced under the 42/34°C ELT.Final plant height was determined by the accumulated internode lengths.When the ELT treatment was imposed late(stage R5+in EXP 2),the effects on final internode lengths and node numbers were minimal(Fig.4,Table 1).
In EXP 3,with soybean grown under 38/30°C temperatures continuously from the VC+stage,plants formed more total nodes(29 versus 18 for EXP 2,Table 1)and took more time to reach maturity.Concomitantly,flowering was prolonged and pods continued to be produced.Continuous highest ELT(42/34°C)from the VC+stage caused pollen failure and flower abortion;no pods were set.New nodes formed continually and initiated flowers that aborted.The plants eventually produced a mean number of 40 nodes,which would not occur under natural,cooler moderate-daylength growing conditions for a MG III soybean.Thus,the upper limit of ELT for soybean seed set seems to lie between 38/30 °C and 42/34 °C in this square-wave diel temperature cycle.Pan[30]found the failure of soybean cultivar Bragg seed set to occur at about 39°C mean daily temperature with a smoothly varying 44/34°C diel temperature control algorithm.
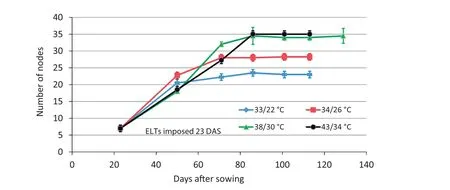
Fig.3–Experiment 1,2011.Effect of application of elevated temperature(ELT)treatments at 23 DAS(stage V6 and early stage R1)on soybean node appearance,compared with control temperature of 30/22°C.Plants with different temperature treatments showed significant difference in number of nodes at maturity.

Fig.4–Experiment 2,2011.Effect of elevated temperature(ELT)treatments on patterns of soybean internode elongation and internode position numbers at crop maturity(stage R8)when temperature applications were imposed at seed development period(R5+).Error bars show the standard error of the mean of four plants.
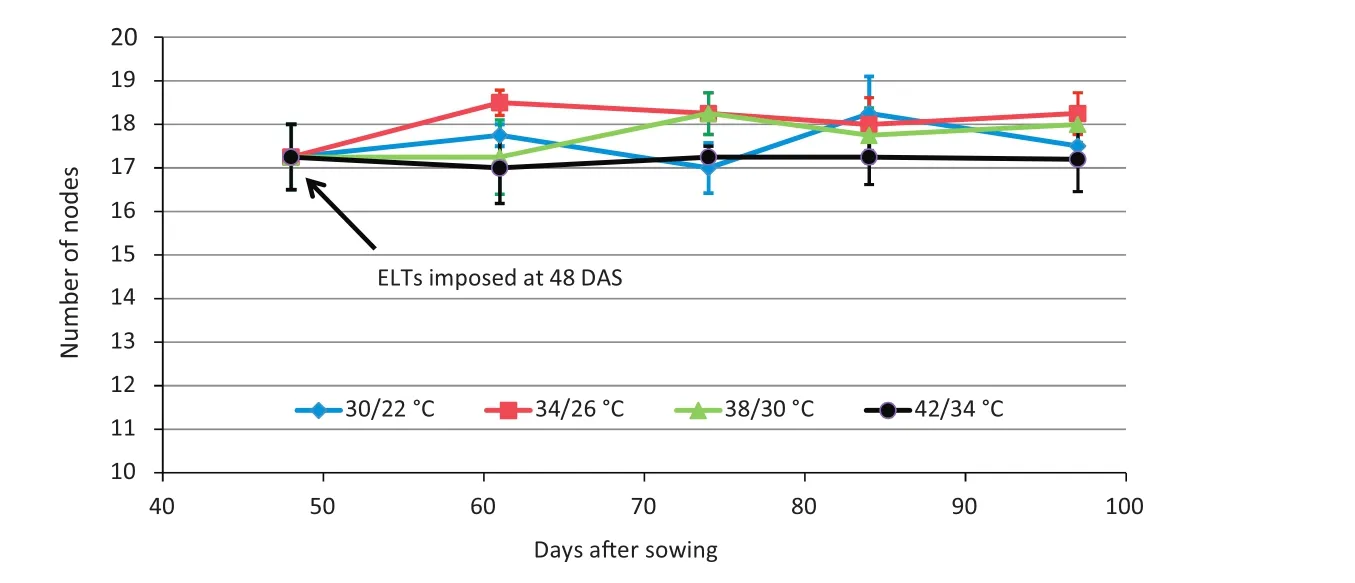
Fig.5 – Experiment 2,2011.Mean number of nodes(±standard error)of four temperature treatments versus days after sowing(DAS)for Maverick soybean.Elevated temperature(ELT)treatments were applied late at 48 DAS(late R5 stage).Plants with different ELT treatments showed no statistical difference in number of nodes.
Indeterminate soybean cultivars,such as Maverick,continue vegetative growth for a period of time after flowering[31].Accordingly,when ELT treatments were applied at stage R1 or earlier,the continuing vegetative growth was manifested,as indicated by the increase in final number of nodes for ELT treatments among three experiments(Figs.2,5,7).However,after stage R5,vegetative growth ceases,as plants divert resources into reproduction.In addition,the final meristem number is determined at an earlier time,so that no additional meristematic nodes were available to be expressed.Thus,as expected in EXP 2,when temperature treatment was imposed at late R5 stage,internode elongation and node formation were little affected(Fig.5),resulting in a limited increase in plant height(Table 1).Moreover,when temperature treatments reached extreme values(42/34°C),plant height was actually reduced(Table 1,eighth column).
For this indeterminate soybean cultivar,node number continued to increase across each step of long-term ELT because fewer days were required for the production of each node.This increase in node number increases the number of flowering sites and thus could potentially increase the number of mainstem pods,especially if the indeterminate cultivar were selected for setting sufficient pods at each node.Internodes became shorter for each step of ELT because fewer days were required for node initiation and less time was available for internode growth.For the early(stage VC+)highest ELT(42/32°C)of the 28 February sowing date,this rapid onset of each new node continued because no pods were set,with no prospect of yield increases.It is likely that determinant cultivars of soybean finish all their vegetative growth in a set period of time and are not able to recover from stresses of ELT or insufficient water by continuing to create nodes and set pods as indeterminate cultivars.
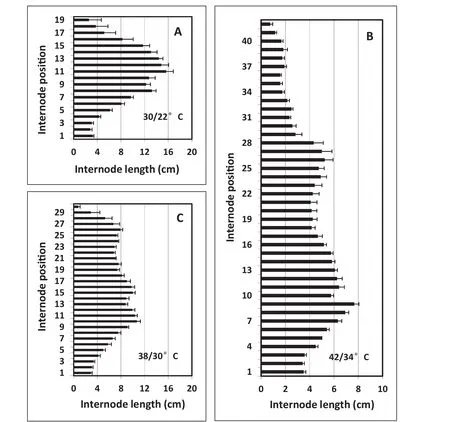
Fig.6–Experiment3,2012.Effectofcontinuouselevated-temperature(ELT)treatmentsfromanearlystageofdevelopment(ninedays after sowing at the VC stage)on final patterns of soybean internode lengths at each internode position number.Seeds were sown on February 15 and data were collected on May 29.Error bars show the standard error of the mean of six plants.
3.6.Environmental factors affect the behavior of soybean stem termination
Maverick is an indeterminate MG III soybean cultivar that is bred for 36–42°N latitudes[32,33].Under normal field growing conditions,this cultivar will have a maximum of 15 to 16 nodes and a plant height of 100 to 120 cm.When it is grown further south,such as at Gainesville,Florida(~30°N latitude),node number and plant height should be reduced.
In the present study,however,when Maverick soybean was grown in a greenhouse that excludes all wavelengths of solar ultraviolet radiation[23],the growth habit changed drastically.Even under control growing conditions of 30/22°C,the plant height and number of nodes were greater than anticipated for field-grown plants.With higher temperatures,the effects of environmental factors on plant height(driven mostly by node number)increased further;in particular,the number of nodes increased from 18 to 29 and 40 nodes per plant when temperatures were increased from 30/22°C to 38/30 °C and 42/34 °C,respectively,in EXP 3(Table 1).
One of the changes of plant growth in higher temperatures is delayed stem termination[30].In EXP 1,the plants grown at 30/22 °C and 34/26 °C showed a determinate growth habit(Fig.8-A–B)despite greater plant height than the 42/34 °C treatment(Table 1).However,in plants grown under 38/30°C or 42/34°C ELT conditions,which reduced reproduction,new nodes continued to be initiated owing to flower abortion,and plants exhibited a more typical indeterminate growth habit(Fig.8-D).This phenomenon demonstrates how determinacy and fitness are modulated by temperature stress,a phenomenon similar to that seen with altered photoperiods[20,21,34].
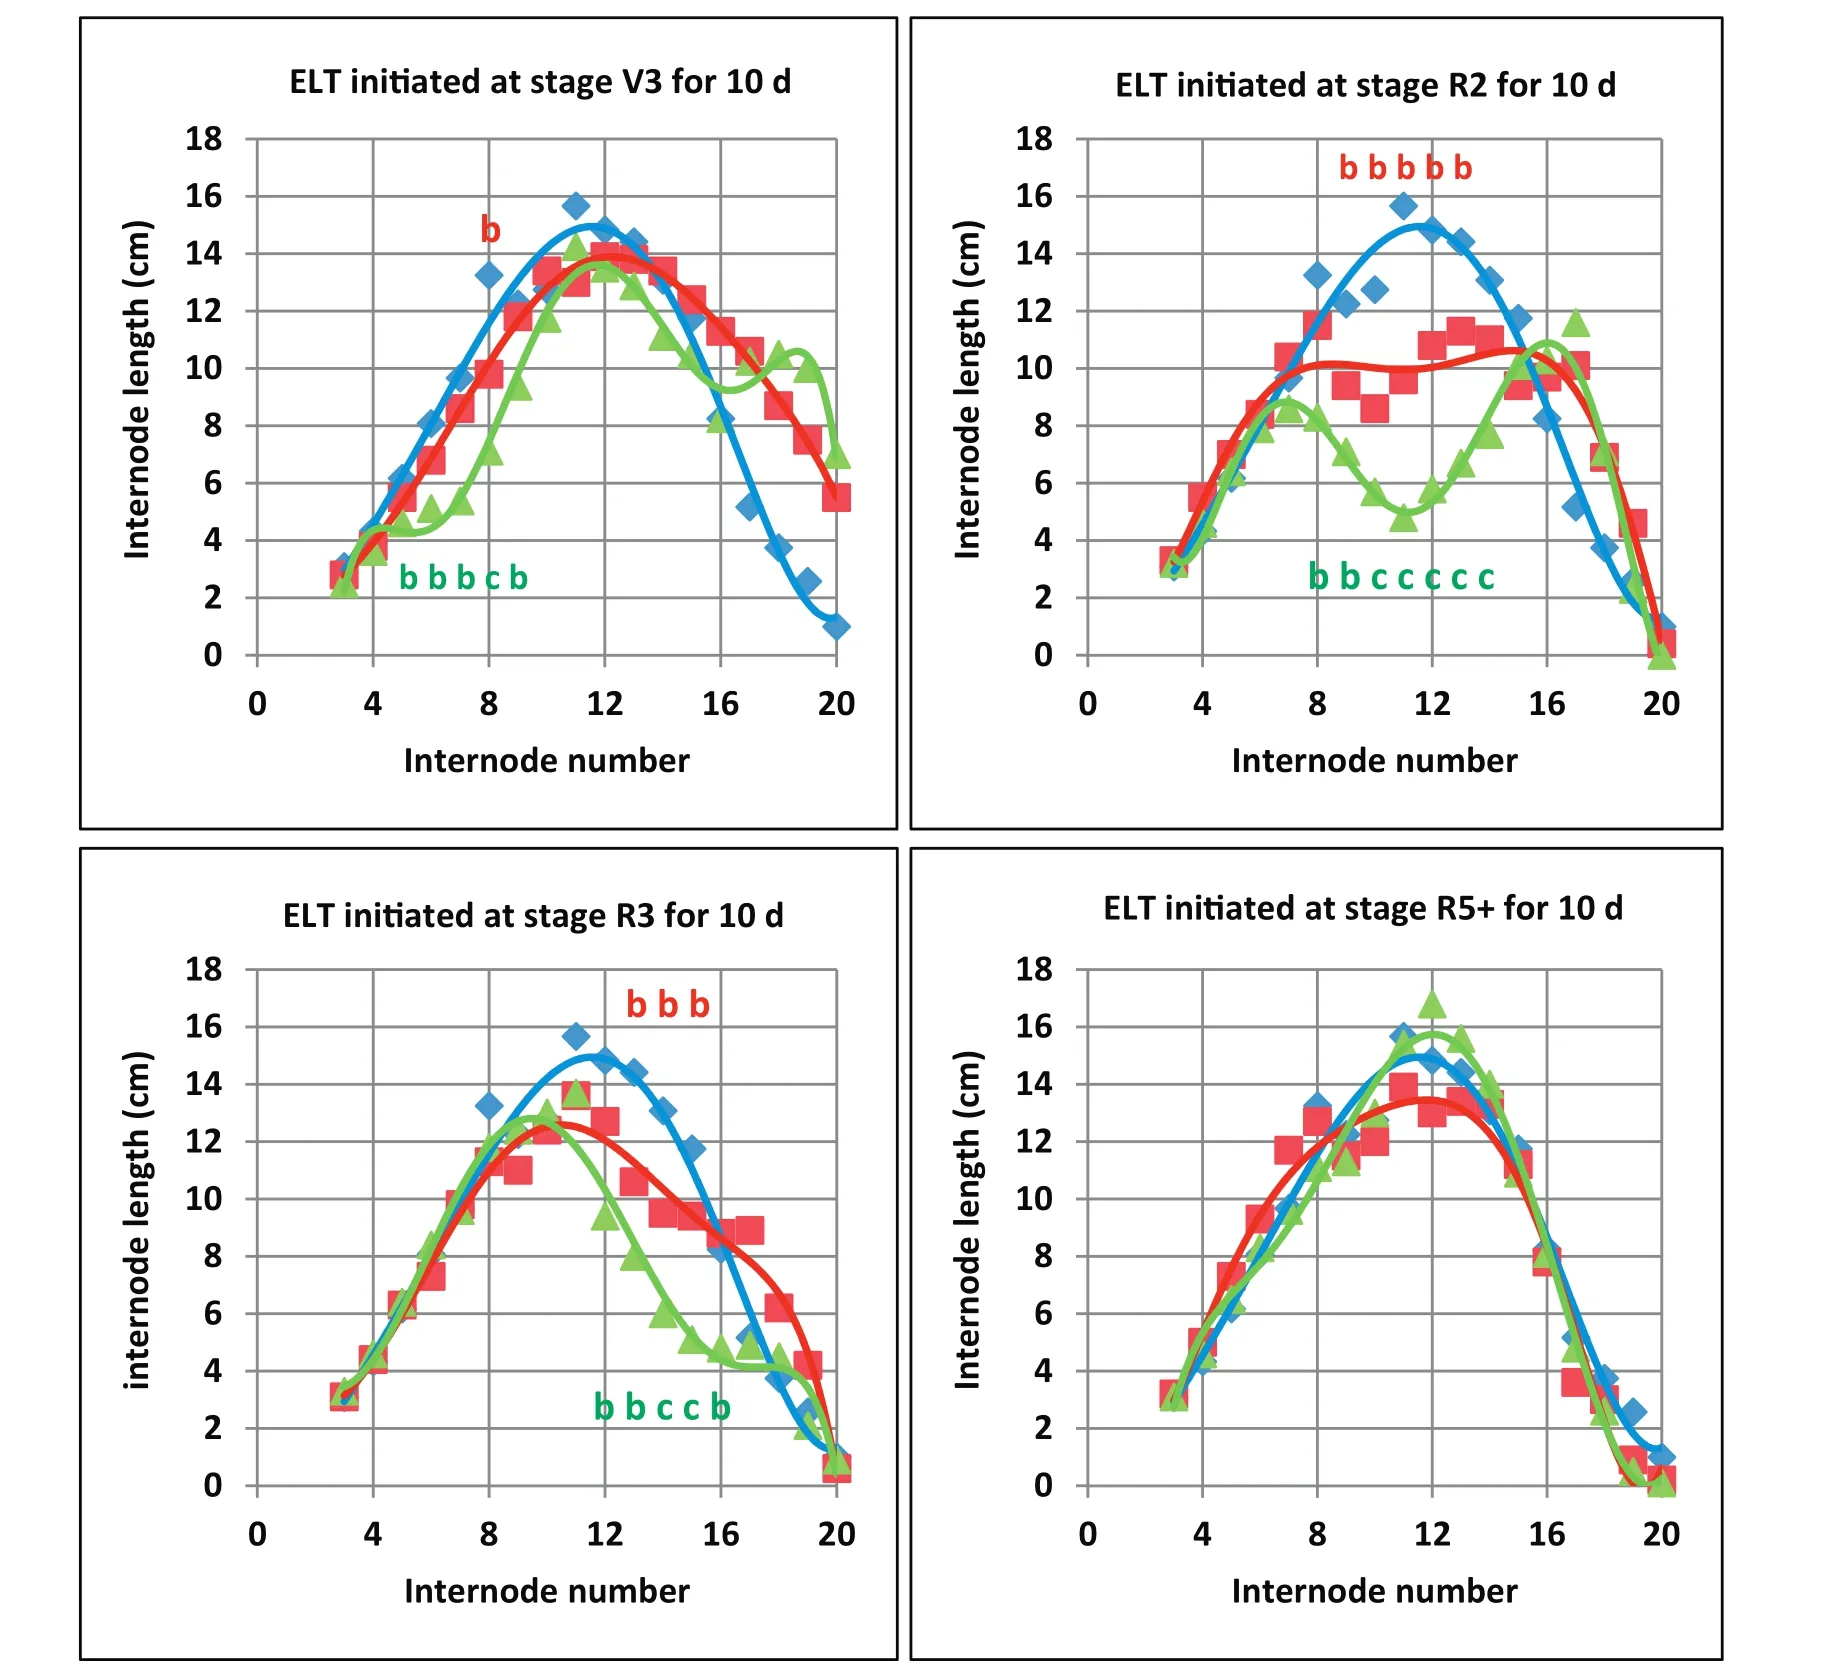
Fig.7–Experiment 3,2012.Effect of short-term elevated temperatures(ELT)on final patterns of soybean internode position number and internode length when treatments were imposed at four different stages of development.Seeds were sown on 15 February and data were collected on 29 May.Plants were grown initially under control temperature(30/22°C;blue lines and diamond points).At stages V3(15 days after sowing,DAS),R2(23 DAS,V6),R3(32 DAS,V10)and R5+(48 DAS,V16-V17),plants were transferred to rooms with two ELT treatments(38/30 °C:red lines and square points)and(42/34 °C:green lines and triangular points)for 10 days,and then they were returned back to control temperature.The expression of short-term ELT treatment effects on decreasing internode length was delayed by about 3 to 4 nodes or V-stages.Lower case letters“b”indicate values of internode lengths that were significantly different from long-term control temperature(30/22°C)internode lengths(blue points).Lower case letters “c” indicate values of internode lengths of the 10-day,42/34 °C ELT treatment that were significantly different from those of both the control temperature(30/22 °C)and the 10-day,38/30 °C temperature treatment.The Tukey Studentized Range(HSD)Test was used to identify differences.
3.7.Comprehensive environmental effects on resource partitioning regulate the pattern of internode elongation and node formation
In this study,increasing growth temperatures delayed the maturity process,causing more vegetative growth.This phenomenon is found in other circumstances such as under long-day conditions.Under such environmental conditions,the plant partitioning of photoassimilates is altered to permit continued vegetative growth.
Under usual circumstances,a plant experiences a period of vegetative growth before receiving an environmental signal,such as a gradually shortened photoperiod or lower temperature,to begin flowering.After receiving the environmental signal,the plant switches into reproductive development and partitions photoassimilates into reproductive organs,namely pods and seeds instead of vegetative organs(leaves,stems,and branches).If this signal is missing or blocked by environmental stress,vegetative organs remain strong sinks and continue to take up photoassimilates,delaying reproductive growth and maturity[35–38].
The ELT imposed in this study seems to have blocked or attenuated this signal,extending vegetative growth and photoassimilate demand by inducing more nodes and internodes.On the other hand,the processes of pod formation and seed formation were inhibited under ELT,possibly through pollination failure and flower abortion[3].Therefore,the plants continued vegetative growth and initiated more nodes.
3.8.Pod number per plant relationships among temperature treatments and stages of development
Long-term temperature treatments initiated after seeds were set in EXP 2(at stage R5+)showed relatively small effects on total pod number per plant(pods either mature or with full-sized green seed at final harvest).There was a large increase from the 30/22 °C treatment(120)to the 34/26 °C treatment(161),followed by a decline for the 38/30°C(121)and the 42/34°C treatment(95)(Table 1).The groupings of Tukey's Studentized Range(HSD)Test indicated that total pod number per plant under the 34/26°C treatment was greater than that under the 42/34°C treatment,but not significantly different from those under the other temperature treatments.A separate ANOVA using only the four sets of data of EXP 2 resulted in the same Tukey grouping with a slightly higher minimum significant difference of 62.0,versus 56.1.
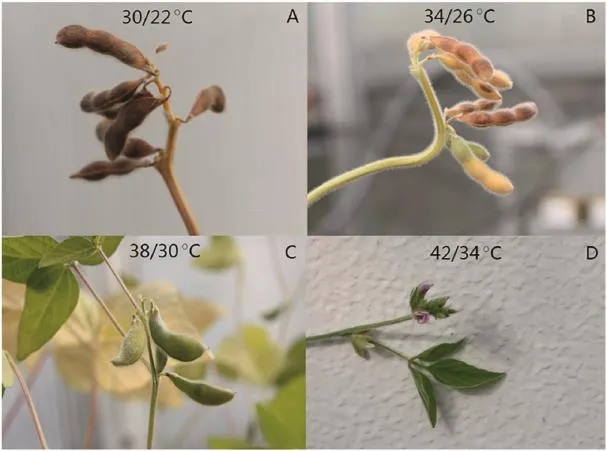
Fig.8–Effect of increasing temperature regimes on stem tip status at the end of Experiment 1(2011)for a soybean maturity group III(cv.Maverick).A,B,C,and D show the stem termination status when the plant was grown at temperature regimes of 30/22 C,34/26 °C,38/30 °C,and 42/34 °C,respectively.Elevated temperature treatments were imposed at 23 days after sowing(approximately at R1 reproductive stage corresponding to V6 vegetative stage).Plants in A and B showed no vegetative growth at the tips of stem,plants in C showed end of vegetative growth on the tip of stem but leaf retained,and plants in D showed continuous vegetative growth at the tip of the stem at the end of experimental period.
In EXP 2 and EXP 1(September 15,2011 and May 16,2012 sowings,respectively),the total pod numbers per plant under the long-term 34/26 °C treatments were 34%–41%greater than those under the long-term 30/22°C treatments.This finding suggests that a 4°C rise in temperature might actually increase soybean crop yields(providing that the growing season is long enough and soil water is sufficient,and seed size remains unchanged).However,Baker[13],Pan[30],Thomas[39],and Thomas et al.[40,41]reported that seed size is reduced with ELT.Generally,the number of mainstem internodes,the mainstem length,and the total number of pods per plant were greatest for EXP 1(Table 1).EXP 1 had a longer photoperiod and more incoming solar radiation(Fig.1)than did EXP 2 or EXP 3.
In EXP 1(sowing date May 16,2011)the final harvest of the 38/30°C treatment was sampled on September 22 rather than September 9.The later harvest date(September 22)resulted in five more nodes per plant for the 38/30°C treatment than on the September 9 harvest date and almost the same total number of pods as for the 34/26°C treatment.This finding suggests that increases in temperature might not decrease soybean yields if the growing season could be extended.
Long-term ELT treatments of 42/34°C always resulted in zero pod set when initiated at or before the R1 stage of development(EXP 1 and EXP 3 of Table 1).This finding indicates that soybean yields would eventually fail completely if future temperatures rise too high.
Short-term(10 days)temperature increases from 30/22°C to 38/30°C at the R2 and R3 stages of development caused a significant increase in soybean total pod numbers per plant based on Tukey's Studentized Range(HSD)Test comparisons in an ANOVA including only short-term ELT treatments and the continuous base 30/22°Ctreatment.None ofthe othershort-term ELT treatments yielded total pod numbers per plant that were significantly different from those under the continuous base 30/22°C treatment.This finding suggests again that soybean yields might not be decreased by short-term ELTduring the early stages of reproductive growth.It is worth noting that the total pod number per soybean plant ofthe 30/22°C treatment was lower in EXP 3 than in EXP 2.
Neglecting the temperatures of complete failure of seed set(in EXP1 and EXP3)the total pod numbers per plant were linearly related to mainstem internode(and node)numbers per plant(y=7.02x−3.90;R2=0.45)and mainstem length(y=0.687x+18.3;R2=0.43).Mainstem length was also linearly related to mainstem internode numbers per plant(y=7.500x+23.9;R2=0.56).Total pod numbers per plant were related to long-term temperature treatments best represented by a second-order polynomial(y=−3.24x2+225x−371;R2=0.62).However,these equations lack data at lower day/night temperatures,such as 26/18 °C and 22/14 °C,which would give better definitions of responses at lower than optimal temperatures,where a response curve based on Tmaximumand Toptimumsuch as that of Yan and Hunt[42]would apply.
Soybean phenology responses(increases in node numbers and pod numbers in response to temperature,photoperiod,MG,or planting density)have been reported many times[22,36,43,44].In agreement with our findings,in an experiment with day/night temperatures ranging from 28/18 °C to 44/34 °C in 4 °C steps,total pods per plant were greatest at 40/30 °C[30].However,increasing temperatures also led to decreased seed growth rates,decreased weight per seed,and increased percentage of shrunken seeds,resulting in maximal seed yields at 36/26 °C[1,3,30,39–41].Thus,mild global warming could actually lead to increasing soybean yields owing to increasing pod set in northern reaches of current soybean production zones.
4.Conclusions
The results from this study indicate that ELT not only decreased soybean internode lengths,but also caused more nodes to be initiated and developed.This effect was readily apparent because of the expanded growth of internodes,caused by a depletion of solar ultraviolet radiation in the growth rooms.Timing of ELT treatment significantly affected soybean internode length and final number of nodes.Early ELT treatment beginning soon after plant emergence had greater effects,whereas relatively late treatment,such as at the pod development stage,resulted in smaller effects.Greater ELT intensity significantly diminished internode lengths and increased final node numbers.Effects of shortterm ELT treatments on growth dynamics of internode elongation are apparently complex.The final plant height was dependent on the combined effects of the intensity and duration of temperature treatments,as well as the timing of ELT.With temperature at the highest intensity(42/34°C),internode elongation was reduced,so that,despite the production of more nodes,plants remained relatively short.Total pod numbers per plant were linearly related to node numbers per mainstem.Results from this experiment shed light on the complex phenomenon of soybean response to various environmental conditions.Mild global warming might not threaten,but actually increase,yields of soybean in northerly zones where this crop is currently grown at slightly suboptimal temperatures(depending on cultivar sensitivity to photoperiod,temperature,and solar radiation factors[44].However,global warming would threaten soybean yields in warmer climates.This research also provides useful information enabling crop modelers to assess accurately the environmental effects on soybean growth and development.Finally,soybean mainstem lengths were greater in this greenhouse experiment than would be found in field studies because of the effect of exclusion of UV-A and UV-B radiation,but not exclusion of blue light or changes in red and far red radiation,by the polycarbonate walls[21].Increased soybean mainstem lengths with decreased UV exposure have been reported in UV exclusion or gradient experiments[45,46]and in blue lightdeficiency studies,which imposed deficiency or lack of UV radiation[47–49].Responses of crop growth and development to UV exclusion have been reviewed by Liu et al.[50].
We acknowledge the assistance of Yaying Wang,Maritza Romero,John Truett,Barth Gervalis,and Sandra Ionescu in this research.We thank the University of Florida IFAS Facilities,Planning,and Operations team,especially Frank Tipton and Joe Hayden,forleadership in designing and construction ofthe eightroom controlled environment facility.We also appreciate the anonymous reviewers for their valuable comments and constructive suggestions on this manuscript.This research was supported by USDA grant 2008-35100-19244 to the University of Florida,by the University of Florida Agricultural Experiment Station,and by the Center for Medical,Agricultural,and Veterinary Entomology,U.S.Department of Agriculture-Agricultural Research Service,Gainesville,FL,USA.
[1]L.H.Allen,K.J.Boote,Crop ecosystem responses to climate change:soybean,in:K.R.Reddy,H.F.Hodges(Eds.),Climate Change and Global Crop Productivity,CAB International,Wallingford,Oxon,UK 2000,pp.133–160.
[2]U.Cubasch,G.A.Meehl,G.J.Boer,R.J.Stouffer,M.Dix,A.Noda,C.A.Senior,S.Raper,K.S.Yap,A.Abe-Ouchi,S.Brinkop,M.Claussen,M.Collins,J.Evans,I.Fischer-Bruns,G.Flato,J.C.Fyfe,A.Ganopolski,J.M.Gregory,Z.Z.Hu,F.Joos,T.Knutson,R.Knutti,C.Landsea,L.Mearns,C.Milly,J.F.B.Mitchell,T.Nozawa,H.Paeth,J.Räisänen,R.Sausen,S.Smith,T.Stocker,A.Timmermann,U.Ulbrich,A.Weaver,J.Wegner,P.Whetton,T.Wigley,M.Winton,F.Zwiers,Projections of future climate change,in:J.T.Houghton,Y.Ding,D.J.Griggs,M.Noguer,P.J.van der Linden,X.Dai,K.Maskell,C.A.Johnson(Eds.),Climate Change 2001:The Scientific Basis.Contribution of Working Group I to the Third Assessment Report of the Intergovernmental Panel on Climate Change,Cambridge University Press,Cambridge,UK and New York,NY,USA 2001,pp.525–582.
[3]K.J.Boote,L.H.Allen,P.V.V.Prasad,J.T.Baker,R.W.Gesch,A.M.Snyder,D.Pan,J.M.G.Thomas,Elevated temperature and CO2impacts on pollination,reproductive growth and yield of several globally important crops,J.Agric.Meteorol.60(2005)469–474.
[4]B.Schauberger,S.Archontoulis,A.Arneth,J.Balkovic,P.Ciais,D.Deryng,J.Elliott,C.Folberth,N.Khabarov,C.Muller,T.A.M.Pugh,S.Rolinski,S.Schaphoff,E.Schmid,X.Wang,W.Schlenker,K.Frieler,Consistent negative response of US crops to high temperatures in observations and crop models,Nat.Commun.8(2017)13931.
[5]K.J.Boote,L.H.Allen Jr.,P.V.Vara Prasad,J.W.Jones,Testing Effects of Climate Change in Crop Models,in:D.Hillel,C.Rosenzweig(Eds.),Handbook of Climate Change and Agroecosystems,Imperial College Press,London,UK 2011,pp.109–129.
[6]G.A.Meehl,C.Tebaldi,More intense,more frequent,and longer lasting heat waves in the 21st century,Science 305(2004)994–997.
[7]N.C.Lau,M.J.Nath,A model study of heat waves over North America:meteorological aspects and projections for the twenty-first century,J.Clim.25(2012)4761–4784.
[8]T.Cowan,A.Purich,S.Perkins,A.Pezza,G.Boschat,K.Sadler,More frequent,longer,and hotter heat waves for Australia in the twenty-first century,J.Clim.27(2014)5851–5871.
[9]G.Ouzeau,J.M.Soubeyroux,M.Schneider,R.Vautard,S.Planton,Heat waves analysis over France in present and future climate:application of a new method on the EUROCORDEX ensemble,Clim.Serv.4(2016)1–12.
[10]P.H.van Schaik,A.H.Probst,Effects of some environmental factors on flower production and reproductive efficiency in soybeans,Agron.J.50(1958)192–197.
[11]M.E.Pereira-Flores,F.Justino,U.M.Ruiz-Vera,F.Stordal,A.A.M.Melo,R.A.Rodrigues,Response of soybean yield components and allocation of dry matter to increased temperature and CO2concentration,Aust.J.Crop.Sci.10(2016)808–818.
[12]J.F.Thomas,C.D.Raper Jr.,Morphological response of soybean as governed by photoperiod,temperature,and age at treatment,Bot.Gaz.138(1977)321–328.
[13]J.T.Baker,L.H.Allen,K.J.Boote,P.Jones,J.W.Jones,Response of soybean to air temperature and carbon dioxide concentration,Crop Sci.29(1989)98–105.
[14]R.Ferris,T.R.Wheeler,R.H.Ellis,P.Hadley,Seed yield after environmental stress in soybean grown under elevated CO2,Crop Sci.39(1999)710–718.
[15]W.R.Fehr,C.E.Caviness,Stages of Soybean Development,Special Report No.80,Iowa Agricultural Experiment Station,Ames,IA,USA,1977.
[16]M.H.Siebers,Impacts of heat waves on food quantity and quality of soybean/corn in the midwest at ambient and elevated[CO2](PhD Dissertation)University of Illinois at Urbana-Champaign,Champaign,IL,USA,2014.
[17]M.H.Siebers,C.R.Yendrek,D.Drag,A.M.Locke,L.R.Acosta,A.D.B.Leakey,E.A.Ainsworth,C.J.Bernacchi,D.R.Ort,Heat waves imposed during early pod development in soybean(Glycine max)cause significant yield loss despite a rapid recovery from oxidative stress,Glob.Chang.Biol.21(2015)3114–3125.
[18]F.A.M.Tenorio,Temperature Control of Node Appearance and Initiation in Soybean,(Master Thesis),University of Nebraska-Lincoln,Lincoln,NE,USA.
[19]L.G.Heatherly,J.R.Smith,Effect of soybean stem growth habit on height and node number after beginning bloom in the midsouthern USA,Crop Sci.44(2004)1855–1858.
[20]L.Zhang,Planting date effect on after-flowering partition on different soybeans maturity groups and stem-termination,Agric.J.1(2006)64–71.
[21]L.Zhang,R.Wang,J.D.Hesketh,Effects of photoperiod on growth and development of soybean floral bud in different maturity,Agron.J.93(2001)944–948.
[22]D.B.Egli,The relationship between the number of nodes and pods in soybean communities,Crop Sci.53(2013)1668–1676.
[23]L.Zhang,L.H.Allen,M.M.Vaughan,B.A.Hauser,K.J.Boote,Solar ultraviolet radiation exclusion increases soybean internode lengths and plant height,Agric.For.Meteorol.184(2014)170–178.
[24]R.J.List,Smithsonian Meteorological Tables,6th Edition Smithsonian Institution Press,Washington,D.C.,USA,1971.
[25]J.D.Hesketh,D.L.Myhre,C.R.Willey,Temperature control of time intervals between vegetative and reproductive events in soybeans,Crop Sci.13(1973)250–254.
[26]T.R.Sinclair,Leaf area development in field-grown soybeans,Agron.J.76(1984)141–146.
[27]D.G.Lloyd,Sexual strategies in plants:a hypothesis of serial adjustment of maternal investment during one reproductive session,New Phytol.86(1980)69–79.
[28]D.J.Major,D.R.Johnson,J.W.Tanner,I.C.Anderson,Effects of daylength and temperature on soybean development,Crop Sci.15(1975)174–179.
[29]L.X.Zhang,R.F.Wang,J.D.Hesketh,Separating photoperiod and temperature effects on the degree day requirement for floral events in soybean,Biotronics 24(1995)59–64.
[30]D.Pan,Soybean Responses to Elevated Temperature and Doubled CO2(PhD dissertation)University of Florida,Gainesville,FL,USA,1996.
[31]R.L.Bernard,Two genes affecting stem termination in soybeans,Crop Sci.12(1972)235–239.
[32]W.O.Scott,S.R.Aldrich,Modern Soybean Production,S&a Publications,Champaign,IL,USA,1970.
[33]L.X.Zhang,S.K.Boahen,J.Zhang,M.H.Zhang,B.Freeland,C.E.Watson,X.M.Liu,Modifications of optimum adaptation zones for soybean maturity groups in the USA,Online 6(2007)(Crop Management(Electronic resource))https://doi.org/10.1094/CM-2007-0927-01-RS.
[34]Y.Jiang,C.Wu,L.X.Zhang,P.Hu,W.Hou,W.Zu,T.Han,Long-day effects on the terminal inflorescence development of a photoperiod sensitive soybean[Glycine max(L.)Merr.]variety,Plant Sci.180(2011)504–510.
[35]T.Han,C.Wu,Z.Tong,R.S.Mentreddy,K.Tan,J.Gai,Postflowering photoperiod regulates vegetative growth and reproductive development of soybean,Environ.Exp.Bot.55(2006)120–129.
[36]T.D.Setiyono,A.Weiss,J.Specht,A.M.Bastidas,K.G.Cassman,A.Dobermann,Understanding and modeling the effect of temperature and daylength on soybean phenology under high-yield conditions,Field Crop Res.100(2007)257–271.
[37]M.Hasanuzzaman,K.Nahar,M.M.Alam,R.Roychowdhury,M.Fujita,Physiological,biochemical,and molecular mechanisms of heat stress tolerance in plants,Int.J.Mol.Sci.14(2013)9643–9684.
[38]M.Nico,A.I.Mantese,D.J.Miralles,A.G.Kantolic,Soybean fruit development and set at the node level under combined photoperiod and radiation conditions,J.Exp.Bot.67(2016)365–377.
[39]J.M.G.Thomas,Impact of Elevated Temperature and Carbon Dioxide on Development and Composition of Soybean Seed(PhD Dissertation)University of Florida,Gainesville,FL,USA,2001.
[40]J.M.G.Thomas,K.J.Boote,L.H.Allen,M.Gallo-Meagher,J.M.Davis,Effects of elevated temperature and carbon dioxide on soybean seed composition and transcript abundance,Crop Sci.43(2003)1548–1557.
[41]J.M.G.Thomas,K.J.Boote,D.Pan,L.H.Allen,Elevated temperature delays onset of reproductive growth and reduces seed growth rate of soybean,J.Agron.Crop Sci.1(2010)19–32.
[42]W.Yan,L.A.Hunt,An equation for modeling the temperature response of plants using only the cardinal temperatures,Ann.Bot.84(1999)607–614.
[43]J.Wang,B.A.McBlain,J.D.Hesketh,J.T.Woolley,R.L.Bernard,A data base for predicting soybean phenology,Biotronics 16(1987)25–38.
[44]E.R.Cober,D.F.Curtis,D.W.Stewart,M.J.Morrison,Quantifying the effects of photoperiod,temperature and daily irradiance on flowering time of soybean isolines,Plants 3(2014)476–497.
[45]K.Guruprasad,S.Bhattacharjee,S.Kataria,S.Yadav,A.Tiwari,S.Baroniya,A.Rajiv,P.Mohanty,Growth enhancement of soybean(Glycine max)upon exclusion of UV-B and UV-B/A components of solar radiation:characterization of photosynthetic parameters in leaves,Photosynth.Res.94(2007)299–306.
[46]R.H.Biggs,S.V.Kossuth,A.H.Teramura,Response of 19 cultivars of soybean to ultraviolet-B irradiance,Physiol.Plant.53(1981)19–26.
[47]S.J.Britz,J.C.Sager,Photomorphogenesis and photoassimilation in soybean and sorghum grown under broad spectrum or blue-deficient light sources,Plant Physiol.94(1990)448–454.
[48]R.M.Wheeler,C.L.Mackowiak,J.C.Sager,Soybean stem growth under high-pressure sodium with supplemental blue lighting,Agron.J.83(1991)903–906.
[49]T.A.O.Dougher,B.Bugbee,Long term blue light effects on the histology of lettuce and soybean leaves and stems,J.Am.Soc.Hortic.Sci.129(2004)467–472.
[50]X.B.Liu,Y.Qi,K.L.Chin,Growth and development responses to UV-B exclusion in crops,Int.J.Plant Prod.10(2016)543–550.
- The Crop Journal的其它文章
- Genetic diversity assessment of a set of introduced mung bean accessions(Vigna radiata L.)
- Near-infrared reflectance spectroscopy reveals wide variation in major components of sesame seeds from Africa and Asia
- Alternate phenotype–genotype selection for developing superior high-yielding irrigated rice lines
- F unction of the auxin-responsive gene TaSAUR75 under salt and drought stress
- Development and validation of simple sequence repeat markers from Arachis hypogaea transcript sequences
- Soybean hairy roots produced in vitro by Agrobacterium rhizogenes-mediated transformation

