Strain-rate effect on initial crush stress of irregular honeycomb under dynamic loading and its deformation mechanism
Peng Wang·Zhijun Zheng·Shenfei Liao·Jilin Yu
1 Introduction
Cellular materials,such as honeycombs and foams,have excellent mechanical properties in energy absorption and shock mitigation and thus gain much research attention[1,2].The nominal stress–strain relation has been extensively used to depict the quasi-static mechanical behavior of cellular materials,and it has been found to be affected by mesostructural parameters,such as the relative density,cell size,and shape irregularity[3–5].Some constitutive models,such as the Gibson model[1],the Hanssen model[6],and the Liu model[7],have been proposed to describe the quasi-static mechanical behavior of cellular materials under compression.As cellular materials have been widely used in resisting impact/shock loadings,it is of great importance to investigate their dynamic constitutive behavior.Much effort has been made on this issue,but the understanding is still not very clear.Especially,the rate sensitivity of initial crush stress and its deformation mechanism are not clearly understood.The main difficulties may be the representations of local stress and local strain.
Most previous research was focused on the enhanced crushing stress[8–16]and the densification strain[11,14,17–21]of cellular materials under dynamic impact.A large number of experiments have been carried out to study the strain-rate effect of cellular materials,but some conflicting conclusions exist.A strain-rate effect was demonstrated for a closed-cell aluminum foam(Alporas)by Dannemann and Lankford[22].Wang et al.[23]also found that the strength of closed-cell aluminum foam was sensitive to the strain rate,but the condition of stress uniformity was hard to reach especially for a thick foam sample.Deshpand and Fleck[24]found that there was almost no strain-rate effect for Duocel and Alulight aluminum foams.Thus,the strain-rate effect of cellular materials is still not well understood.The traditional split Hopkinson pressure bar(SHPB)method is hard to meet the stress uniformity condition under dynamic impacting and it is difficult to obtain local stress information directly.
Considerable theoretical models have been proposed to describe the dynamic mechanical behaviors of cellular materials,including the mass-spring model[9]and one dimensional shock models[8,17,25–32].However,most shock models are based on the quasi-static stress–strain curve of cellular material instead of a dynamic one,which is difficult to obtain with current experimental techniques.Recently,the dynamic stress–strain response of cellular materials has been widely investigated by many researchers.The work of Zheng et al.[21]studied the dynamic constitutive behaviors of a closed-cell aluminum foam using a 3D Voronoi model numerically and proposed a dynamic rigid-plastic hardening(D-R-PH)material model.The dynamic stress–strain states of cellular material are different from those on the quasi-static stress–strain curve and are related to the impact velocity[21].The dynamic stress–strain behavior of an open-cell aluminum foam was examined by Barnes et al.[20]and Gaitanaros and Kyriakides[33]experimentally and numerically.A similar dependence between the dynamic stress–strain states and the loading velocity was found.Also,Sun et al.[34]demonstrated that a unique linear Hugoniot relation between the shock speed and the impact velocity could be used to characterize the shock constitutive behavior of cellular materials.Some deficiencies still exist in that the shock-enhanced stress was indirectly obtained from the stress at the impact end and the stress–strain history was not clear for the lack of local stress information.Recently,a Lagrangian analysis method was employed to investigate the dynamic constitutive behavior of cellular material by Ding et al.[35].With this method,the local stress and strain information was derived by integrating the particle velocity distribution.But,the direct obtainment of local stress and strain is still desired.
The initial crush stress of cellular material during dynamic loading was announced to be limited to the quasi-static initial crush stress by Barnes et al.[20]and Sun et al.[34],but it was found to be larger than the quasi-static one by Zheng et al.[21]and Ding et al.[35].Furthermore,Sun et al.[34]argued that the derivation of initial crush stress from the momentum conservation equation in the work of Zheng et al.[21]is an indirect measurement that can lead to the overestimation of initial crush stress.In fact,Sun et al.[34]also employed an indirect way of measuring the initial crush stress from the stress at the support end.It might be possible that the contradiction of the initial crush stress is due to the different loading scenarios used by Zheng et al.[21]and Sun et al.[34].Therefore,a clearer understanding of the initial crush stress needs a comprehensive analysis of the two loading scenarios of a same cellular specimen,namely a constant-velocity compression and a direct impact.In this study,the direct information of local stress and strain is obtained to analyze the initial crush stress under the two loading scenarios.
In this study,virtual tests of irregular honeycombs under the two loading scenarios are carried out by using finite element(FE)method.A local strain field calculation method and a cross-sectional stress calculation method are used to acquire local strain/stress information of irregular honey combs under dynamic loadings.Dynamic stress–strain states and the initial crush stresses are obtained and interpreted directly from the combination of the information of local stress and strain.
2 Simulation and calculation methods
2.1 Cell-based finite element model
The 2D Voronoi technique is employed here to construct irregular honeycombs,see Ref.[36]for details.A honeycomb specimen sample is illustrated in Fig.1,which contains 500 cells.The cell irregularity of the specimen is 0.3 and the relative densityρ0/ρsis 0.1,whereρ0is the initial density of the specimen andρsthe density of the base material.The length,width,and thickness of the specimen are50,50,1 mm,respectively.The average cell size,which is defined as the diameter of a circle whose area is equal to the average area of a cell,is about 2.5 mm.
The finite element code ABAQUS/Explicit is employed to perform virtual tests.The material of cell walls is assumed to be elastic,perfectly plastic with Young’s modulusE=66 GPa,Poisson’sratioν=0.3,yield stressσys=175 MPa,and densityρs=2700 kg·m−3.Cell walls are modeled with S4R(a 4-node doubly curved,reduced integration,hourglass control,finite membrane strains)shell elements.The in-plane size of the element is about 0.2 mm,determined through a mesh sensitivity analysis.All nodes are constrained in the out-of-plane direction to simulate a plane strain situation.
Two types of loading scenarios are considered in this study,namely the constant-velocity compression and the direct impact.For the constant-velocity compression scenario,the specimen is placed between two rigid walls.One wall is fixed and the other moves with a constant velocityValong theXdirection,see Fig.1a.For the direct impact scenario,the specimen impinges on the rigid wall with an initial velocityV0,as shown in Fig.1b.Some deformation patterns of the honeycomb specimen under the two loading scenarios withV=V0=200 m·s−1are shown in Fig.2,in which layer-wise crushing deformation bands propagate in the specimen.We use a honeycomb model instead of foam model in this study for applying the strain field calculation method[19]and the cross-sectional stress calculation method[37]more conveniently,which are briefly described below.

Fig.1 Finite element models of an irregular honeycomb under different loading scenarios.a The constant-velocity compression.b The direct impact

Fig.2 Deformation patterns of an irregular honeycomb under different loading scenarios.a The constant-velocity compression with V=200 m·s−1.b The direct impact with V0=200 m·s−1
2.2 Strain field calculation method
The local strain field calculation method for irregular honeycombs was developed by Liao et al.[19]through the determination of discrete local deformation gradients based on the least squares method.The optimal deformation gradient at a corner nodeiis expressed as


Fig.3 Variations of local strain with impact time under two loading scenarios.a The constant-velocity compression with V=200 m·s−1.b The direct impact with V0=200 m·s−1


where I is the identity matrix.The frequently used local engineering strain in the Cartesian direction ofXα(α=1,2,3)at a given node is given by

whereEααis the diagonal term of E in theXαdirection.The engineering strain is taken as positive in compression.A one-dimensional strain distribution in the loading direction is obtained by averaging the local engineering strain along theYdirection.Through the error analysis[38],the optimal cut-off radius was found to be about 1.5 times of the average cell radius based on the reference configuration and 0.5 times of the average cell radius based on the current configuration.
In this study,the local strain distribution information and the strain history relation with time at any specified position are obtained by this local strain calculation method.The strain rate information can be obtained from the differential of strain with time.Figure 3 shows the history variations of local strain under the two loading scenarios withV=V0=200 m·s−1.The local strain at any specified cross-sectional position changes sharply from the initial crush strain to the densification strain and keeps at the level of densification.
2.3 Cross-sectional stress calculation method
For the case of honeycombs under dynamic compression,one-dimensional approximation is usually appropriate,and then the one-dimensional stress distribution can be acquired from the results of numerical simulation,as done in our previous work[37].The 1D engineering stress along the impact direction is calculated as the cross-sectional internal force at a Lagrangian position divided by the initial cross-sectional area of the honeycomb.The cross-sectional internal force is calculated by the summation of two parts of forces.One part,namely the nodal force,is caused by the force transferred through the element nodes of the base material,and the other,namely the contact force,is caused by cell-wall contact during the deformation.The nodal force and the contact force of the cross-section,denoted asFnxandFcx,can be calculated by


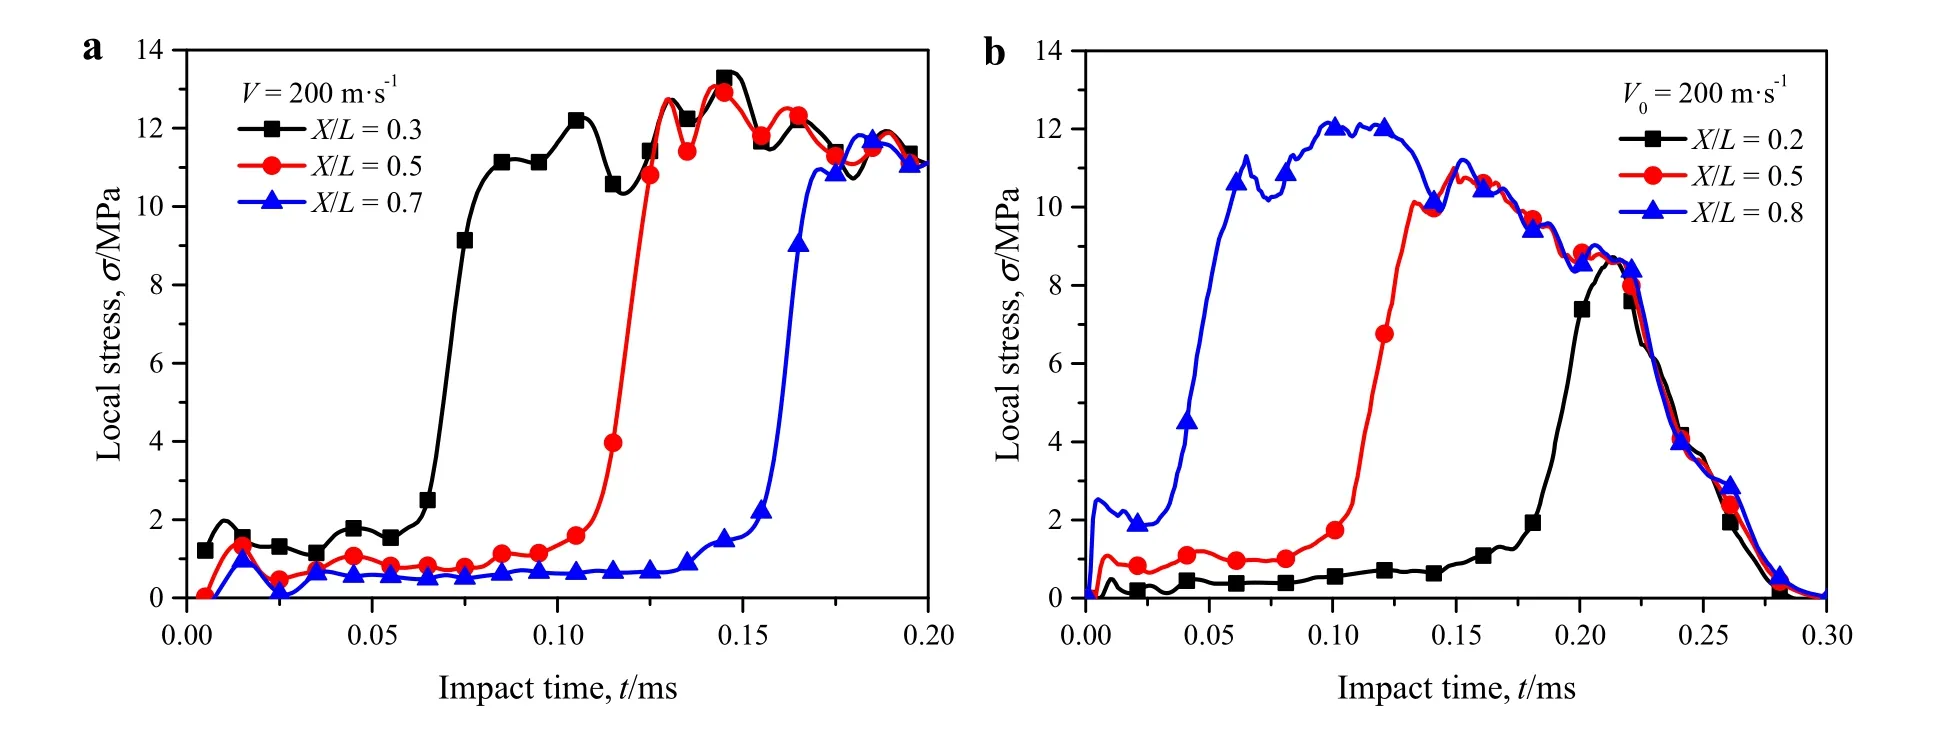
Fig.4 Variations of local stress with impact time under two loading scenarios.a The constant-velocity compression with V=200 m·s−1.b The direct impact with V0=200 m·s−1
where the node-transitive stressσnx=Fnx/A0and the contact-induced stressσcx=Fcx/A0withA0being the initial cross-sectional area.
Figure 4 shows the history variations of local stress under the two loading scenarios withV=V0=200 m·s−1.Under constant-velocity compression,the stress at a specified position increases sharply from the initial crush state to a densification state and then remains almost unchanged,as shown in Fig.4a.Under direct impact,the stress at a specified position also rises from the initial crush state to a densification state,but it is unloaded from the densification state to zero due to the existence of free end,as shown in Fig.4b.
3 Results
3.1 Initial crush stress under constant-velocity compression
The stress–strain history relation can be obtained by eliminating the impact time from the strain and stress variation data at different cross-sectional positions. It turns out that the stress–strain history curves at a specific impact velocity are almost the same regardless of the position of the cross-section in the constant-velocity compression case.Figure5 shows the averaging stress–strain history curves of different Lagrangian cross-sections at different impact velocities.When the impact velocity is low,the stress–strain history curve almost overlaps the quasi-static stress–strain curve,see Fig.5a.This indicates that the deformation mechanism is the same as the quasi-static mode and the macroscopic mechanical equilibrium is approximately satisfied,wherein the effect of the loading velocity can be neglected.When the impact velocity is moderate or high,three distinct stages,i.e.the elastic,plastic collapse and compacting stages,can be observed in Fig.5b,c.Under a moderate velocity impact,the initial crush stress is almost the same as that for the quasi-static situation.But under a high velocity impact,an intense stress oscillation occurs within an extremely small strain and returns to a quasi-static level before the yield state happens.This phenomenon happens before the collapse of the corresponding cross-section and can be explained by Fig.6,which shows the variations of the node-transitive stress,contact-induced stress,cross-sectional stress at the middle cross-section and the nominal stress at the impact end with time at an impact velocity of 200 m·s−1.Once the rigid surface contacts the specimen,the nominal stress at the impact end increases dramatically and then maintains the level of densification stress.The stress wave is generated at the impact end immediately and propagates along the impact direction.The stress oscillation caused by the contact at the impact end may affect the stress at the investigated cross-section through the node transferring.Thus,the node-transitive stress at the middle cross-section increases to a peak rapidly when the stress wave arrives,and then remains almost unchanged until the cross section starts to be crushed and compacted,see Fig.6.It indicates that the middle cross-section has already entered the plastic yield state before the onset of the plastic collapse stage when the shock wave arrives.The initial crush stress is found to be almost the same as the quasi-static crush stress,as shown in Fig.5c.It is evident in Fig.5 that the initial crush stress in this loading scenario is almost identical to the quasi-static initial crush stress,as found by Barnes et al.[20]and Sun et al.[34],who detected the initial crush stress from the support end of cellular specimen.
In the plastic collapse stage,the stress increases almost linearly from the initial crush stress to the densification stress along the stress–strain history curve.The stress–strain path in this stage corresponds to the Rayleigh line expressed in the shock theory.The slope of the Rayleigh line increases with the increase of impact velocity,which indicates that a higher impact velocity corresponds to a higher shock wave speed.In the compacting stage,the specimen has been densified and the stress increases sharply with the increase of strain.The critical point just before the compacting stage in the local strain–stress history curve can be used to characterize the stress–strain state behind the shock front for the honeycombs under a moderate/high impact velocity.
The initial crush stress and stress–strain state points of honeycombs under constant-velocity compression for different impact velocities within the range of 40–200 m·s−1are plotted in Fig.7.It is obvious that dynamic initial crush stress is identical to the quasi-static initial crush stress.Dynamic stress–strain state points show the effect of nonlinear plastic hardening and locate below the quasi-static stress–strain curve.Each state point corresponds to a specific impact velocity and the shock stress and strain increase with the impact velocity,as concluded in Refs.[19–21,33,34].This loading-rate sensitivity is resulted by the different deforma-tion mechanisms of cellular materials at different loading rates,as stated in Ref.[21].
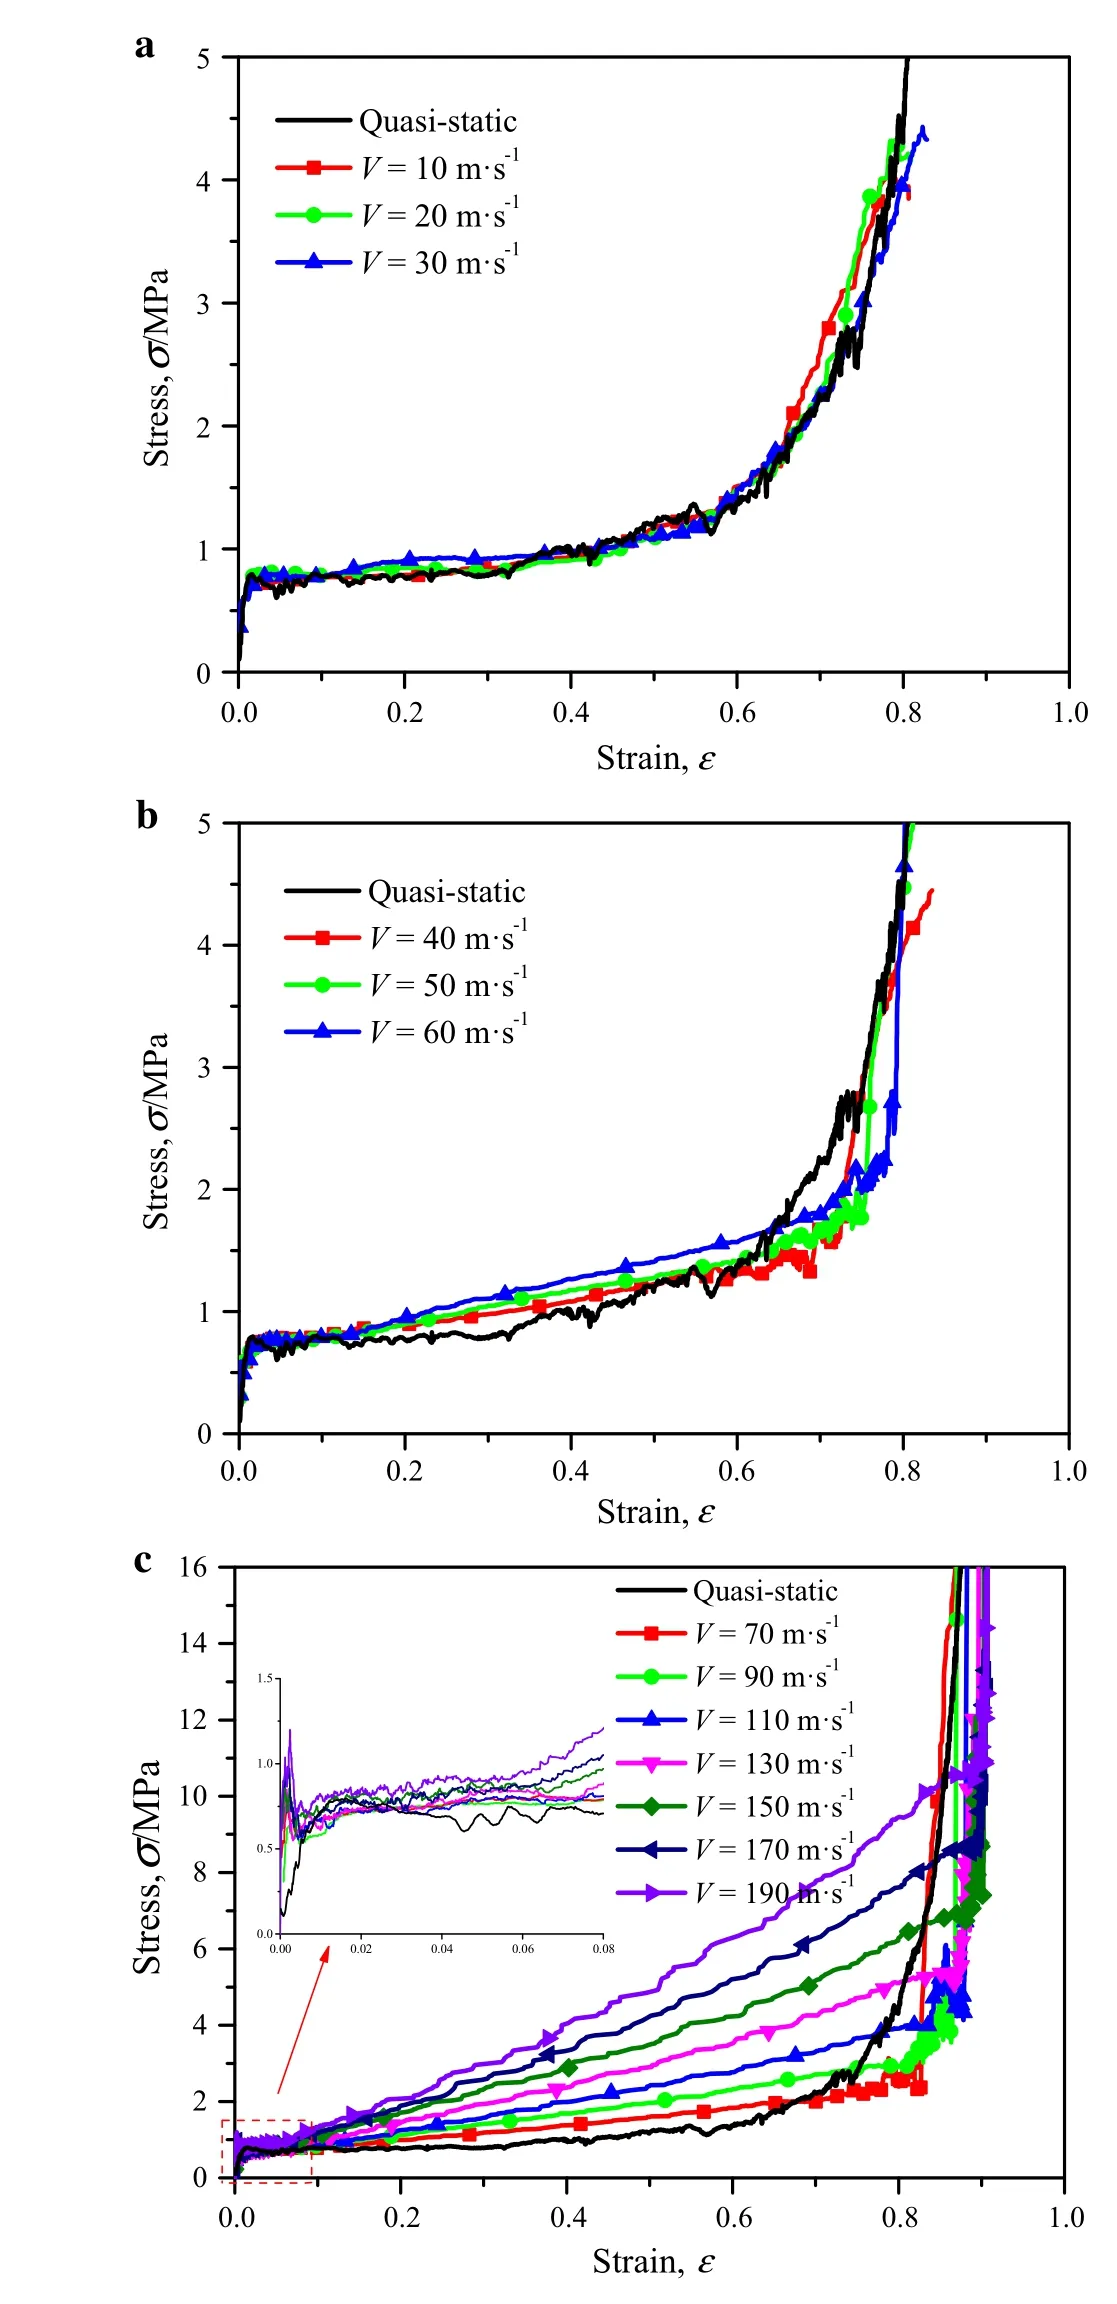
Fig.5 Stress–strain history curves of the honeycomb at a low,b moderate,and c high impact velocities
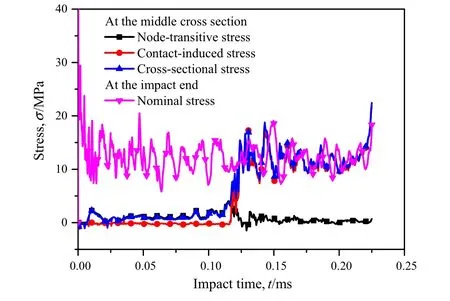
Fig.6 Variations of node-transitive stress,contact-induced stress,cross-sectional stress at the middle cross-section,and the nominal stress at the impact end with time at an impact velocity of 200 m·s−1
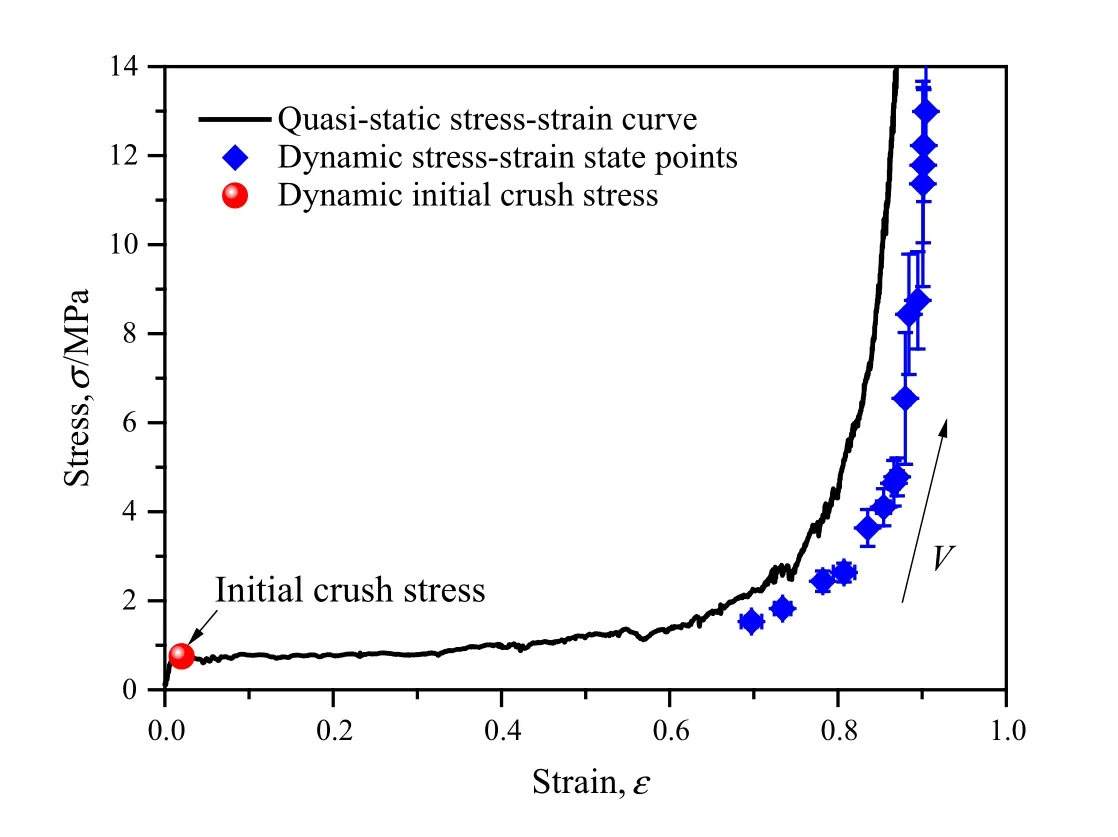
Fig.7 Initial crush stress and stress–strain states of a honeycomb under constant-velocity compression
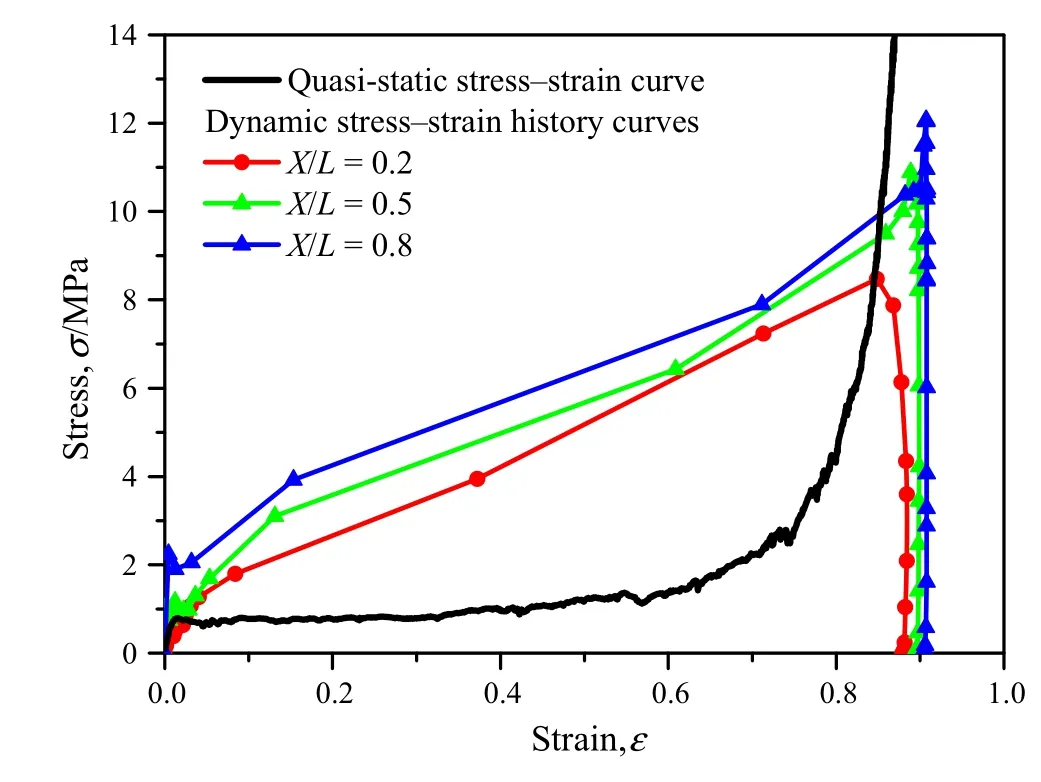
Fig.8 Stress–strain history curves of several Lagrangian positions under direct impact with the initial impact velocity of 200 m·s−1
3.2 Initial crush stress under direct impact
Different loading scenarios have been employed in Refs.[19–21,33,34],and the conclusions about dynamic initial crush stress are conflicting.The dynamic initial crush stress was thought to be the same as quasi-static initial crush stress by Sun et al.[34],while it was found to be larger than quasi-static initial crush stress by Zheng et al.[21].In this study,we consider that the reason might be the difference of loading scenarios.The constant-velocity compression scenario was investigated by Sun et al.[34],which is the same as that considered in Sect.3.1.The conclusion that the initial crush stress in this loading scenario keeps invariable drawn from Sect.3.1 is consistent with Sun et al.[34].The direct impactscenario was considered by Zheng etal.[21],and it is revisited in this section by calculating local stress and strain information to verify our conjecture.
The local stress–strain history curves under direct impact are acquired by eliminating the impact time from strain and stress variations of Figs.3b and 4b,as shown in Fig.8.Three stages,i.e.elastic stage,plastic collapse stage,and unloading stage,are observed in the stress–strain history curves.The initial crush stress is observed to be larger than the quasistatic initial crush stress in the loading scenario.The plastic collapse stage connecting the initial crush state to the densification state reflects the crushing process.The unloading stage from the densification stress to zero is due to the stress unloading from the free end.Here,we use the stress distribution curves in Fig.9 to determine the value of the initial crush stress.
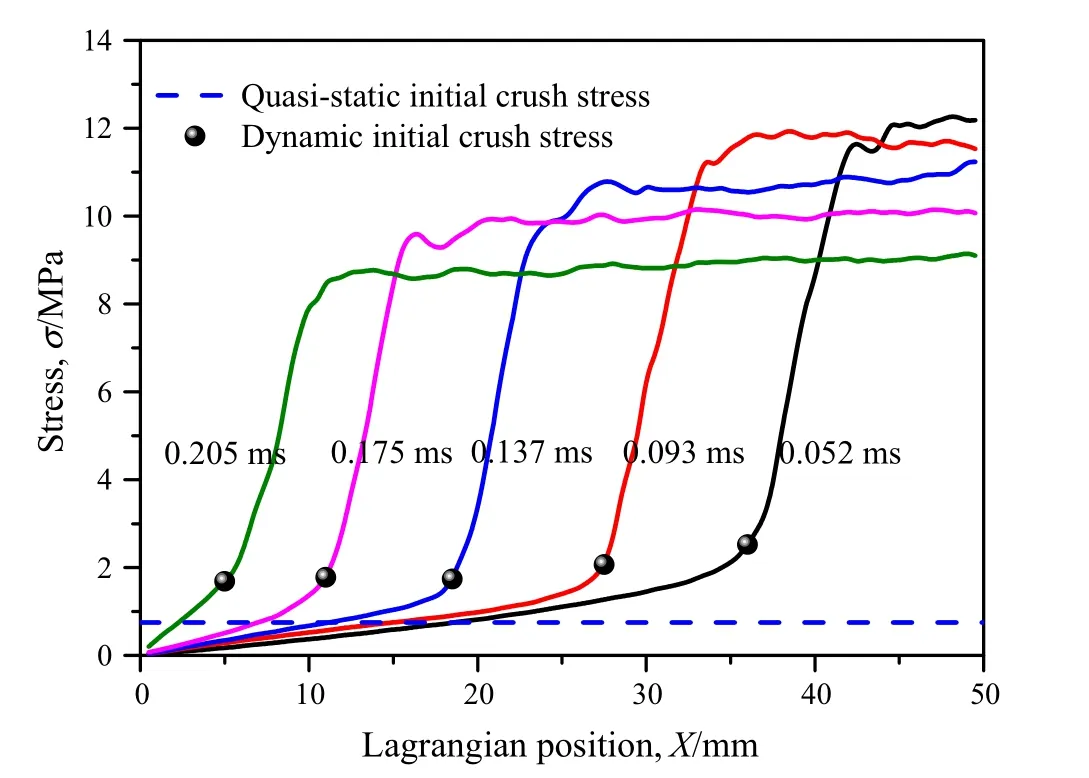
Fig.9 Stress distribution and dynamic initial crush stress under direct impact scenario with the initial impact velocity of 200 m·s−1
Stress distribution at a specific time is significant to understand the information about local stress states of the honeycomb.The stress distributions under direct impact scenario with the initial impact velocity of200 m·s−1are shown in Fig.9.The stress distribution curve is composed of three regions from the figure.A plastic compaction wave region exists,in which the stress changes sharply from initial crush stress to densification stress.The region ahead of the plastic compaction wave has a linear stress distribution from the free end to the position of initial crush.The stress changes linearly from zero to the initial crush stress in this region.The region behind the plastic compaction wave is nearly a plateau stage at the level of densification stress.
The initial crush stress at different impact time is obviously larger than the quasi-static initial crush stress in Fig.9.This conclusion coincides with that of Zheng et al.[21]in which the direct impact scenario of cellular material was considered.
4 Discussion
It has been recognized in Sect.3 that the initial crush stress under constant-velocity compression is identical to the quasistatic one,but less than the one under direct impact.The seemingly conflicting conclusions in Refs.[19–21,33,34]are due to the different loading scenarios used.In further discussion,we will focus on the strain rates at the initial crush states in the two loading scenarios,which may affect the initial crush stresses.We will provide a perspective of strain-rate effect to understand the initial crush stress and its deformation mechanism under dynamic loadings in this section.
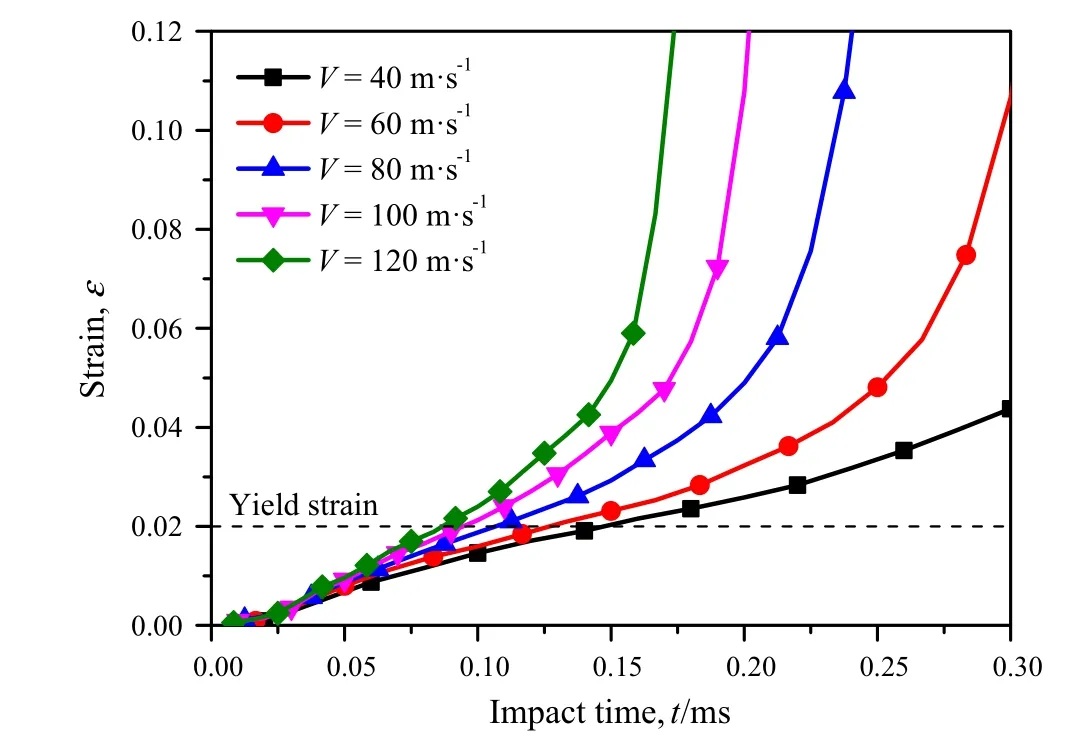
Fig.10 Variations of strain with impact time at the middle position of the specimen under constant-velocity compression scenario
4.1 Strain rate under constant-velocity compression
For the constant-velocity compression scenario,by taking the middle position,i.e.X/L=0.5,as an example,the variations of strain with impact time at several different impact velocities with the strain restricted in a small range are presented in Fig.10.It is observed that the strain increasesal most linearly with the increase of impact time in the stage from the initiation of the deformation to the onset of crushing.This indicates that the corresponding strain rate is invariable in this stage and can be estimated by the slope of the linear segment.In Fig.10,the strain increases at the constant strain rate until the collapse of the cross-section.When the strain increasesto the yield strain(usually taken as0.02),the investigated middle position is in a state of plastic deformation,but still in the linear stage.The variations of strain rate of the linear stage at different impact velocities are shown in Fig.11.Although the strain rate increases with the increase of impact velocity,it is a constant at a specific impact velocity.The strain-rate distribution and the initial crush strain rate under a compression velocity of 200 m·s−1are shown in Fig.12.It is obvious that the whole region in front of the shock wave is in a state of low strain rate and the low strain rate is nearly evenly distributed.It is indicated that no matter how large the impact velocity is,the support end is at a low constant strain rate.Thus,the initial crush stress determined by the support stress in Sun et al.[34]was obtained at a low strain rate and cannot exceed the quasi-static initial crush stress which was determined also at a low strain rate.
4.2 Strain rate under direct impact

Fig.11 Strain rate of the linear stage versus impact velocity before collapse at the middle position under constant-velocity compression scenario
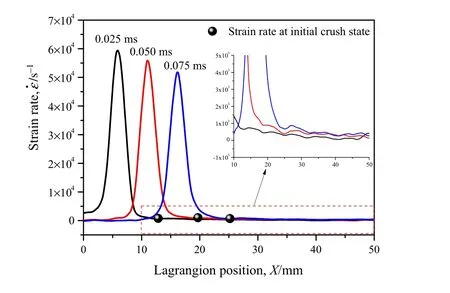
Fig.12 Strain rate distribution and initial crush strain rate under constant-velocity compression of 200 m·s−1
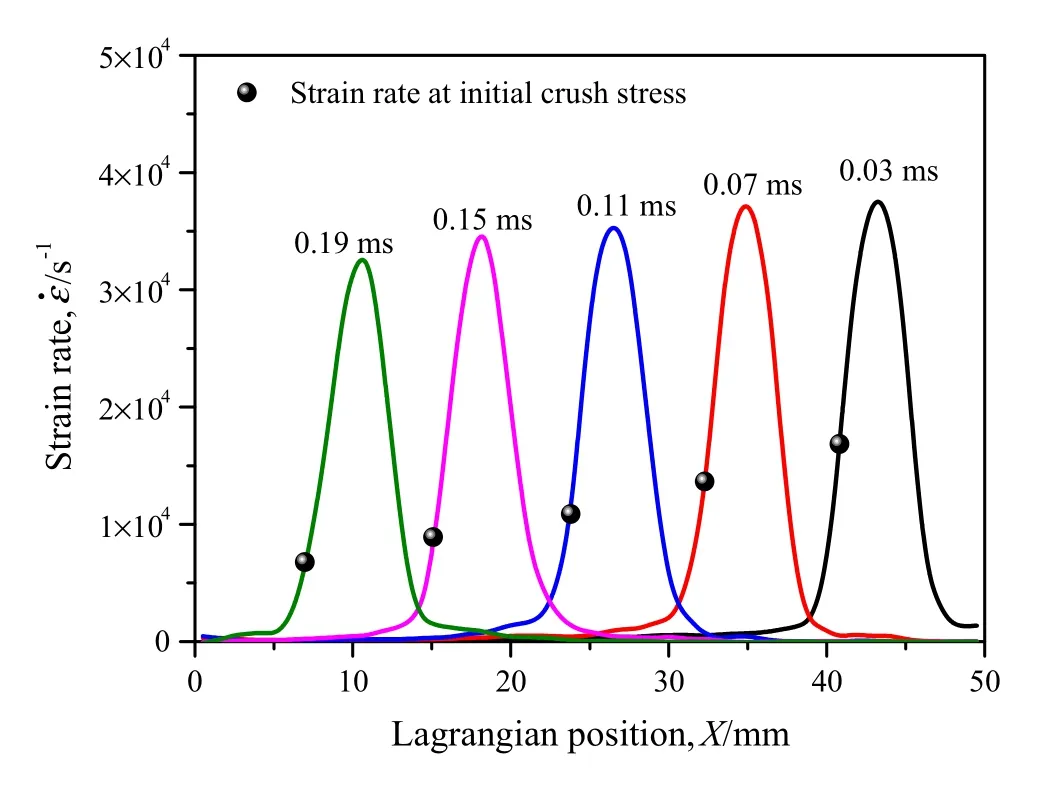
Fig.13 Strain rate distribution and initial crush strain rate under direct impact scenario with an initial impact velocity of 200 m·s−1
For the direct impact scenario,the strain rate distribution and the initial crush strain rate with an initial impact velocity of 200 m·s−1are shown in Fig.13.The strain rate distribution curve is a mountain-like curve with the peak value representing the maximum strain rate at the shock front.In the wave region,the local strain rate changes sharply.The peak point moves to the left with the time increasing,indicating that the wave is propagating from the impact end to the free end.The strain rate of the initial crush state is also shown in Fig.13.The determination of the position of initial crush state is from the critical point connecting the wave region and the region ahead of the wave region in Fig.9.Compared to the initial crush strain rate in the constant-velocity compression scenario shown in Fig.11,the value of the strain rate at initial crush state in the direct impact scenario is extremely large and varies with time.
4.3 Strain rate effect
From the obtained strain rate at initial crush state,it is recognized that the strain rate is a very small constant value(~102s−1)at a specified impact velocity under constant-velocity compression,but the strain rate increases significantly when the material initial crushes under direct impact(103–104s−1).Compared to 104s−1,the constant strain rates of initial crush state under constant-velocity compression shown in Fig.11 are very small.Therefore,the initial crush stress under constant-velocity scenario is identical to the quasi-static one with no strain-rate effect.
Under direct impact,the initial crush stress is larger than the quasi-static one because the strain rate is high and the strain-rate effect on the initial crush stress is obvious.A power-law fitting relation is carried out to characterize the strain-rate effect of strain rate on the initial crush stress,as used by Ding et al.[35].The complete relationship between the initial crush stressσd0and the local strain rate˙εcan be expressed as

whereσq0is the quasi-static initial crush stress,˙ε0a critical strain rate andαa fitting parameter.In this study,the material parameters are obtained asσq0=0.75 MPa,˙ε0=830 s−1,andα=0.307 by the least squares method,see Fig.14.
This finding improves the understanding of the strain rate effect on the initial crush stress and can explain the confliction results between Refs.]and Refs.].The initial crush stress wasthe supporting end in Refs.under constant-velocity compression.It can not exceed quasi-static initial crush stress because the strain rate ahead of the shock front is a constant and small enough to be negligible.However,the initial crush stress can exceed the quasi-static one for the significantly high strain rate under direct impact.
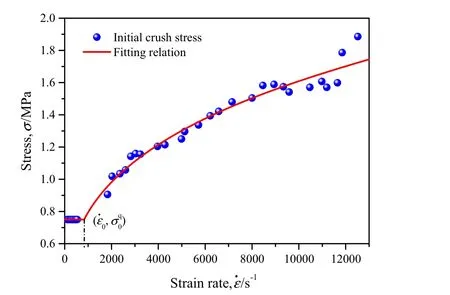
Fig.14 Variations of initial crush stress with strain rate of honeycombs
4.4 Deformation mechanisms
It has been shown that the initial crush stress is influenced by the local strain rate,but it is important to understand the deformation mechanisms of the two loading scenarios and why the initial crush strain rate is different between the two loading scenarios.
We firstly observe the deformation patterns of honeycombs under constant-velocity compression withV=150 m·s−1to understand the different deformation behavior of the region ahead of the plastic compaction wave,see Fig.15.The deformation of the region in the front of plastic crushing bands is visible.Local shear collapse bands appear in this region with the increase of time.Thus,the region in front of the plastic compaction wave is considered to be in the quasi-static mode[36],which can be explained by the velocity and stress distribution curves,respectively.Figure 16 shows the velocity and stress distributions of honeycombs under constant-velocity compression atεN=0.5.The region in front of the plastic compaction wave is in a low-velocity state no matter what the impact velocity is.Moreover,the local stress in this region is almost evenly distributed and is close to the quasi-static initial crush stress.This indicates that the region in front of the plastic compaction wave is in a stress balance state.The difference of the two loading scenarios is whether there is a support end.Under constant velocity compression,the elastic wave can propagate back and forth in the specimen due to the existence of support end.Thus,the stress distribution in the front of plastic compaction wave tends to be stable and uniform.Therefore,the quasi-static deformation mode and constant low strain rate of the region in the front of plastic compaction wave determine the initial crush stress to be at the quasi-static level.So,if we estimate the initial crush stress by the support stress,as done by Sun et al.[34],the initial crush stress is identical to the quasi-static initial crush stress whatever the impact velocity is,see Fig.17.
For the direct impact scenario,the deformation situation in front of the plastic compaction wave becomes different due to the existence of the free end.The deformation patterns presented in Fig.18 indicate that the deformation of the region in the front of plastic compaction wave locates near the plastic crush bands.This means that the stress should increase from the initial crush stress to the densification stress in nearly a cell-size scale.The corresponding velocity distribution is shown in Fig.19.The local velocity of the region in front of the plastic compaction wave is high and this region is in a Shock Mode.In this case,the initial crush stress is larger than the quasi-static initial crush stress due to the high local strain rate and the shock deformation mode.

Fig.15 Deformation patterns of honeycombs under constant-velocity compression with V=150 m·s−1
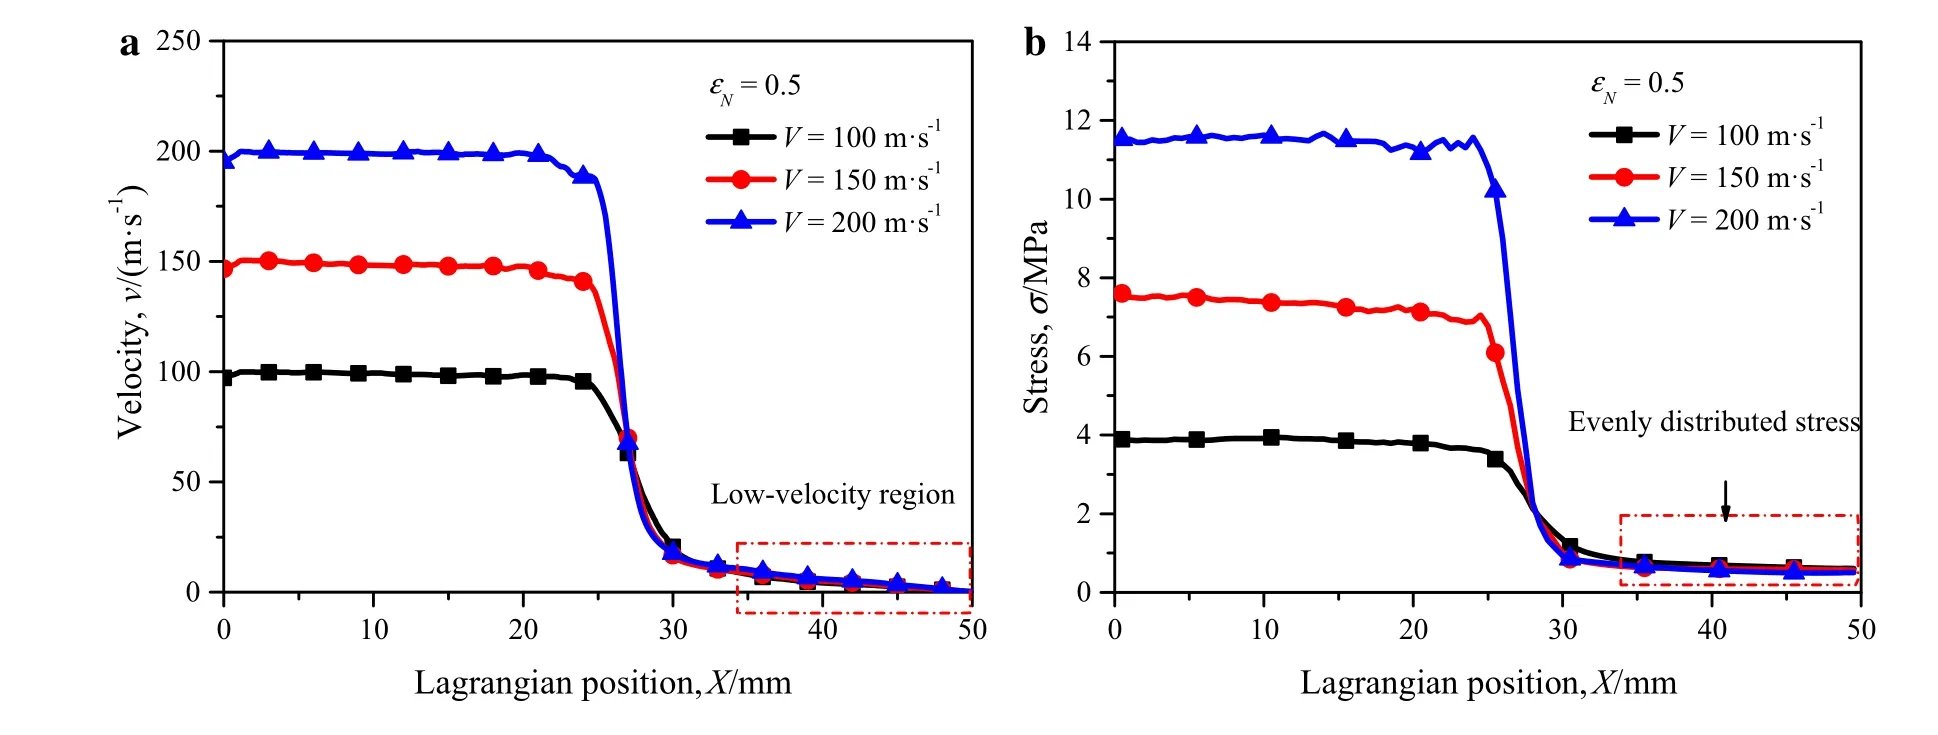
Fig.16 Velocity distribution a and stress distribution b of honeycombs under constant-velocity compression at εN=0.5
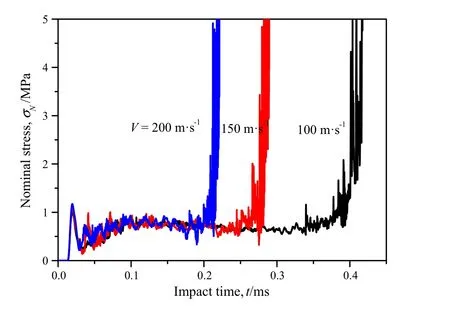
Fig.17 Nominal stress at the support end under constant-velocity compression
To explain why the local strain rate of the initial crush state is very different under the two loading scenarios,we estimate the corresponding strain rate from˙ε=Vc/Lc,in which a characteristic lengthLcrepresents the length of the region where the initial crush behavior happens,and a char-acteristic velocityVcrepresents the corresponding velocity change in this region.Under constant-velocity compression,the whole region in front of the plastic compaction wave experiences deformation and in a quasi-static mode,thusLcis in the scale of the specimen size,i.e.~10−2m.The corresponding local velocity of the region is very low andVcis in the scale of 100m·s−1,which is observed from Fig.16a.Thus,the local strain rate of the initial crush state is on the scale of 102s−1,which coincides with the strain rate under constant-velocity compression shown in Fig.11.Under direct impact,the deformation of the region in the front of plastic wave is basically concentrated in a cell size near the shock front.So,Lcis the scale of the cell size,i.e.~10−3m.The correspondingVcis in the scale of 101m·s−1,see Fig.19.Thus,the local strain rate of the initial crush state is in the scale of 104s−1in this loading scenario,which is confirmed with Fig.13.With the increase of impact time under direct impact,the strain rate of the initial crush state decreases with the decrease ofVcand increase ofLc.

Fig.18 Deformation patterns of honeycombs under direct impact with V0=200 m·s−1
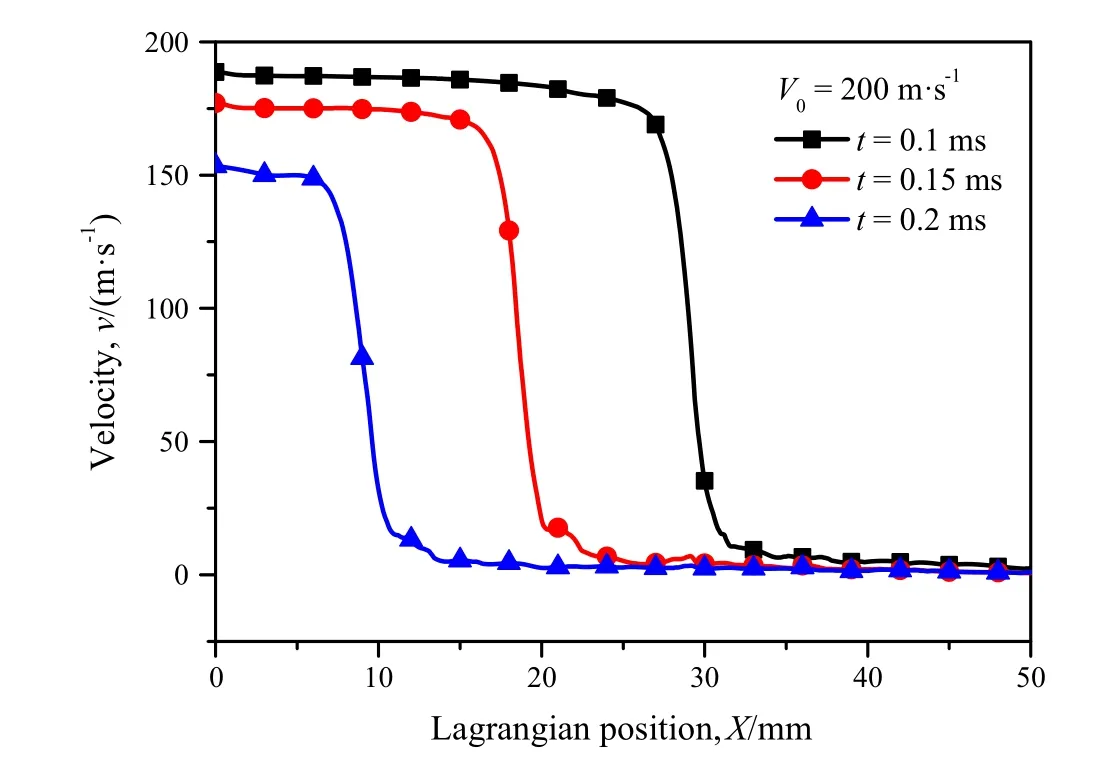
Fig.19 Velocity distribution of honeycombs under direct impact with V0=200 m·s−1
5 Conclusions
The information on local strain and stress for irregular honeycombs under dynamic impact are calculated respectively by the local strain field calculation method and the cross sectional engineering stress calculation method from the results of the cell-based finite element simulation.The initial crush stresses of an irregular honeycomb are obtained from the local stress/strain information under different dynamic loadings.The initial crush stress under constant-velocity compression is identical to the quasi-static one,but less than the one under direct impact.The initial crush stresses under different dynamic loadings could be very different even though there is no strain-rate effect of matrix material.This understanding solves the controversial issue on the initial crush stress of cellular materials.The strain-rate effect on the initial crush stress is further explored.Under constant-velocity compression,the local strain rate of the initial crush state is constant and smaller than a critical strain rate.The strain rate is too small to cause significant strainrate effect on the initial crush stress.Under direct impact scenario,the local strain rate of the initial crush state is larger than the critical strain rate and a power-law relation between the initial crush stress and the strain rate is explored.
Deformation mechanisms of the initial crush behavior under dynamic loadings are also explored.Under constant velocity compression,the region in the front of plastic compaction wave deforms in a quasi-static mode in which random shear bands exist.The local velocity is low and the local stress is evenly distributed,which leads to the low local strain rate in this region.Under direct impact,the region in the front of plastic compaction deforms in a shock mode in which the deformation is basically concentrated in a cell size near the shock front.The local velocity is high and the initial crush stress is increased by the local high strain rate.
We have solved the seeming contradiction about the initial crush stresses obtained by Zheng et al.[21]and Sun et al.[34]and then improved the understanding about the strain-rate effect on the initial crush stress under dynamic loadings.Moreover,we provide a simple and direct approach to study the dynamic compressive behavior of honeycombs under dynamic loadings by using the local strain field calculation method and the cross-sectional stress calculation method.Extended application may be implemented in open-/closed-cell foams simulated in 3D finite element models in complicated loading situations.
AcknowledgementsThis work was supported by the National Natural Science Foundation of China(Grants 11372308,11372307)and the Fundamental Research Funds for the Central Universities(Grant WK2480000001).
1.Gibson,L.J.,Ashby,M.F.:Cellular Solids:Structure and Properties,2nd edn.Cambridge University Press,Cambridge(1997)
2.Lu,G.X.,Yu,T.X.:Energy Absorption of Structures and Materials.Woodhead Publishing Ltd,Cambridge(2003)
3.Maiti,S.K.,Gibson,L.J.,Ashby,M.F.:Deformation and energy absorption diagrams for cellular solids.Acta Metall.32,1963–1975(1984)
4.Tang,L.Q.,Shi,X.P.,Zhang,L.,et al.:Effects of statistics of cell’s size and shape irregularity on mechanical properties of 2D and 3D Voronoi foams.Acta Mech.225,1361–1372(2014)
5.Song,Y.Z.,Wang,Z.H.,Zhao,L.M.,et al.:Dynamic crushing behavior of3D closed-cell foams based on Voronoirandom model.Mater.Des.31,4281–4289(2010)
6.Hanssen,A.G.,Hopperstad,O.S.,Langseth,M.,et al.:Validation of constitutive models applicable to aluminum foams.Int.J.Mech.Sci.44,359–406(2002)
7.Liu,Q.L.,Subhash,G.:A phenomenological constitutive model for foams under large deformations.Polym.Eng.Sci.44,463–473(2004)
8.Reid,S.R.,Peng,C.:Dynamic uniaxial crushing of wood.Int.J.Impact Eng.19,531–570(1997)
9.Li,Q.M.,Meng,H.:Attenuation or enhancement—a one dimensional analysis on shock transmission in the solid phase of a cellular material.Int.J.Impact Eng.27,1049–1065(2002)
10.Harrigan,J.J.,Reid,S.R.,Tan,P.J.,et al.:High rate crushing of wood along the grain.Int.J.Mech.Sci.47,521–544(2005)
11.Tan,P.J.,Reid,S.R.,Harrigan,J.J.,et al.:Dynamic compressive strength properties of aluminium foams.Part I—experimental data and observations.J.Mech.Phys.Solids 53,2174–2205(2005)
12.Zhao,H.,Elnasri,I.,Li,H.J.:The mechanism of strength enhancement under impact loading of cellular materials.Adv.Eng.Mater.8,877–883(2006)
13.Elnasri,I.,Pattofatto,S.,Zhao,H.,etal.:Shock enhancement of cellular structures under impact loading:Part I experiments.J.Mech.Phys.Solids 55,2652–2671(2007)
14.Pattofatto,S.,Einasri,I.,Zhao,H.,et al.:Shock enhancement of cellular structures under impact loading:Part II analysis.J.Mech.Phys.Solids 55,2672–2686(2007)
15.Ma,G.W.,Ye,Z.Q.,Shao,Z.S.:Modeling loading rate effect on crushing stress of metallic cellular materials.Int.J.Impact Eng.36,775–782(2009)
16.Hu,L.L.,Yu,T.X.:Dynamic crushing strength of hexagonal honeycombs.Int.J.Impact Eng.37,467–474(2010)
17.Tan,P.J.,Harrigan,J.J.,Reid,S.R.:Inertia effects in uniaxial dynamic compression of a closed cell aluminiumalloy foam.Mater.Sci.Technol.18,480–488(2002)
18.Zou,Z.,Reid,S.R.,Tan,P.J.,et al.:Dynamic crushing of honeycombs and features of shock fronts.Int.J.Impact Eng.36,165–176(2009)
19.Liao,S.F.,Zheng,Z.J.,Yu,J.L.:Dynamic crushing of 2D cellular structures:local strain field and shock wave velocity.Int.J.Impact Eng.57,7–16(2013)
20.Barnes,A.T.,Ravi-Chandar,K.,Kyriakides,S.,et al.:Dynamic crushing of aluminum foams:part I—experiments.Int.J.Solids Struct.51,1631–1645(2014)
21.Zheng,Z.J.,Wang,C.F.,Yu,J.L.,et al.:Dynamic stress–strain states for metal foams using a 3D cellular model.J.Mech.Phys.Solids 72,93–114(2014)
22.Dannemann,K.A.,Lankford,J.:High strain rate compression of closed-cell aluminium foams.Mater.Sci.Eng.A 293,157–164(2000)
23.Wang,P.F.,Xu,S.L.,Li,Z.B.,et al.:Experimental investigation on the strain-rate effect and inertia effect of closed-cell aluminum foam subjected to dynamic loading.Mater.Sci.Eng.A 620,253–261(2015)
24.Deshpand,V.S.,Fleck,N.A.:High strain rate compressive behaviour of aluminium alloy foams.Int.J.Impact Eng.24,277–298(2000)
25.Tan,P.J.,Reid,S.R.,Harrigan,J.J.,et al.:Dynamic compressive strength properties of aluminium foams.Part II—‘shock’theory and comparison with experimental data and numerical models.J.Mech.Phys.Solids 53,2206–2230(2005)
26.Lopatnikov,S.L.,Gama,B.A.,Haque,M.J.,et al.:Dynamics of metal foam deformation during Taylor cylinder–Hopkinson bar impact experiment.Compos.Struct.61,61–71(2003)
27.Lopatnikov,S.L.,Gama,B.A.,Haque,M.J.,et al.:High-velocity plate impact of metal foams.Int.J.ImpactEng 30,421–445(2004)28.Lopatnikov,S.L.,Gama,B.A.,Gillespie,J.W.:Modeling the progressive collapse behavior of metal foams.Int.J.Impact Eng.34,587–595(2007)
29.Zheng,Z.J.,Liu,Y.D.,Yu,J.L.,etal.:Dynamic crushing of cellular materials:continuum-based wave models for the transitional and shock modes.Int.J.Impact Eng.42,66–79(2012)
30.Karagiozova,D.,Langdon,G.S.,Nurick,G.N.:Propagation of compaction waves in metal foams exhibiting strain hardening.Int.J.Solids Struct.49,2763–2777(2012)
31.Wang,L.L.,Yang,L.M.,Ding,Y.Y.:On the energy conservation and critical velocities for the propagation ofa“steady-shock”wave in a bar made of cellular material.Acta.Mech.Sin.29,420–428(2013)
32.Zheng,J.,Qin,Q.H.,Wang,T.J.:Impact plastic crushing and design of density-graded cellular materials.Mech.Mater.94,66–78(2016)
33.Gaitanaros,S.,Kyriakides,S.:Dynamic crushing of aluminum foams:partII—analysis.Int.J.Solids Struct.51,1646–1661(2014)
34.Sun,Y.L.,Li,Q.M.,McDonald,S.A.,et al.:Determination of the constitutive relation and critical condition for the shock compression of cellular solids.Mech.Mater.99,26–36(2016)
35.Ding,Y.Y.,Wang,S.L.,Zheng,Z.J.,et al.:Dynamic crushing of cellular materials:a unique dynamic stress-strain state curve.Mech.Mater.100,219–231(2016)
36.Zheng,Z.J.,Yu,J.L.,Li,J.R.:Dynamic crushing of 2D cellular structures:a finite element study.Int.J.Impact Eng.32,650–664(2005)
37.Yu,J.L.,Wang,P.,Liao,S.F.,et al.:Local strain and stress calculation methods of irregular honeycombs under dynamic compression.In:Proceedings of the ASME 35th International Conference on Ocean,Offshore and Arctic Engineering,Busan,June 19–24(2016)
38.Liao,S.F.,Zheng,Z.J.,Yu,J.L.:On the local nature of the strain field calculation method for measuring heterogeneous deformation of cellular materials.Int.J.Solids Struct.51,478–490(2014)
- Acta Mechanica Sinica的其它文章
- Motion of the moonlet in the binary system 243 Ida
- Adaptive ANCF method and its application in planar flexible cables
- Analytical modeling and simulation of porous electrodes:Li-ion distribution and diffusion-induced stress
- Macro and micro mechanics behavior of granite after heat treatment by cluster model in particle flow code
- Effect of a viscoelastic target on the impact response of a flat-nosed projectile
- Highly accurate symplectic element based on two variational principles

