A generic method for rock mass classificationVitthal M.Khatika,*,Arup Kr.Nandib
Deprtment of Mechnicl Engineering,Indin Institute of Technology,Knpur,208016,Indi
bEngineering Design Group,CSIR-Central Mechanical Engineering Research Institute,MG Avenue,Durgapur,713209,India
1.Introduction
Engineering design associated with rock mechanics problems is a challenging issue due to the variation of rock strength properties.This is due to the presence of fractures(which govern the stability of surface structures)and in situ stress conditions(which govern the stability of deep structures)in rock masses.Furthermore,groundwater conditions,squeezing and swelling or stability conditions of rock masses,and filling materials in joints will scale their effects(Hudson and Harris,1997;Panthee et al.,2016).In this regard,proper engineering design is one of the major concerns to avoid failure of engineering structures(Akin,2013).
There are various schemes of rock mass classification(RMC)to characterize the rock mass strength properties(such as rock quality and rock mass deformability)and in situ conditions.In these RMC systems,each rock parameter is separately assigned with a value(so-called rating)depending on its weight on roof fall(based on the previous case studies).Finally,the ratings of all parameters are combined to obtain a final value used to classify the rock masses.It is observed that the influence of a rock parameter varies with its magnitude.Moreover,such variations are found to be nonlinear for almost all types of rock parameters.To over come this limitation,the entire range of each rock parameter is divided into a number of zones.Thereby,it becomes quite easier to assign a rating value for each zone.Chances of assigning an appropriate rating to a rock parameter are of high risk if more number of zones is involved.But increasing the number of zones requires more experimental observations,and thus it makes the rock mass rating(RMR)system more complex.Therefore,finding an appropriate number of zones that divides the entire range of a rock parameter is critically important.
Among various RMC systems developed so far,RMR system suggested by Bieniawski(1993)(B-RMR)and Norwegian Geotechnical Institute(NGI)Q-system by Barton et al.(1974)(NGIQ)are the most commonly used ones.Moreover,these two systems are also considered as the basis for developing many other systems for rock mass classification.Most of the parameters used by these two methods are found to be independent.Consideration of fewer rock parameters in a method implies that it reduces the classification complexity and minimizes the requirement of practical data measurements associated with the rock parameters.This is a quite logical compromise,provided that the criterion of choosing the influencing parameters is closer to the actual field parameter values.But in general,the most influencing rock parameters on site are actually less weighted or ignored in the RMR method.It suggests that a geologist or engineer should emphasize more on appropriate selection of a classification technique for the given rock mass site.This needs observations or huge trial-and-error tests that are definitely not the goal behind the approach using a few parameters.For this,there still remain questions about applicability of systems in highly fractured rock conditions.In a critique made by Palmstron and Broch(2006),it is suggested that NGI-Q system fails to properly consider joint orientations,joint aperture,joint continuity and rock strength.Bieniawski(1984)also advised that at least two classification systems may be adopted for practical problems when making a final decision.In spite of that,NGI-Q and B-RMR systems are found to be simplified and the most powerful tools for support design in underground excavations.
Considering the above problems,an attempt has been made to formulate a generic classification methodology for different rock masses.The proposed generic classification system considers the most possible rock load influencing the parameters that are found in a variety of rocks.This generic RMR(GRMR)classification method can be realized after examining the existing RMC systems,such as B-RMR system(Bieniawski,1993),NGI-Q system(Barton et al.,1974),the system proposed by Central Mining Research Institute(CMRI),Dhanbad,India(CMRI-RMR)(Venkateswarlu et al.,1989),and the others(Sen and Sadagah,2003;Aksoy,2008).In order to establish and calibrate the RMR system,a huge number of databases referring to various rock structures are essential.Since it is very difficult to collect such enormous rock load data of different types of rocks,the statistical data related to roof fall are considered here for establishing the GRMR technique.The roof fall data were generated based on three RMR methods,i.e.B-RMR,NGI-Q and CMRI-RMR.Through literature review,it is evident that these three methods are widely used for different types of rocks across the world.The influence of each parameter on RMR classification is analyzed on a commonly used plat form of rock load,in which the BRMR,NGI-Q and CMRI-RMR are included.Variation of rock loads due to the varied rock parameter values in a given range was considered as the criterion to optimize the number of zones in the GRMR method.As for each rock parameter,a relative rating value was assigned based on a sensitivity analysis.The rating variations corresponding to different zones for any parameter associated with a single RMR method were done by a gradient analysis of rock load variation which is found in that RMR method.For parameters that are common in more than one RMR classification method,the rating variations were made by taking a mean value of rock load variations corresponding to those methods.Two rock load equations have been suggested for GRMR to evaluate the rock load that will be used for the purpose of making support design.By realizing the fact that rock structure is very complex in nature and the rock properties in a particular location may also change,an attempt was made here to construct an artificial neural network(ANN)model for the GRMR system(Khatik et al.,2017).
2.Existing methods of rock mass classification
2.1.Rock mass properties
Unlike intact rock,it is difficult to illustrate the strength properties for fractured rocks(Noorian Bidgoli et al.,2013),due to the limitations in complete theories and difficulties in practical measurements associated with fractured rocks(Hudson and Harris,1997).Also,limited geotechnical data cause restriction on exact mathematical modeling of the relation among rock quality and rock properties.The solution to this problem is to adopt empirical methods such as RMR systems which are based on the condition of rock masses with various properties.These rock properties are the inputs to RMR systems,and hereafter mentioned as rock parameters.The consideration of rock parameters plays a key role in fractured rock masses for arriving to some strength clues.Among various methods available,the one with the highest number of rock parameters provides a closer view to the actual field condition.Fifteen rock parameters were sorted(presented in Table 1)whose values can be measured quantitatively,and all together present a similar nature to actual rock mass conditions.Details about these parameters can be found in the respective references.
2.2.Existing methods of RMR systems
It was observed that the choice of a method for RMC is highly dependent on which parameters are(most)sensitive in actual site.The RMR method which considers those sensitive parameters is chosen for classification.The three most commonly used RMR systems are discussed in the following sub-sections.
2.2.1.B-RMR system
With additional case histories,the RMR system or geomechanics classification has been revised several times(basic principle remained the same)(Bieniawski,1989).The B-RMR method considers six rock parameters(first six parameters in Table 1).To find out the RMR value using B-RMR system,the rock mass is divided into a number of regions such that certain features are more or less uniform within each region(Bieniawski,1989).The classification parameters are then measured at each region of rock masses.Each parameter is assigned to an empirical rating,R,corresponding to its actual value according to Table 2 presented in Bieniawski(1973).In this method,the discontinuity presented in rock masses is the most important factor in rock mass classification.Discontinuity spacing and conditions(e.g.roughness and separation)have given 50%weight together.When the number of discontinuity set is less than 3,the rating for discontinuity spacing may be increased by 30%.The strike and deep orientation of discontinuities are considered as separate parameters which also depend on the type of application like tunnel,mine,slope or foundation.The RQD and strength of intact rocks have given weight of 20%and 10%,respectively.The groundwater rating accounts for 15%of total ratings.The final RMR value of the rock is calculated as follows:

whereR1,R2,…,R6are the ratings corresponding to six rock parameters as depicted in Table 2.The calculated RMR value lies between 0 and 100.A higher RMR value shows good quality of rock.The B-RMR system has wide areas of applications such as tunnels,chambers,mines,slopes and foundations(Bieniawski,1989).Nevertheless,the critical rock mass conditions,with large faults,weakness zones,and highly stressed conditions,should be handled with care.From the RMR value,the rock load and rock support canbe estimated from a support table presented in Bieniawski(1973).The rock load equation in Bieniawski’s system is described as
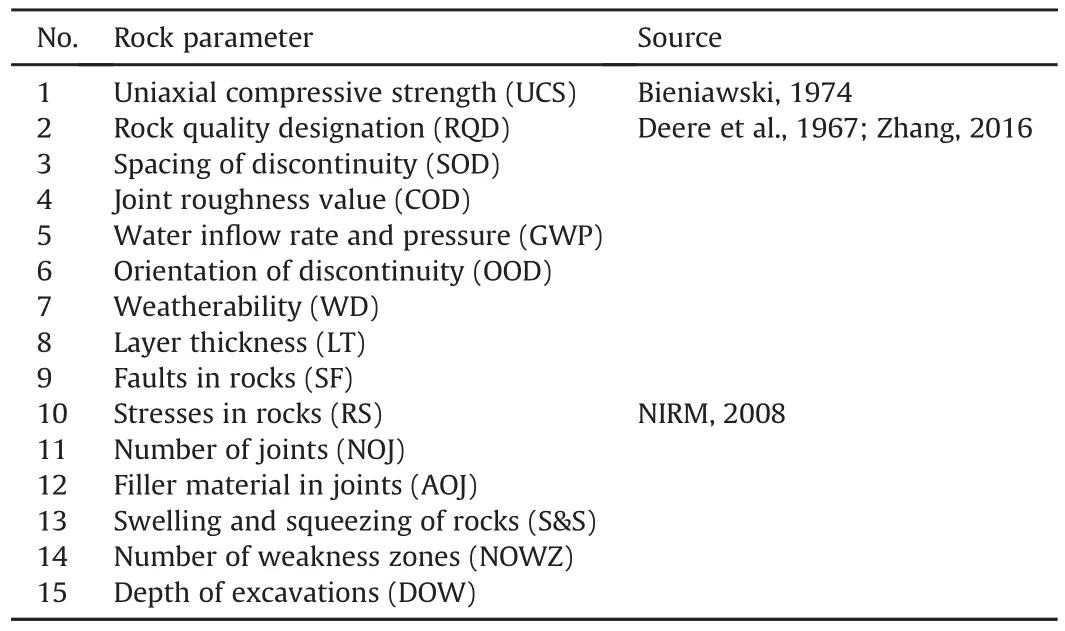
Table 1Various rock parameters.
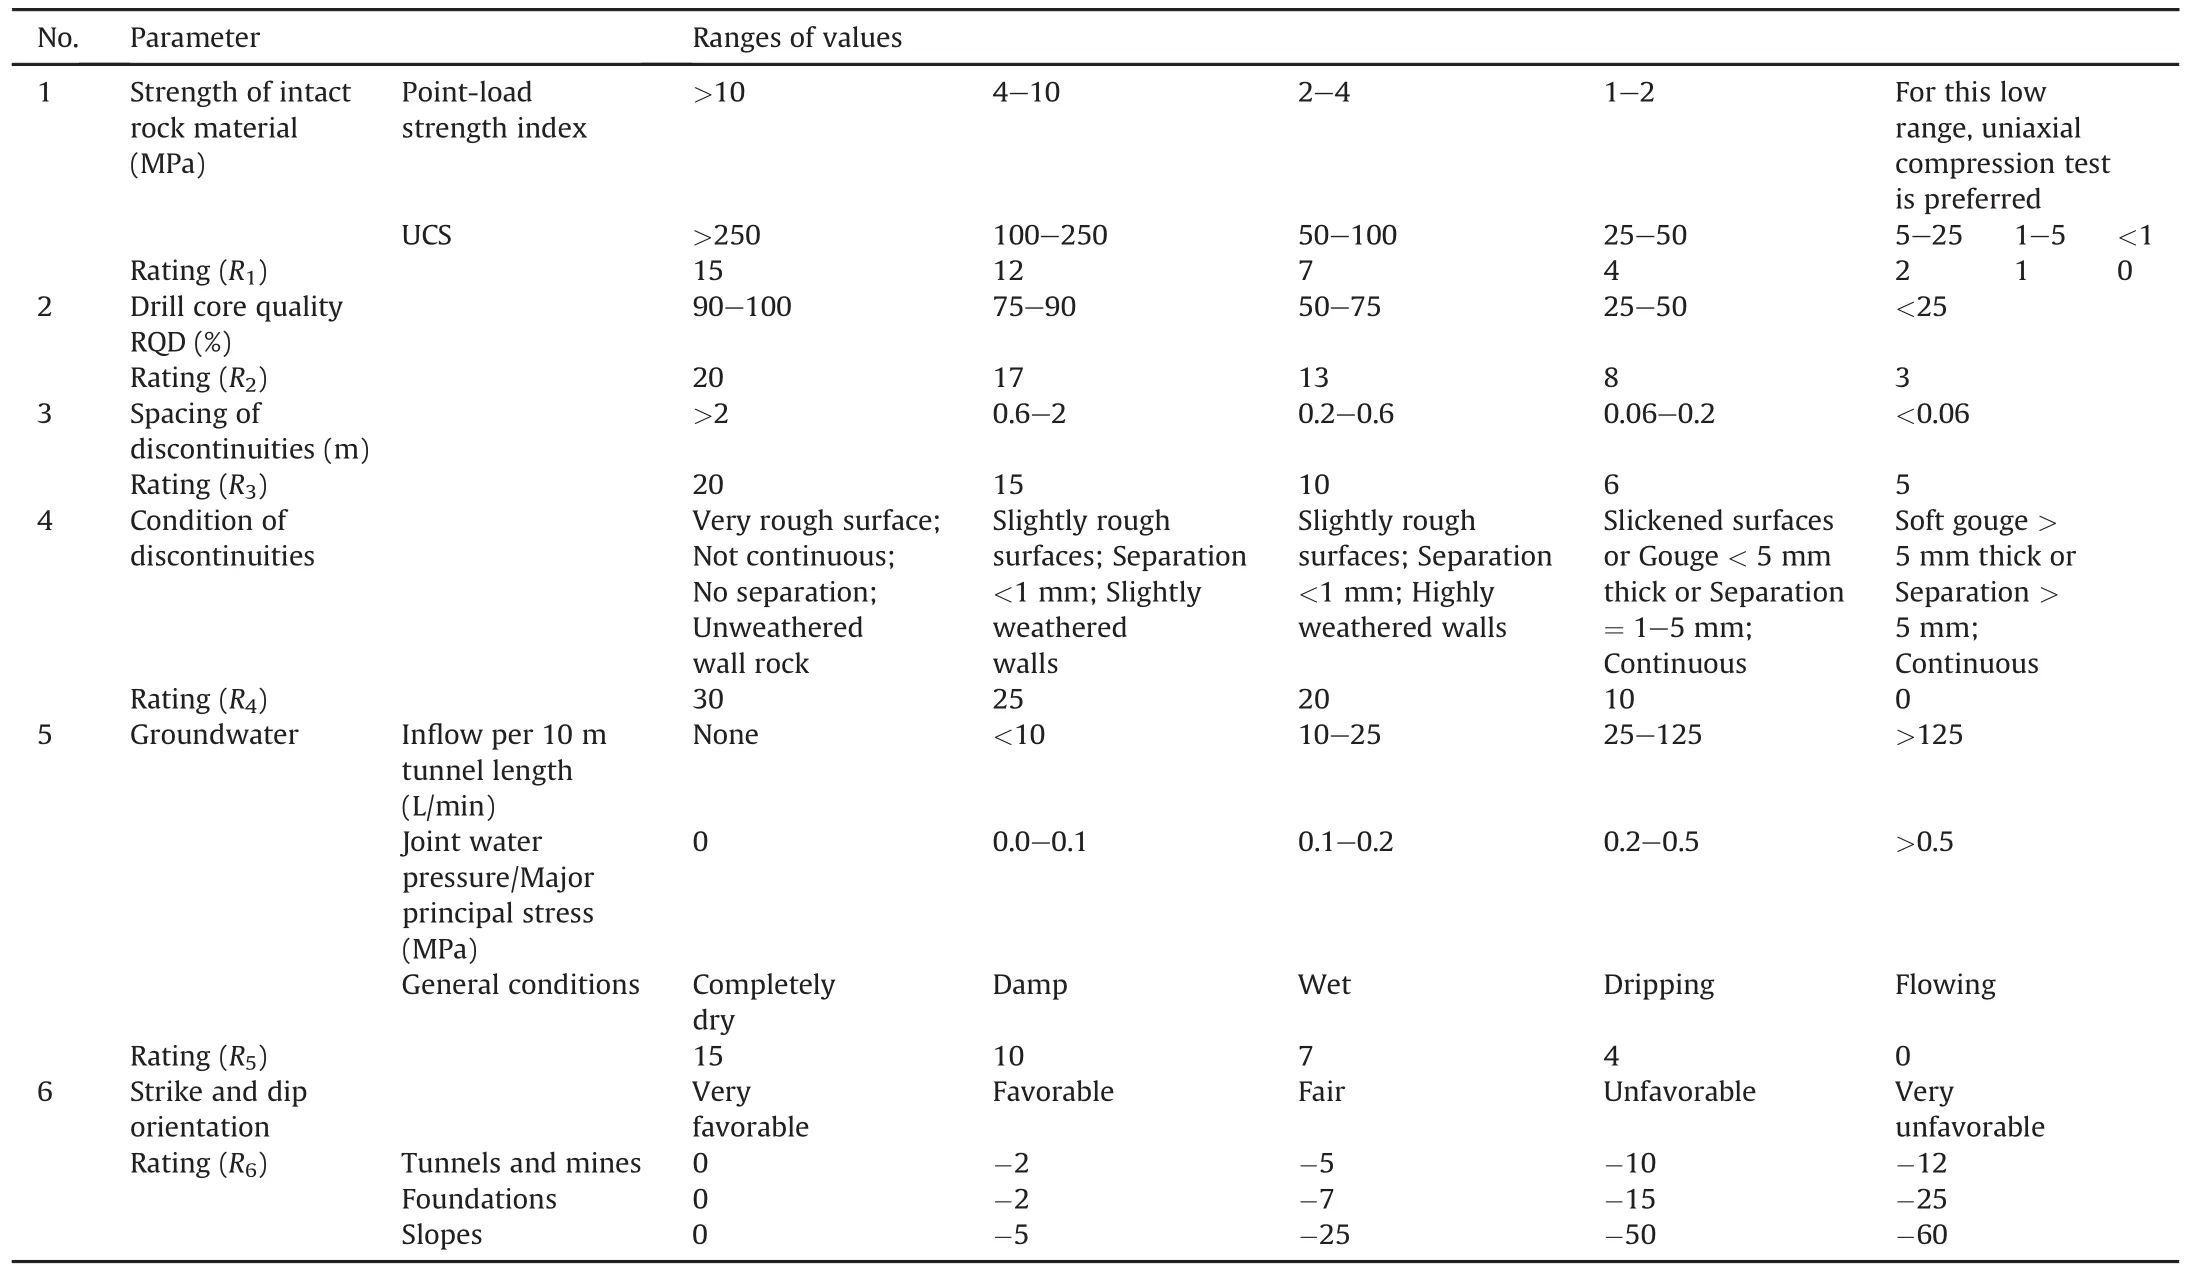
Table 2Classification parameters and their ratings according to B-RMR system(Bieniawski,1973).

whereBis the gallery width of opening area in m,andDis the rock density in t/m3.This system does not consider any parameters for rock stresses,except that stresses up to 25 MPa are included.Also,there is no clear explanation about whether or not faults and weakness zones are included(Palmstrom,2008).
2.2.2.NGI-Q system
The NGI-Q system is formulated based on the database of 200 tunnel cases that record the correlation between the amount and type of total support and rock mass quality(Q)with respect to tunnel stability.Qis a function of six rock parametersas given in the following equation(Barton et al.,1974):

whereJn,Jr,Ja,JwandSRFare the number of joint sets,joint roughness value,joint alteration value,groundwater factor(joint water reduction factor)and stress reduction factor,respectively.The joint sets will be affected by various factors such as foliation,schistosity,slaty cleavage,and bedding.The parametersJrandJashould be measured for the weakest joint set or clay-filled discontinuity.The values(ratings)of different parameters of Eq.(3)are listed in Tables 3 and 4(Barton et al.,1974).
The range of Q lies between 0.001(for exceptionally poor rock)and 1000(exceptionally good rock).The NGI-Q system is used for tunnel design,and it should not be extended for cases involving special purpose support(for highly complex rock masses)(Barton et al.,1974).The rock load and rock support of an underground excavation is based on bothQvalue and different terms of equation.A simplest empirical equation relating permanent support pressure to rock load is found(Barton et al.,1974):
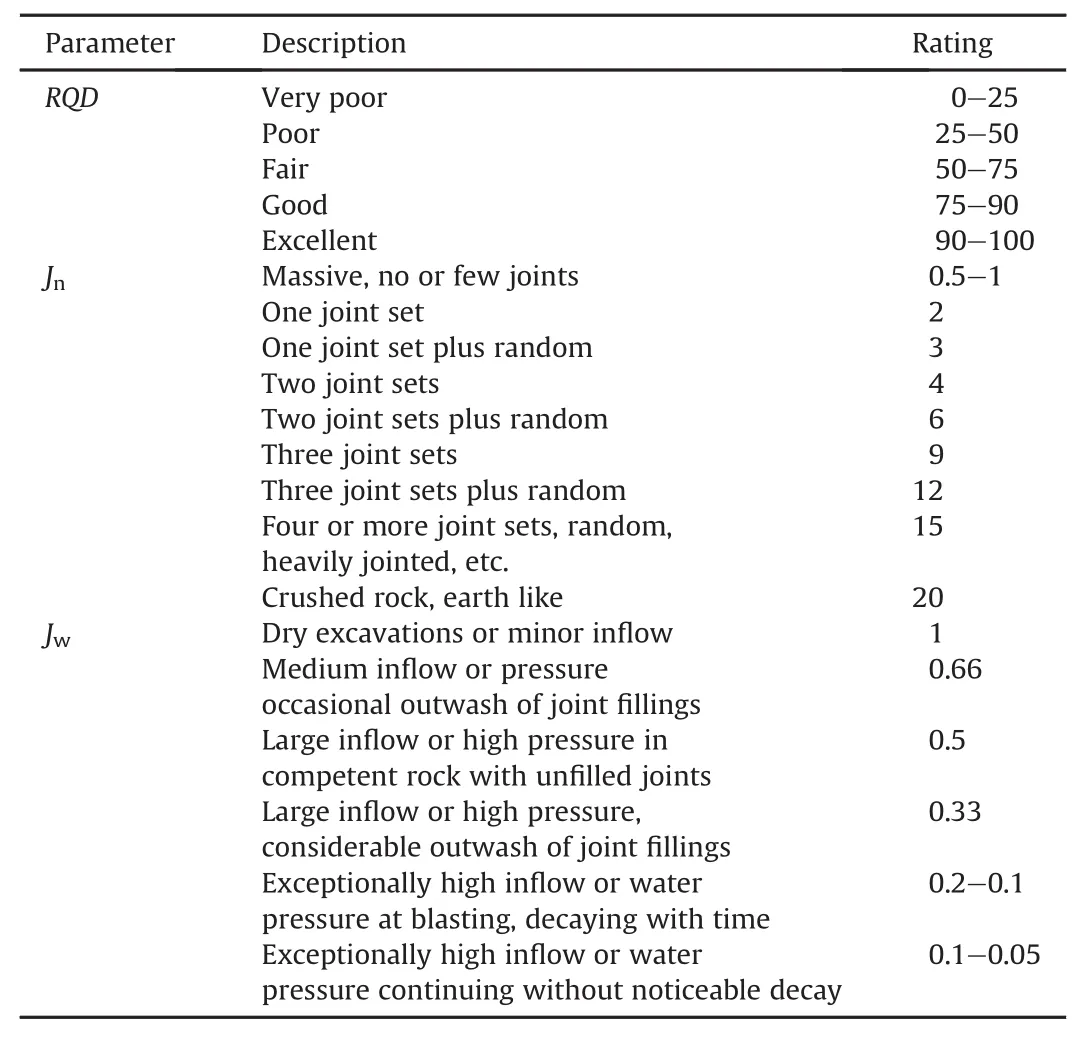
Table 3Description and ratings of parameters in NGI-Q system:RQD,Jnand Jw(Barton et al.,1974).
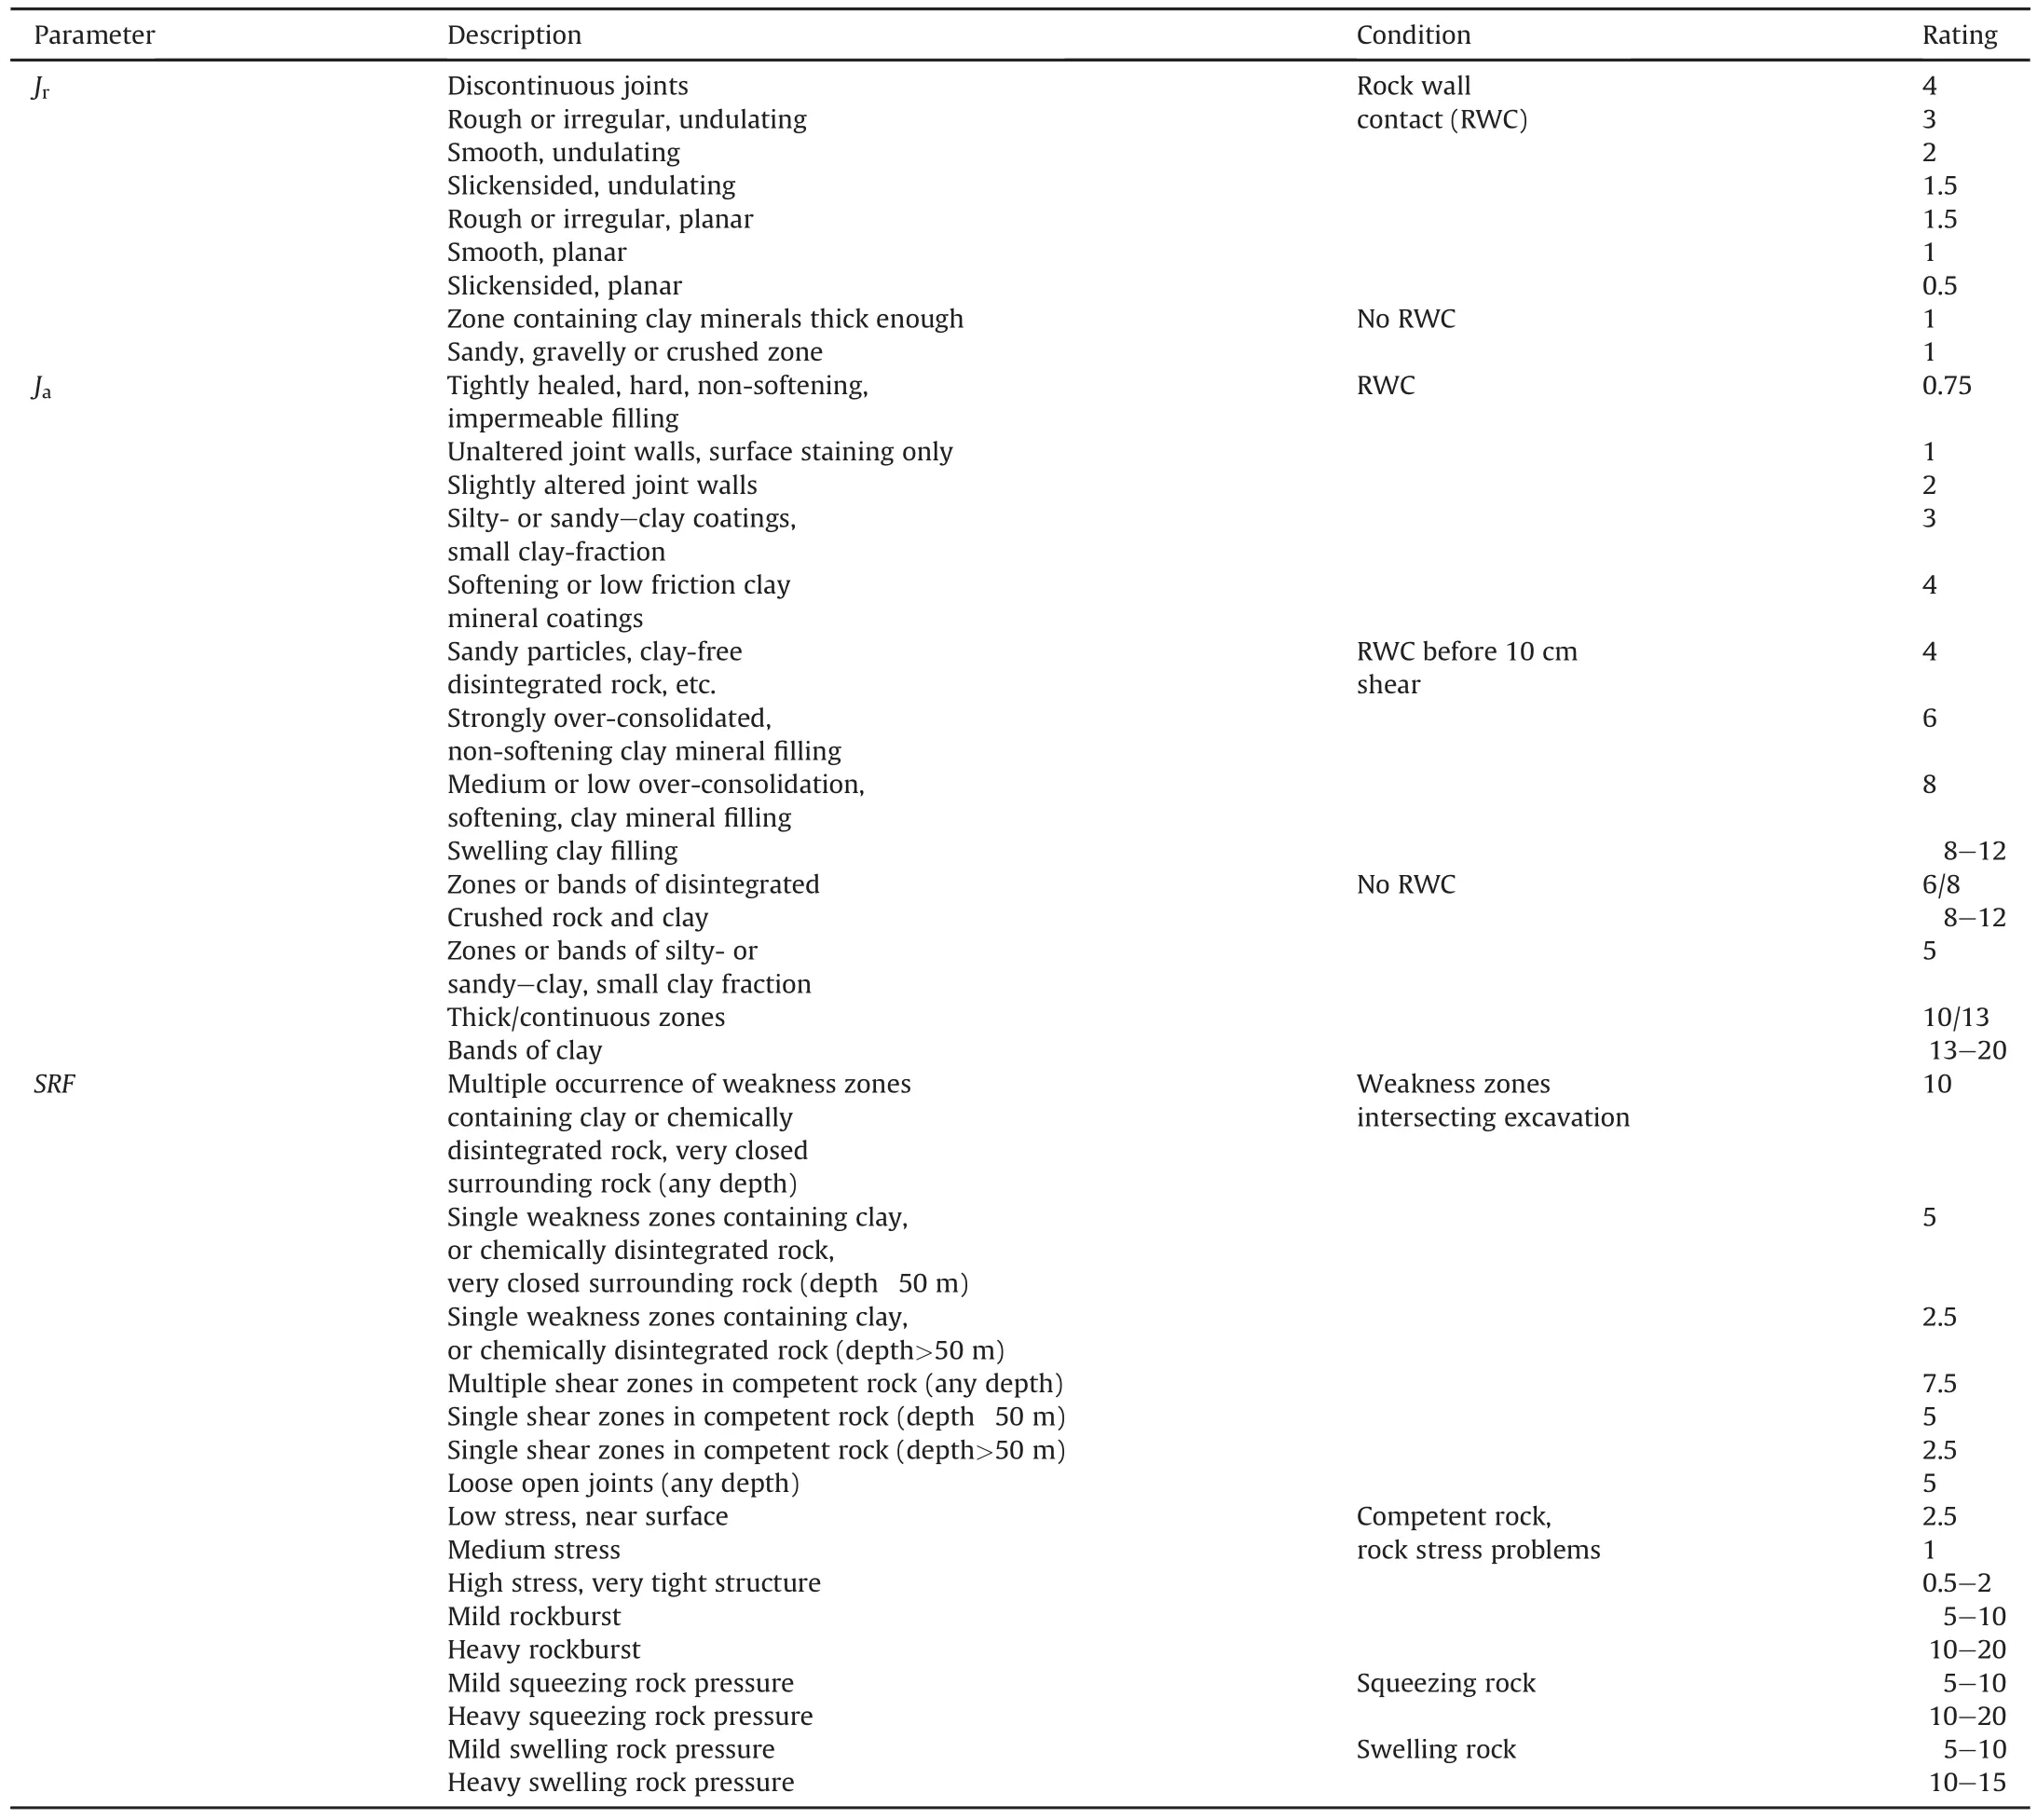
Table 4Description and ratings of parameters in NGI-Q system:Jr,Jaand SRF(Barton et al.,1974).

An improved version of Eq.(4)is also found in Barton et al.(1974),which includes the number of joint sets(Jn),and it is defined as

TheQvalue is found to work best between 0.1 and 40 for tunnels with span between 2.5 m and 30 m.Also,it should be used with care for ground with swelling and weakness zones(Palmstron and Broch,2006).
2.2.3.CMRI-RMR system
The CMRI-RMR system is an extension toB-RMR system tomake it suitable for Indian coal mines.The working principle is exactly similar to B-RMR system.In this system,statistical analysis has been performed on geotechnical data obtained from published case records and detailed field investigations.Interrelations of different parameters were found by principal component analysis(PCA)and factor analysis.The RMR value obtained by this method is as follows:

whereC1,C2,…,C5are the ratings for layer thickness,structural features,weather ability,strength of rock(15%)and ground water flow(10%),respectively.Similar to Bieniawski’s system,RMR value in CMRI system lies in between 0 and 100,and a higher RMR valueindicates a better rock.Based on multivariate statistical analysis of roof fall data,layer thickness in rocks is found to be the most sensitive parameter,and weighted 30%of the total rating.It is followed by structural features and weather ability(measured by slack durability test),weighted 25%and 20%of total rating,respectively.The ratings of different rock properties can be taken from Table 5(CMRI,1987)which was prepared based on the experimental data of rock properties.Once the RMR is calculated using Eq.(6),some adjustment factors are also multiplied with this value to obtain an adjusted RMR value as follows:
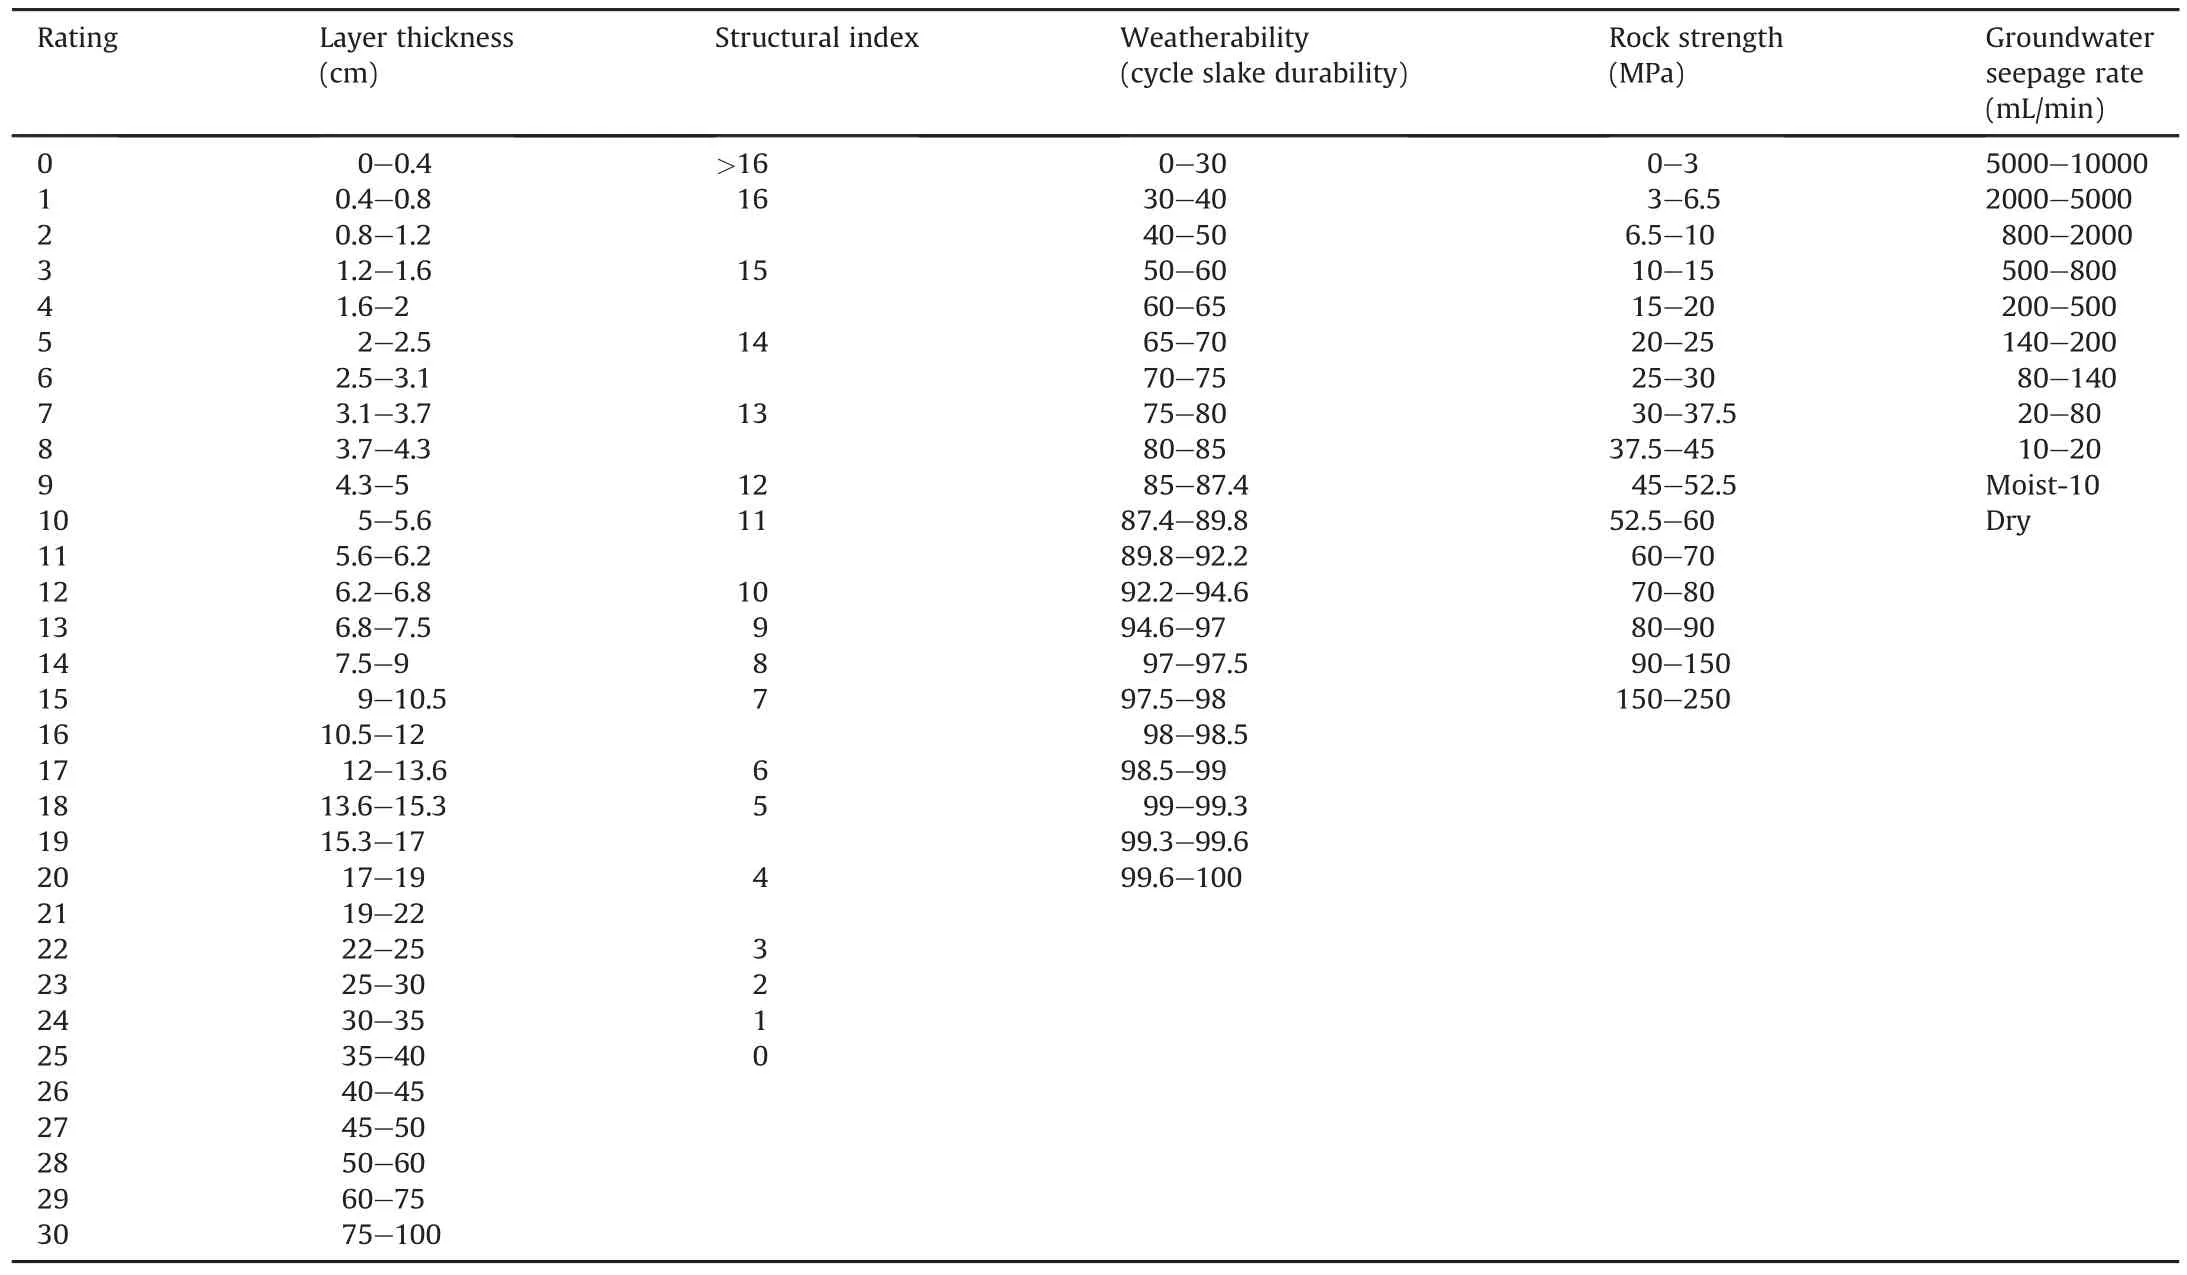
Table 5Classification parameters and their ratings according to CMRI-RMR system(CMRI,1987).

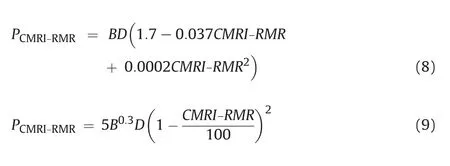
wherek1,k2andk3are the adjustment factors for in situ stresses,induced stresses and method of rock excavation,respectively.Based on the adjusted RMR,estimation of rock load in galleries and junctions are made using Eqs.(8)and(9),respectively(Paul et al.,2014).The adjusted RMR is further useful for support design.
2.3.Discussion on variation of rock loads estimated using different RMR methods
In order to interpret the effects of individual rock mass properties(mentioned in Table 1),the rock loads calculated using equations of different RMR systems were plotted against the rock parameters associated with the corresponding RMR systems,as presented in Fig.1.While varying any single parameter,the other parameters were kept at their average values which are presented in Table 6,and this concept is applicable to all three RMR systems.In this section,the detailed discussion on how the rock load varies with each rock parameter is presented,which provides detailed analysis of three RMC methods and rock mass properties associated with them.It is also a backbone of the GRMR system,which is a new methodology discussed in this paper.
The effect of UCS of rock masses on the rock load is presented in Fig.1a.From Fig.1a,the UCS of rock masses is found very sensitive at its lower range(0-90 MPa)in both CMRI-RMR and B-RMR systems.In CMRI-RMR system,rock load is found constant as UCS value exceeds 90 MPa(Deere et al.,1967).But similar observation is not found in B-RMR system.In B-RMR system,rock load decreases slightly with increasing UCS value.However,the calculated rock load values in these systems were found to be the same(55 kPa)for the UCS of 20 MPa.The RMR variation with the UCS in the GRMR system(discussed in next sections)is considered to follow a pattern that falls in an average of the CMRI-RMR and B-RMR methods.
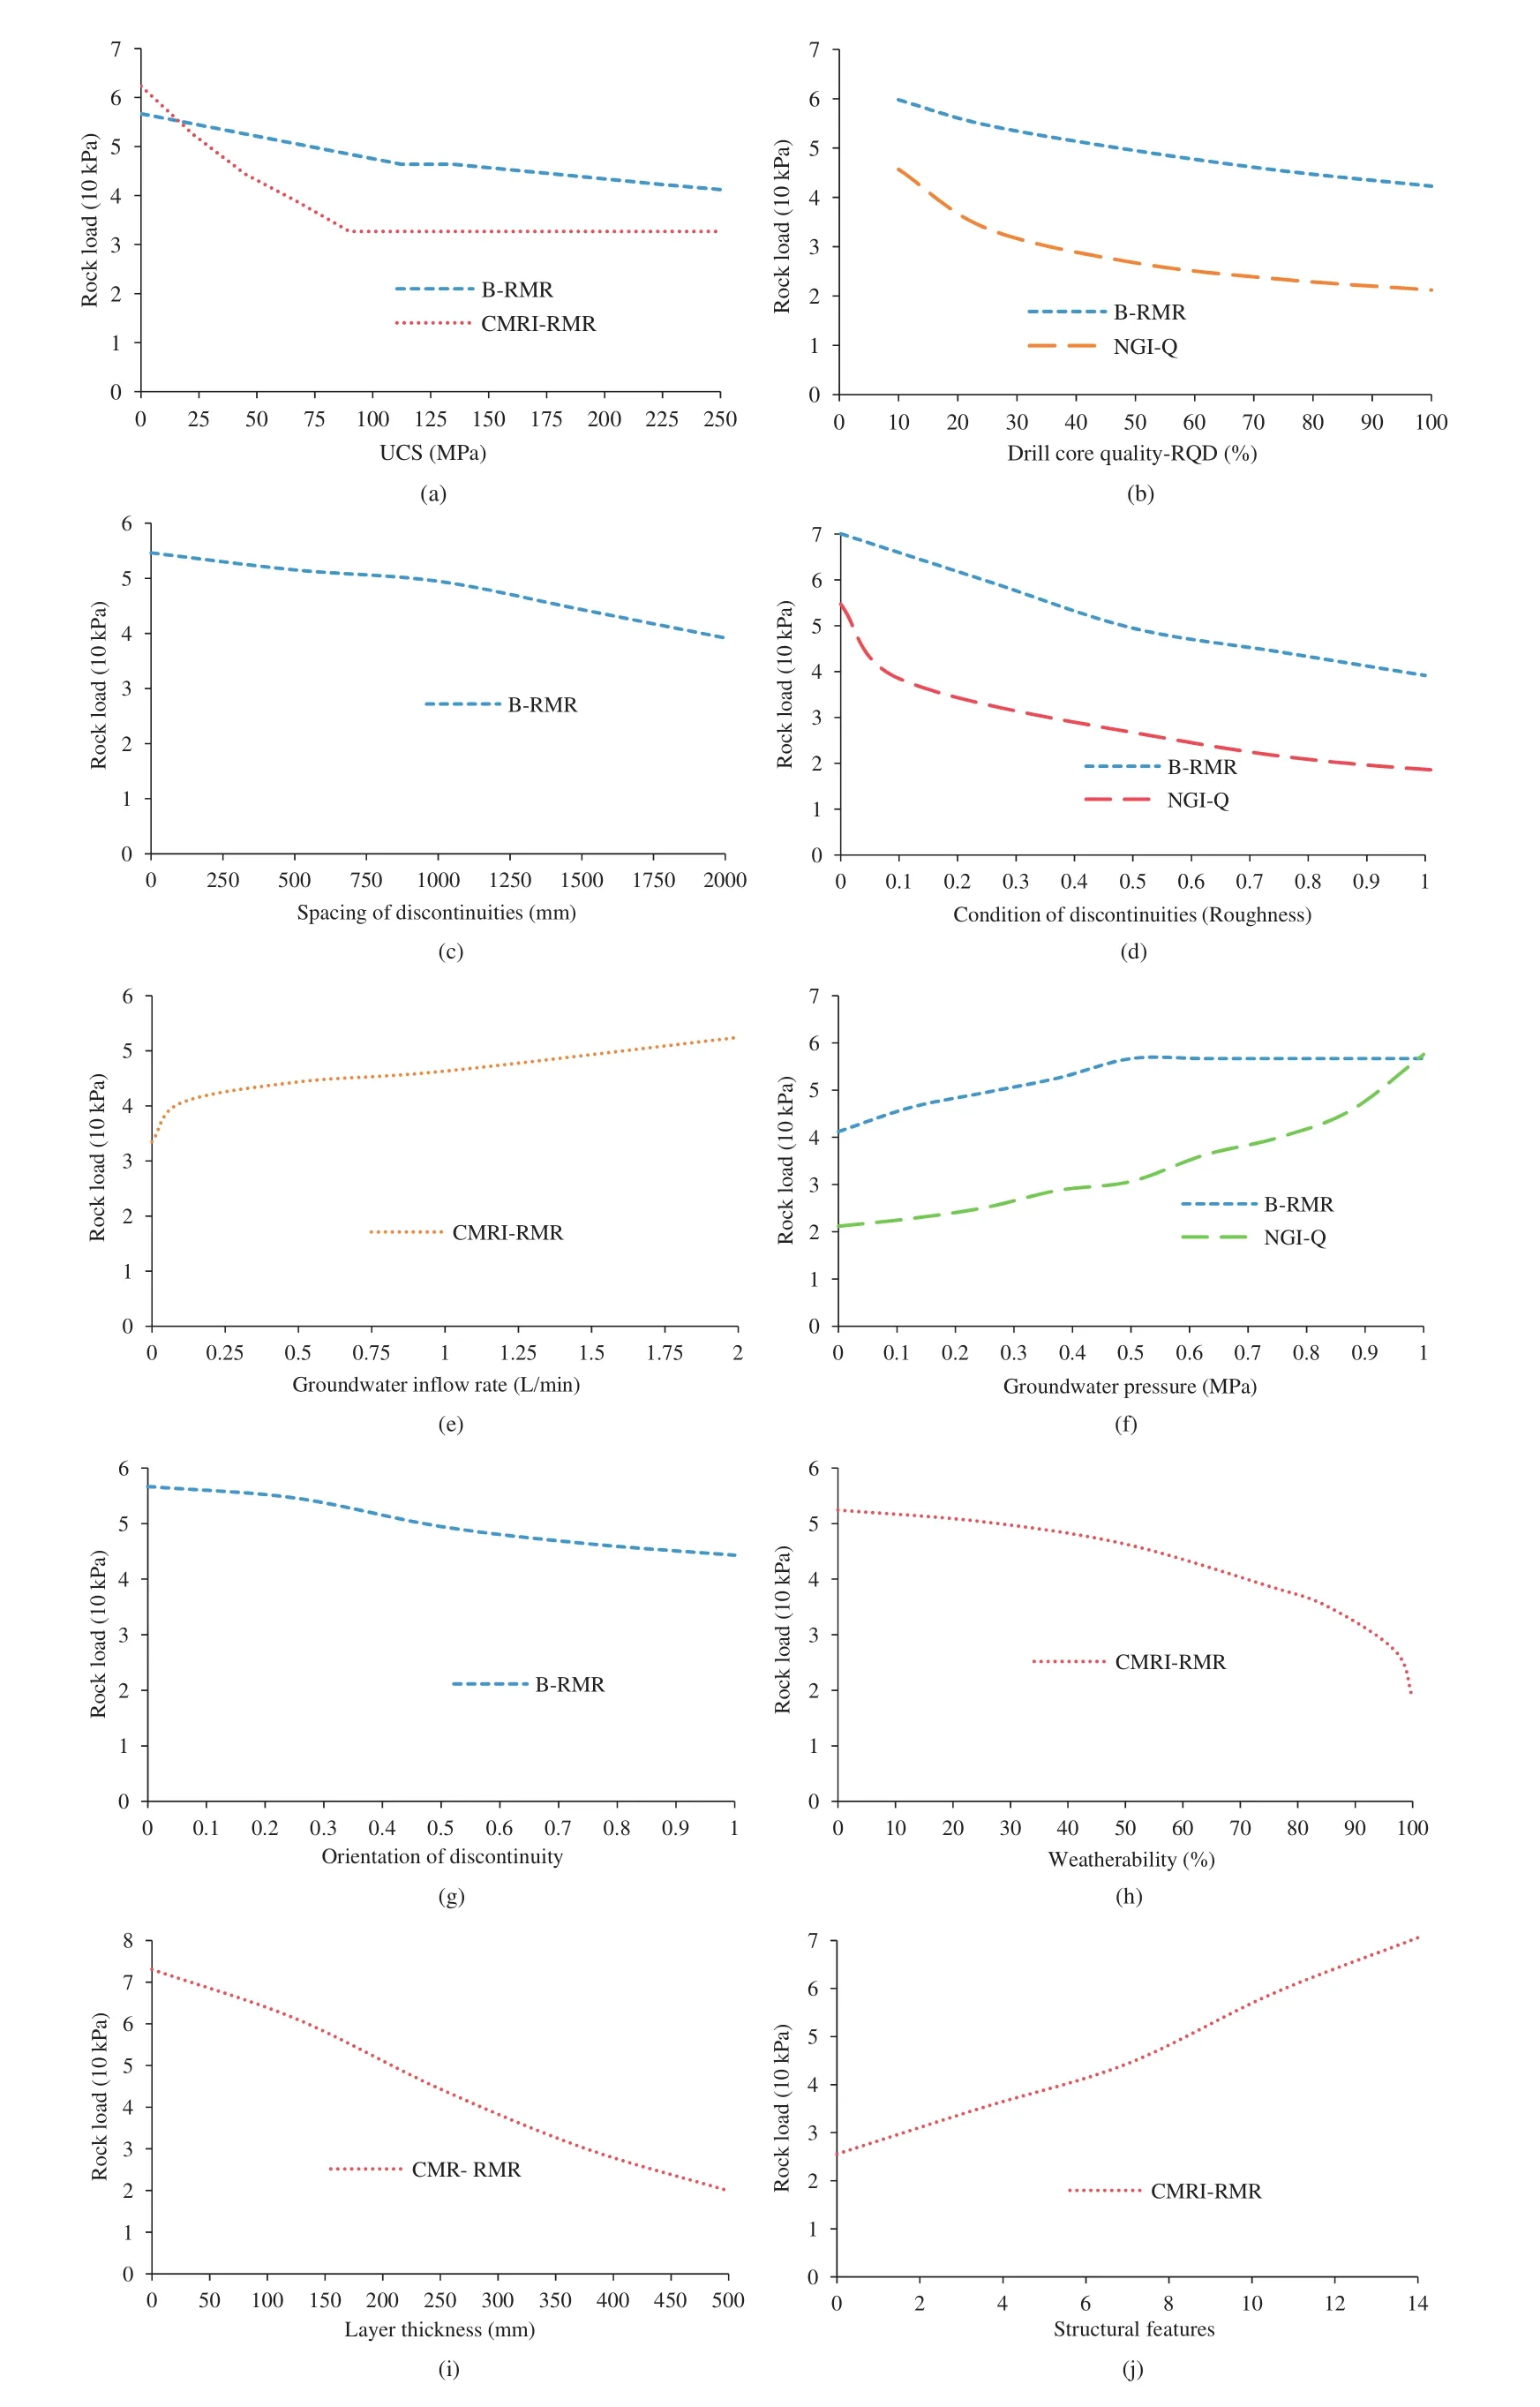
Fig.1.Variations of rock load against various rock parameters.
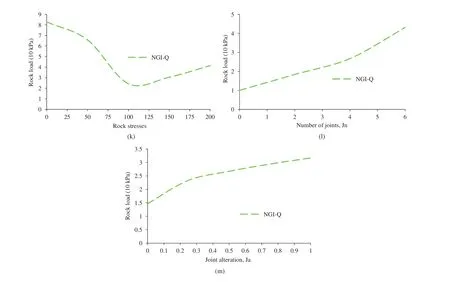
Fig.1.(continued).
For any RQD value,the B-RMR system presents more rock load than NGI-Q system does when other rock parameters are kept constant,as shown in Fig.1b.A high rock load indicates that the support system is being over-designed or safer.RQD is found more sensitive at its low range of 10%-30%for both B-RMR and NGI-Q systems,but a comparatively larger slope is noticed in NGI-Q system.Above 30%of RQD value,rock load decreases gradually with RQD.
For low value of SOD,the calculated rock load in B-RMR system is found to be high,as demonstrated in Fig.1c.As SOD increases,rock load value decreases,and the decreasing rate is found to be comparatively low till SOD reaches 1000 mm.
Fig.1d reveals that the transition of joint from smooth to slightly rough will reduce rock load considerably,and it shows more significant in NGI-Q system.A further increase in roughness reduces the rock load gradually,and it is observed in both NGI-Q and B-RMR systems.
The effect of groundwater on rock load is presented in Fig.1e and f,where one can see that rock load increases with increasing groundwater pressure in both B-RMR and NGI-Q systems.In CMRIRMR system,groundwater flow rate is considered instead of pressure.The groundwater flow rate/pressure measurement procedures and scales are not the same in different RMR systems.
From Fig.1g,a considerable reduction in rock load is observed for changing the rock orientations,and this rock property is only considered in B-RMR system.
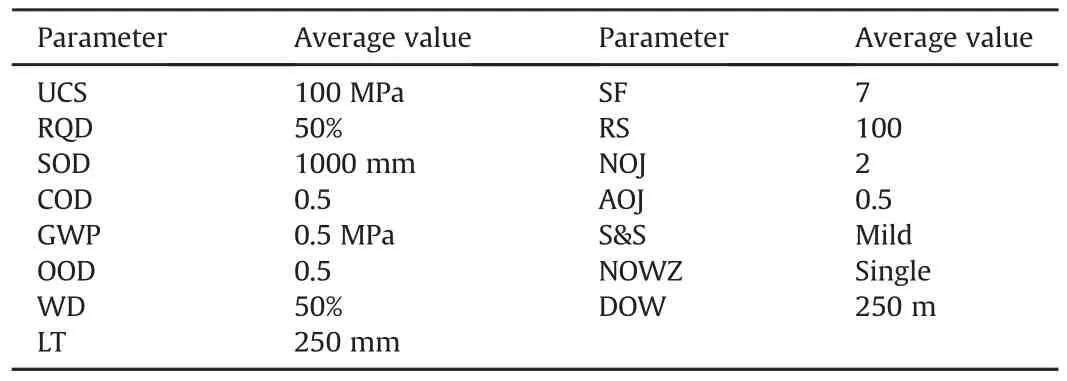
Table 6Average values of rock parameters used in rock load calculations.
It is observed that the average values of rock stresses are desirable for stable rock condition(Barton et al.,1974).Stresses within a certain limit help to hold jointed rock masses tightly,as a result,the rock stability increases.Excessive stresses will cause fracture and increase rock load.Fig.1k shows the variation of rock load with strength to stress ratio.The internal pre-static stress and external dynamic disturbances are the dominant factors for rock failure(Li et al.,2017).The number of joints increases rock load with continuous increase in gradient,as shown in Fig.1l.The higher number of joints makes the rock worse(Barton et al.,1974).Material presented in joints affects rock load according to their frictional coefficient,as shown in Fig.1m.It can be easily understood that the frictional materials reduce rock load due to the resistance developed between rock layers against slide(Barton et al.,1974).Very few rock sites will have swelling and squeezing,but it results in a worse situation for underground opening.Rock load will increase as there is swelling and/or squeezing.The effects of rock stress,number of joints and joint alteration on rock load are only considered in NGI-Q system.
Weatherability of rock masses in CMRI-RMR system is very sensitive.Above 97%SDI(slack durability index or slaking index),the rock load drastically decreases,as shown in Fig.1h.After rock stresses,layer thickness(CMRI-RMR system)is the most influencing factor which is shown in Fig.1i.Higher layer thickness near opening increases the stability of rock structure.Higher structural index shows faulty rock masses,likely by their dip angle or deep directions,and will cause increase in rock load acting as given in CMRI-RMR system(Deere et al.,1967).
3.Methodology of GRMR system
3.1.Motivation for developing GRMR system
The main problem found in RMC methods was their limitation in application to all types of rocks.Referring to discussion in Section 2,15 rock parameters presented are so ample that predicting which parameters are at risk is not easy.To address this problem,Bieniawski(1989)suggested application of multiple RMR methods for a single practical problem.But application of multiple methods is time-consuming,and will cause confusion to the designer in adopting the results particularly when they are quite different.As the rock conditions vary from place to place,the choice of appropriate RMC method for any place is very tough.This can be overcome by considering a method which takes into account the maximum possible rock features for rock classification.But there is no such method available which can classify rocks and predicts rock load for highly complex ground conditions.This is due to insufficient data available regarding all rock mass properties on roof fall incidences,while various methods were developed.But now it is possible to refer various works available regarding rock masses and to use the statistical tools to analyze these data.
3.2.Rock parameters in classification
This section describes the details of the rock mass parameters considered in rock mass classification methodology,with respect to the stability of an underground opening.The first parameter considered in rock classification is the UCS of rock masses.The underground opening is stable against external and internal forces applied by the strength properties of rock masses.The rock masses with low strength result in roof and side wall fall by rock separation.The second important parameter is discontinuity in rock masses,which occurs by millions of years’complex mechanical,thermal,chemical actions and in situ stresses,irrespective of their strength and present rock stress conditions(Hudson and Harris,1997).The spacing between the discontinuities is measured by standard scale,and its average value is considered whenever numbers of measurements are involved.The third important parameter which considers the effect of rock faults on stability of underground opening is structural feature,and it can be measured by a number of structural indices like joint spacing.The layer thickness of the rock masses is also an important parameter in GRMR method.It is also measured by the scale in an average basis as given by CMRI-RMR system(Venkateswarlu et al.,1989).However,joint spacing and layer thickness do not give any indication for relative proportion of small and large spacings due to the nature of their average spacing values.For this reason,RQD value suggested by Deere(1964)is generally used.Similarly,it is difficult to understand joints formed from a single origin or more.Moreover,multiple joint sets propagate faster,and thereby they need to be considered for rock classification.Number of joints suggested by NGI-Q system(Barton et al.,1974)is considered in GRMR to account for the same reason.With this,orientation of these joints(Bieniawski,1993)is considered to account for strike and dip orientation depending on application.For joint condition,the roughness value(Bieniawski,1993)and type of filling(material)are considered(Barton et al.,1974).
To account for groundwater,its pressure(Barton et al.,1974;Bieniawski,1993)or flow rate and weatherability(Venkateswarlu et al.,1989)or weathering(Miščevic and Vlastelica,2014)of rock masses towards water is considered.Weatherability can be calibrated by slake durability number test suggested in CMRI-RMR system.The nature of rock stresses(Barton et al.,1974)changes after excavation is done.This will cause instability in opening.To account for this instability,rock stress parameter has been considered in this system with depth of excavation(to account for ease of working at higher depth).With above parameters,the effect of swelling or squeezing rocks(Barton et al.,1974)is also considered by suitable factor.Presence of weakness zones(Barton et al.,1974)reduces the rock mass strength and also needs to be considered.To summarize above discussion,the GRMR and rock load are considered to be the functions of the following factors:rock strength,breakage in rock,groundwater,rock stresses,swelling or squeezing of rock,and weakness zones.
3.3.Methodology
The existing method,B-RMR system,uses six rock parameters which are not directly similar to other six parameters of NGI-Q system and other five parameters of CMRI-RMR system.In the present work,it was attempted to combine these parameters(all together 15 parameters)which are likely to be independent.Each of these 15 parameters is analyzed according to its base classification method(s)for rock load(which is the basis for support design and treated as the post process of rock classification).It is expected that the calculated rock load value should be unique of a given set of rock parameters irrespective of the classification methodology encountered).Therefore,establishing a RMR classification method on the basis of rock load seems to be more realistic.The variation of rock load with respect to individual rock parameter value determines the parameter’s influence,and a relative rating was assigned to the parameter according to their weights or influences.Finally,the ratings corresponding to all parameters were combined to obtain a final numerical value as the base method does.Towards rock load calculation,two approaches are presented.The first approach will be applicable for rock field with influences of all parameters(ground condition).The second approach is for intermediate rock condition where only selected rock parameters are involved.Out of these approaches,the best one is to be chosen,which will represent actual field conditions more closely.
3.4.Rating allocation
In the GRMR system,the rating of each rock parameter is assigned on the basis of a sensitivity analysis for rock load.For each rock parameter,the rock load is found out using the empirical formula suggested by the related RMR classification method,while keeping other rock parameters at their average values(as shown in Table 2).If a rock parameter is common in multiple RMR methods,the average value of the rock loads obtained by the rock load equations corresponding to different RMR systems was considered.The difference between the maximum and minimum rock loads(δ)for the entire range(as suggested by the existing RMR systems)of each rock parameter is calculated.
The percentage sensitivity of thei-th rock parameter,Si,is calculated as

It is to be noted that the larger variations of rock load indicate that the corresponding rock parameter has more influence or is having higher sensitivity towards determining RMR value.
Using similar technique,sensitivities(S)of all parameters are calculated.It should be noted that when determiningS,fluctuation in rock load was considered,not the actual values of rock loads.As a result,it avoids the effect of variation of safety factors on rock load among the base RMR methods.For any given parameter,the correspondingSvalue suggests the contribution of that parameter,and will be the maximum influence or rating to find the RMR value.
The percentage sensitivity values for various rock parameters calculated using Eq.(10)are listed in Table 7.It was observed that RS is the most dominating parameter.This is because in case ofunderground excavation,the stress field is disturbed and instability in structure will be induced.The higher the initial stresses are,the higher the instability after excavation will be.LT indicates spacing between bedding planes which is desirable to be at its maximum value to reduce layer-by-layer collapse of roof.The LT is observed to be the second most influencing parameter(12.38%).Similar to the stresses,the faults present in rock masses increase instability.These faults are represented by structural index.LT,SOD and RQD will tell about how much is rock fractured but not about its future severity.NOJ indicates this future severity,which shows thatS=9.52%.A rock mass containing a single continuous joint with high fracture is always more stable than multiple jointed rocks.This is because multiple jointed rocks propagate fracture in multiple directions.With this,the COD(roughness)will also affect roof separation and collapse.The rough joints will have frictional force to help them against separation.In this analysis,weight associated with COD is 8.34%.The above-mentioned parameters are associated with the stress condition and fracture in rocks.With this,groundwater also affects the behavior of rock masses.The amount of groundwater and pressure(GWP)shows thatS=6.04%whereas rock response to this groundwater(WD)shows 7.88%.The UCS of rock scales the effect of other parameters in its low value.It has been given the weight of 5.26%.S&S makes rock masses weak,and herein is weighted 5.39%.With this,RQD,SOD and AOJ in rock joints have been given the weights of 4.9%,3.6%and 3.96%,respectively.NOWZ is observed in few rocks but cannot be ignored(S=3.16%).DOW is found the least sensitivity withS=2.51%.This variation in rockload will decide the variation of rating for all parameters.For this,the gradient of rock load curve was found out,and the same gradient was applied for rating variation.
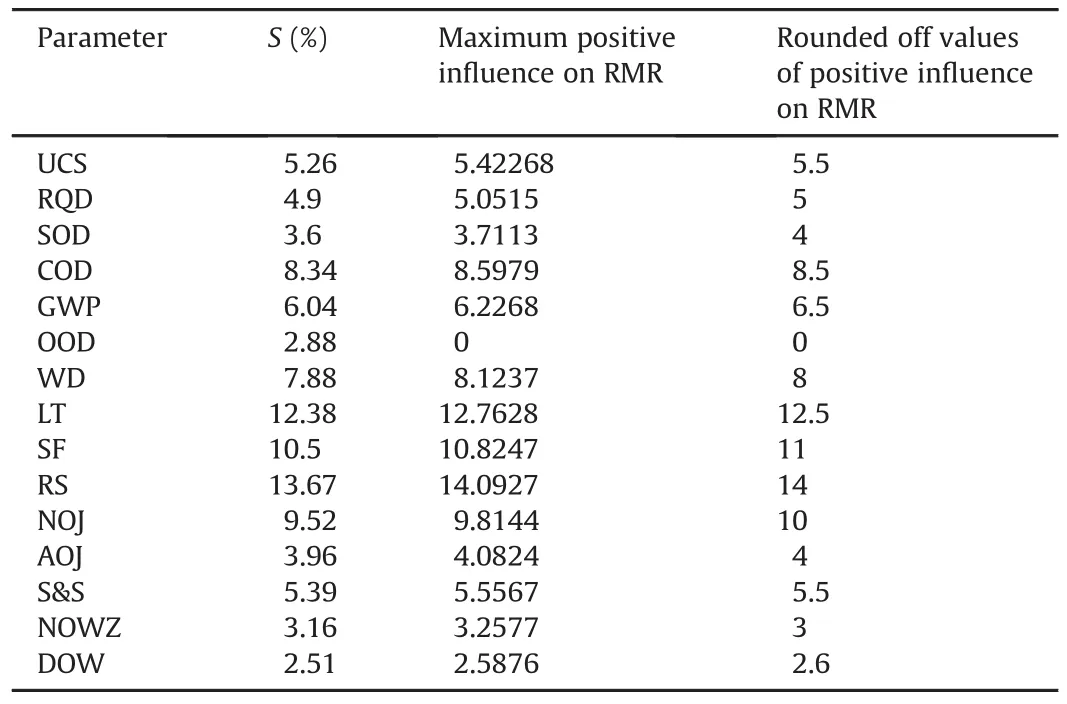
Table 7Sensitivities of rock parameters to rock load values.
The sensitivity value(S)directly expresses the importance of that parameter compared to rest of the parameters.Here,theseSvalues are converted directly into the maximum ratings except OOD.OOD is an adjustment parameter for discontinuity orientation and is given a negative rating.This is because the influence of OOD depends on application(such as mine/tunnel,slope,or foundation).Here,the OOD is considered only for mine/tunnel application.
The maximum positive influence of a rock parameter towards RMR is recalculated based on its sensitivity keeping the totalSicorresponding to all rock parameters equals 100%,and the maximum positive influence of OOD equals zero.The rounded off values of maximum positive influences of rock parameters are also listed in Table 7.
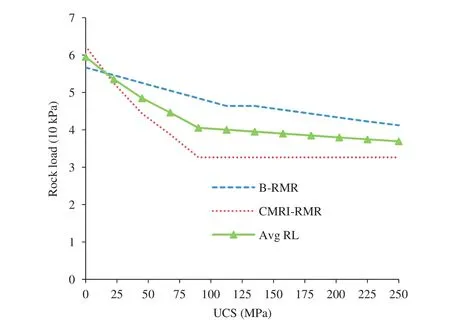
Fig.2.Variation of average RL with UCS.
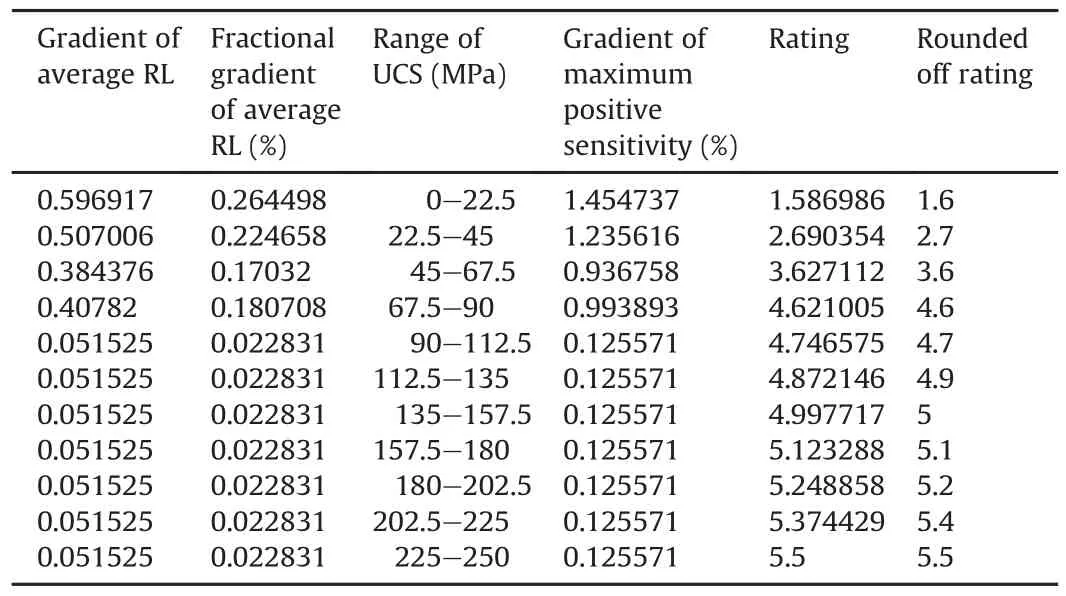
Table 8Zones and corresponding ratings of UCS in GRMR.
3.5.Finding GRMR
Like other methods,first the entire range of a rock parameter is divided into a number of zones.Finding an optimum number of divisions/zones of rock parameter range is important,with respect to the complexity of the RMR system,especially when a larger number of rock parameters associated with RMR system are involved.The range of a rock parameter is decided based on the fact that all the corresponding base RMR methods in which the rock parameter is considered are taken into account.In order to find the number of divisions,the variation of effective rockload(average RL)with respect to a rock parameter is evaluated.The effective rock load of a rock parameter is the same as the rock load when the parameter is considered by only one RMR system(among that considered in the present paper).Otherwise an average of the rock loads is considered as the average RL(if multiple base RMR methods consider the rock parameter).Then,an analysis of the average RL vs.rock parameter plot is made to identify the zones for which an approximately constant gradient is valid.Fig.2 presents the average RL vs.UCS plot,and the different zones are found based on the(approximate)constant gradient and the corresponding ratings are listed in Table 8.Using the same methodology,the ratings of other rock parameters are determined.Table 9 presents the divisions of various rock parameters with allocation ratings.The GWP in Table 9 is represented in 0-1 scale.The conversions of GWP scale with rate of water seepage are presented in Table 10.
For any given rock mass site,the rock mass properties considered by GRMR method are to be computed as described earlier.Then,corresponding rating can be selected and called asR1,R2,…,R15.The final value of GRMR can be calculated by
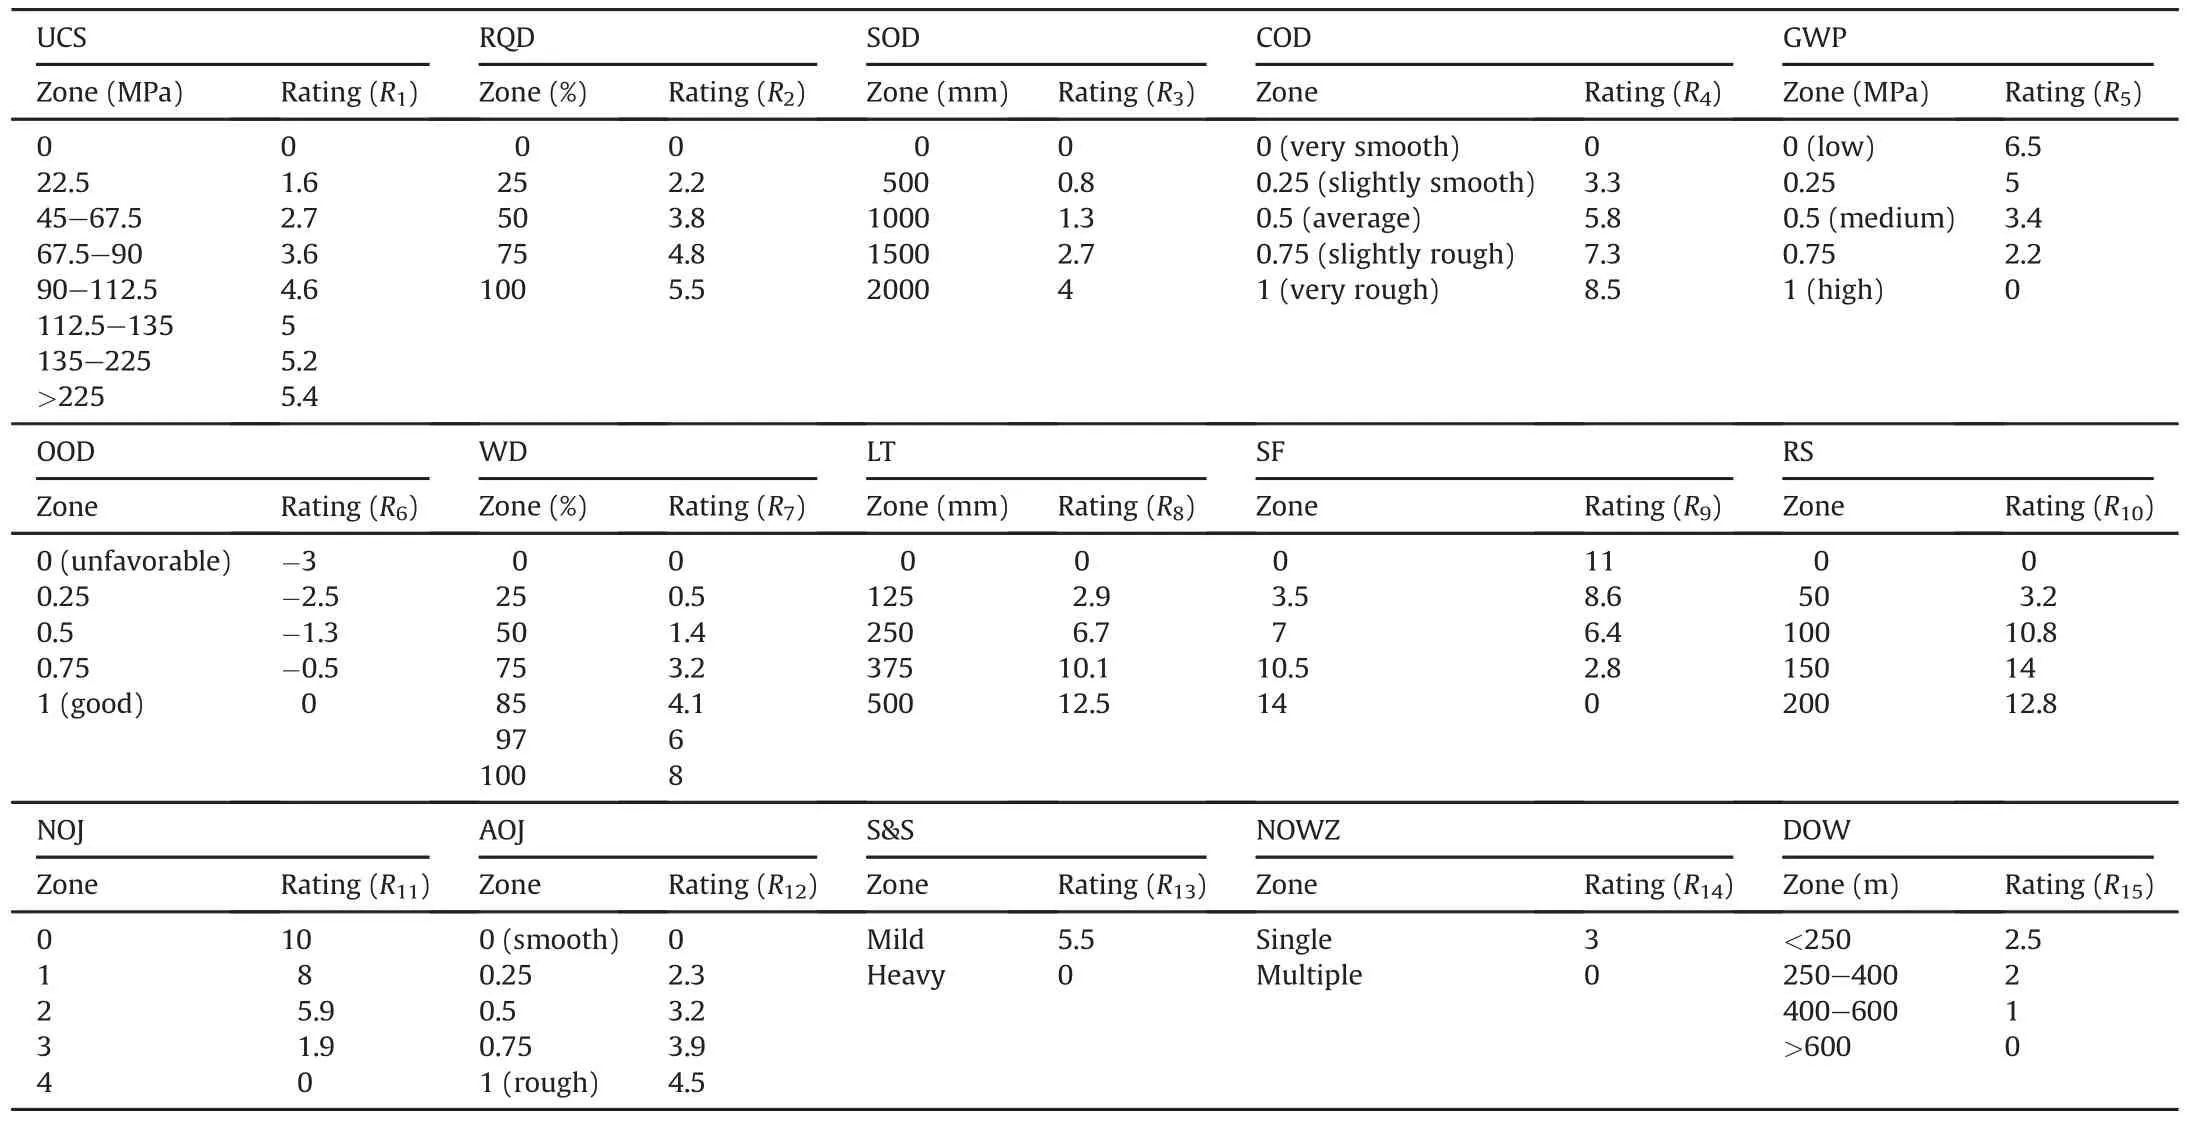
Table 9Rating values of different rock parameters in GRMR system.

Table 10Groundwater guidelines.

As such in GRMR method,most of the rock information is considered in terms of 15 parameters presented in Table 1.But stability of underground excavations also depends on the method of rock excavation.With blasting,heavy external stress caused instability occurs.The adjustment factor(k1)has been suggested to account for excavation method(presented in Table 11).The further part of the paper will take adjusted GRMR and will be simply written as GRMR.Using adjustment factor,k,the RMR is corrected as follows:

The value of adjusted GRMR can be used to classify rocks into five classes,which are the same as that observed in the existing systems.The basis for classification method of adjusted GRMR is the rock load values.In this method,for each GRMR value(in the range of 0-100),the rock load value is calculated using the numerical approach discussed in Section 3.6.Using this rock load,the RMR values and the corresponding rock mass classes are calculated by B-RMR,NGI-Q and CMRI-RMR systems.One hundred different RMR values are considered.By analyzing the classes obtained by BRMR,NGI-Q and CMRI-RMR methods(which are almost similar),five classes of rock masses in GRMR system are determined,as given in Table 12.

Table 11Adjustment factors in GRMR.
3.6.Rock load calculation
The formation of new techniques and equations in spite of having old ones is always an attempt to obtain better results.In this section,rock load calculation is underlined.There are bunch of equations available to calculate rock load.However,the available equations fail to consider all rock parameters in rock load calculation.The rock load estimation is of prime importance for designing support in underground mining.In rock masses,it is also a function of rock quality and rock density.The rock load equation is considered in the following form:

wherec1,c2,c3andnare the unknown constants.
To find out the above four unknowns,it requires some kind of rock load basis.As mentioned earlier,the rock load equations suggested by the B-RMR,NGI-Q and CMRI-RMR methods were considered as the basis.The huge computational datasets have been generated to calculate rock parameter values and corresponding rock load can be obtained by

Table 12Rock classification using GRMR.

wherePB-RMR,PNGI-QandPCMRI-RMRare the rock loads calculated by Eqs.(2),(5)and(8),respectively;xr,xqandxcrepresent the relative weights comparing to base methods B-RMR,NGI-Q and CMRI-RMR,respectively.The following two approaches were suggested for assigning the values of weight factorsxr,xqandxc.
(1)Approach 1
In this approach,a large number of training datasets(N=3.5?107)of rock parameters are considered.The rock load is calculated for each training dataset using three base RMR methods(BRMR,NGI-Q and CMRI-RMR).Then,a combined rock load(Pavg)which is equivalent toPGRMRis calculated by taking a simple average of the rock loads obtained using the three base RMR methods.That means the values ofxf,xqandxcbecome 1/3.Based on thesePavgvalues corresponding to different training sets,the values of unknown parameters(c1,c2,c3andn)of Eq.(13)are found out through appropriate fitting by solving the corresponding optimization problem.
(2)Approach 2
The second approach primarily considers the rock conditions where the parameters of all base RMR methods are unlikely to be presented.In this approach,there are two tasks for developing rock load equation for the GRMR system.The same training datasets
The second task is to take into account the dependence of rock load on individual datasets and it is called dynamic criterion.It was found that,in certain conditions,the method which includes less number of parameters(or rated less in GRMR)can also have a higher influence on rock load,if the parameters associated with it have more dominance comparing to other methods.Under such situations,it is necessary to weight such system more comparing to other systems.This depends on individual dataset(on rock field)irrespective of method and its importance in GRMR.A simple statistics is given below to accomplish this task.Thexvalues can be determined by the following equations:
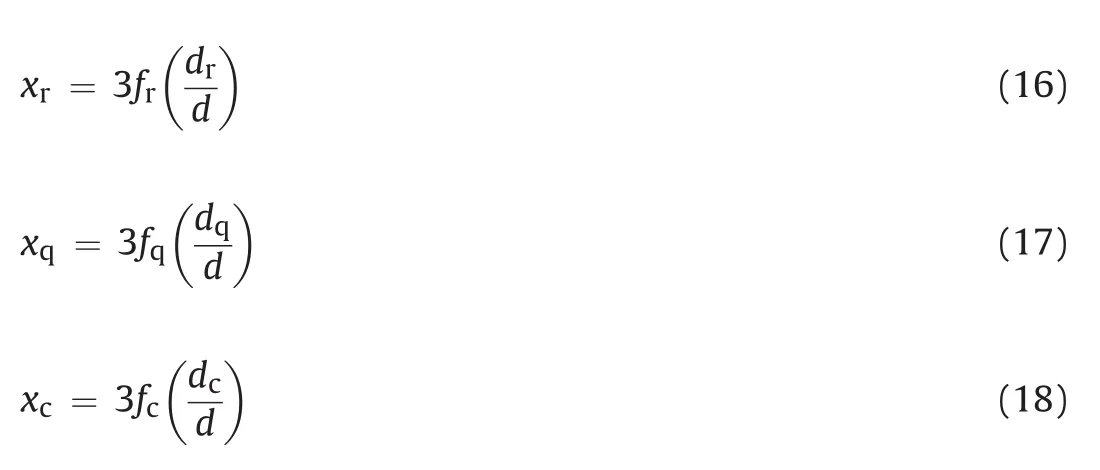
wheredr=Grmax/Gr;dq=Gqmax/Gq;dc=Gcmax/Gc;d=dr+dq+dc;andGr,GqandGcare the sums of actual GRMR ratings found for the rock parameters associated with B-RMR,NGI-Q and CMRI-RMR,respectively,in any given dataset.By substituting the values ofxr,xqandxcin Eq.(14),Pavgwhich is equivalent toPGRMRis calculated.Similar to Approach 1,the values of unknown parameters(c1,c2,c3andn)of Eq.(13)are obtained through an appropriate fitting.
The problem of appropriate fitting to find the unknown parameters in Eq.(13)is basically an optimization problem which is defined as follows:

used in Approach 1 are considered in Approach 2.
The first task is to consider the dependence of rock load on the base methods,and the importance in GRMR system.To this end,a factor,f,is calculated for each base method.Since the value offremains the same for all rock datasets,it is called static criterion.The values of static criterion factors,fr,fqandfcfor the base RMR methods B-RMR,NGI-Q and CMRI-RMR,are respectively calculated as follows:
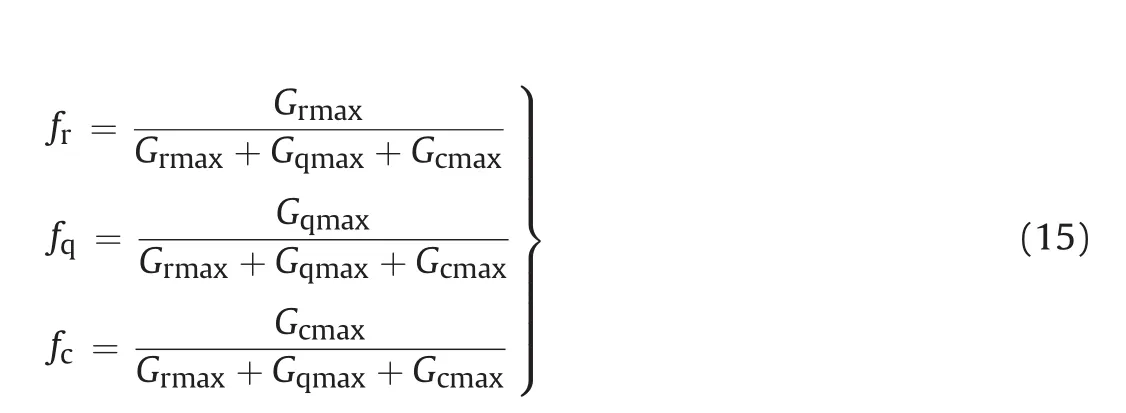
whereGrmax,GqmaxandGcmaxare the sums of the maximum ratings from GRMR table(Table9)for rock parameters associated with the BRMR, NGI-QandCMRI-RMR, respectively.Among the three baseRMR methods,NGI-Q systemconsiders the highest number of parameters and also has a greater importance(fq=0.449)in GRMR,followed by CMRI-RMR system(fc=0.326)and B-RMR system(fr=0.225).
wherePGRMR_actualandPGRMR_calculatedare the rock loads found based on Approach 1 or 2 and optimization process,respectively.
Genetic algorithm(GA)(Goldberg,1989)which is a search and optimization technique mimics the principle of natural selection and natural genetics to find the best solution for a specific problem.GA is used here to solve the presented optimization problem.GA operates on a population of feasible solutions by applying the principle of survival of the fittest to produce better approximations to a solution.At each generation,a new set of approximations is created by the process of selecting individuals according to their level of fitness in the problem domain and breeding them together using operators borrowed from natural genetics.This process leads to the evolution of populations of individuals that are better suited to their environment than the individuals that they were created from,just as in natural adaptation.Various GA variables,such as population size,chromosome length,number of generations in each run,crossover probability and mutation probabilities,are considered as 30,20,30,0.9 and 0.01,respectively.The gallery width(B)and rock density(D)were taken as 4.5 m and 2290 kg/m3,respectively.
The feasible solution for Approach 1 is obtained with GA-fitness value(average error)of 30.232%and the rock load equation for GRMR is expressed by

Table 13Comparative results of GRMR with other methods.

Analogous to Approach 1,the solution for Approach 2 is obtained with 34.9631%GA-fitness and the corresponding rock load equation is expressed as

4.Comparative analysis of GRMR with other methods
Initially,the proposed GRMR was tested for randomly generated rock data.The rock mass is considered to have the following properties:UCS=200 MPa;RQD=40%;SOD=1500 mm with slightly rough condition,favorable orientation and with frictional filler material;GWP=0.5 MPa;WD=97%;LT=500 mm;structural index=11;stress ratio=100;two pairs of joints with no swelling,no weakness zones and working depth of 200 m.The comparative results of GRMR with other existing RMR system are presented in Table 13.In this table,the rock load in GRMR is calculated using Eq.(20).The width(B)and rock density(D)were taken as 4.5 m and 2290 kg/m3,respectively.
The purpose of arbitrary data based comparison of GRMR system with various approaches is to have a preliminary understanding about GRMR system behavior.From Table 13,it is observed that the rock class and rock load obtained from GRMR method have a slight variation from the results found in the existing RMR methods.However,by simultaneous comparisons with all methods,the value of rock load in GRMR is found quite reasonable and acceptable.
A study has been carried out for comparison of GRMR method with the existing RMR methods using Indian coal mine data.Primarily,data are collected from three mine sites located in different places of India,i.e.Jhamuria,Jarangdih and Maheshpur.For three case studies,the values of RMR,type of rock and corresponding rock loads obtained using different RMR systems are presented in Table 14.
In the first case study,various rock parameters were measured at Central Jhamuria(ECL)coal mine site and it was found to be weak rock site.Though excavation on this site is comparatively easy,support load will be very high and needs special attention for recommendation of support.First of all,it should be understood that RMR values cannot have direct comparison,due to hypothetical ratings assigned to individual rock properties by inventor of the technique.Also,there is no any standard scale of results available for validation of RMR system.But irrespective of method,rock load should be unique for a particular site and thus,it can have some sense of comparison.In the first case study,the rock load predicted by GRMR method is found to lie in between the rock loads evaluated by rest of the RMR methods,and it is very closer to their average value.The second case study was carried out using data collected at Jarangdih(CCL)coal mine which was found to be good quality rock site.Rockload suggested by CMRI-RMR system is about 8.36 kPa.But due to unfavorable orientation of discontinuities which is not included by CMRI-RMR method,the B-RMR system predicts higher load of 23.7 kPa.Whereas in GRMR system(Approach 2),rock load is found to be 23.148 kPa.In the third case study,the comparison was carried out based on the data at Maheshpur(BCCL)coal mine where fair quality of rock mass was observed.The rock load in GRMR system(57.7 kPa)is found to be higher than that observed in B-RMR and CMRI-RMR,but lower than NGI-Q.
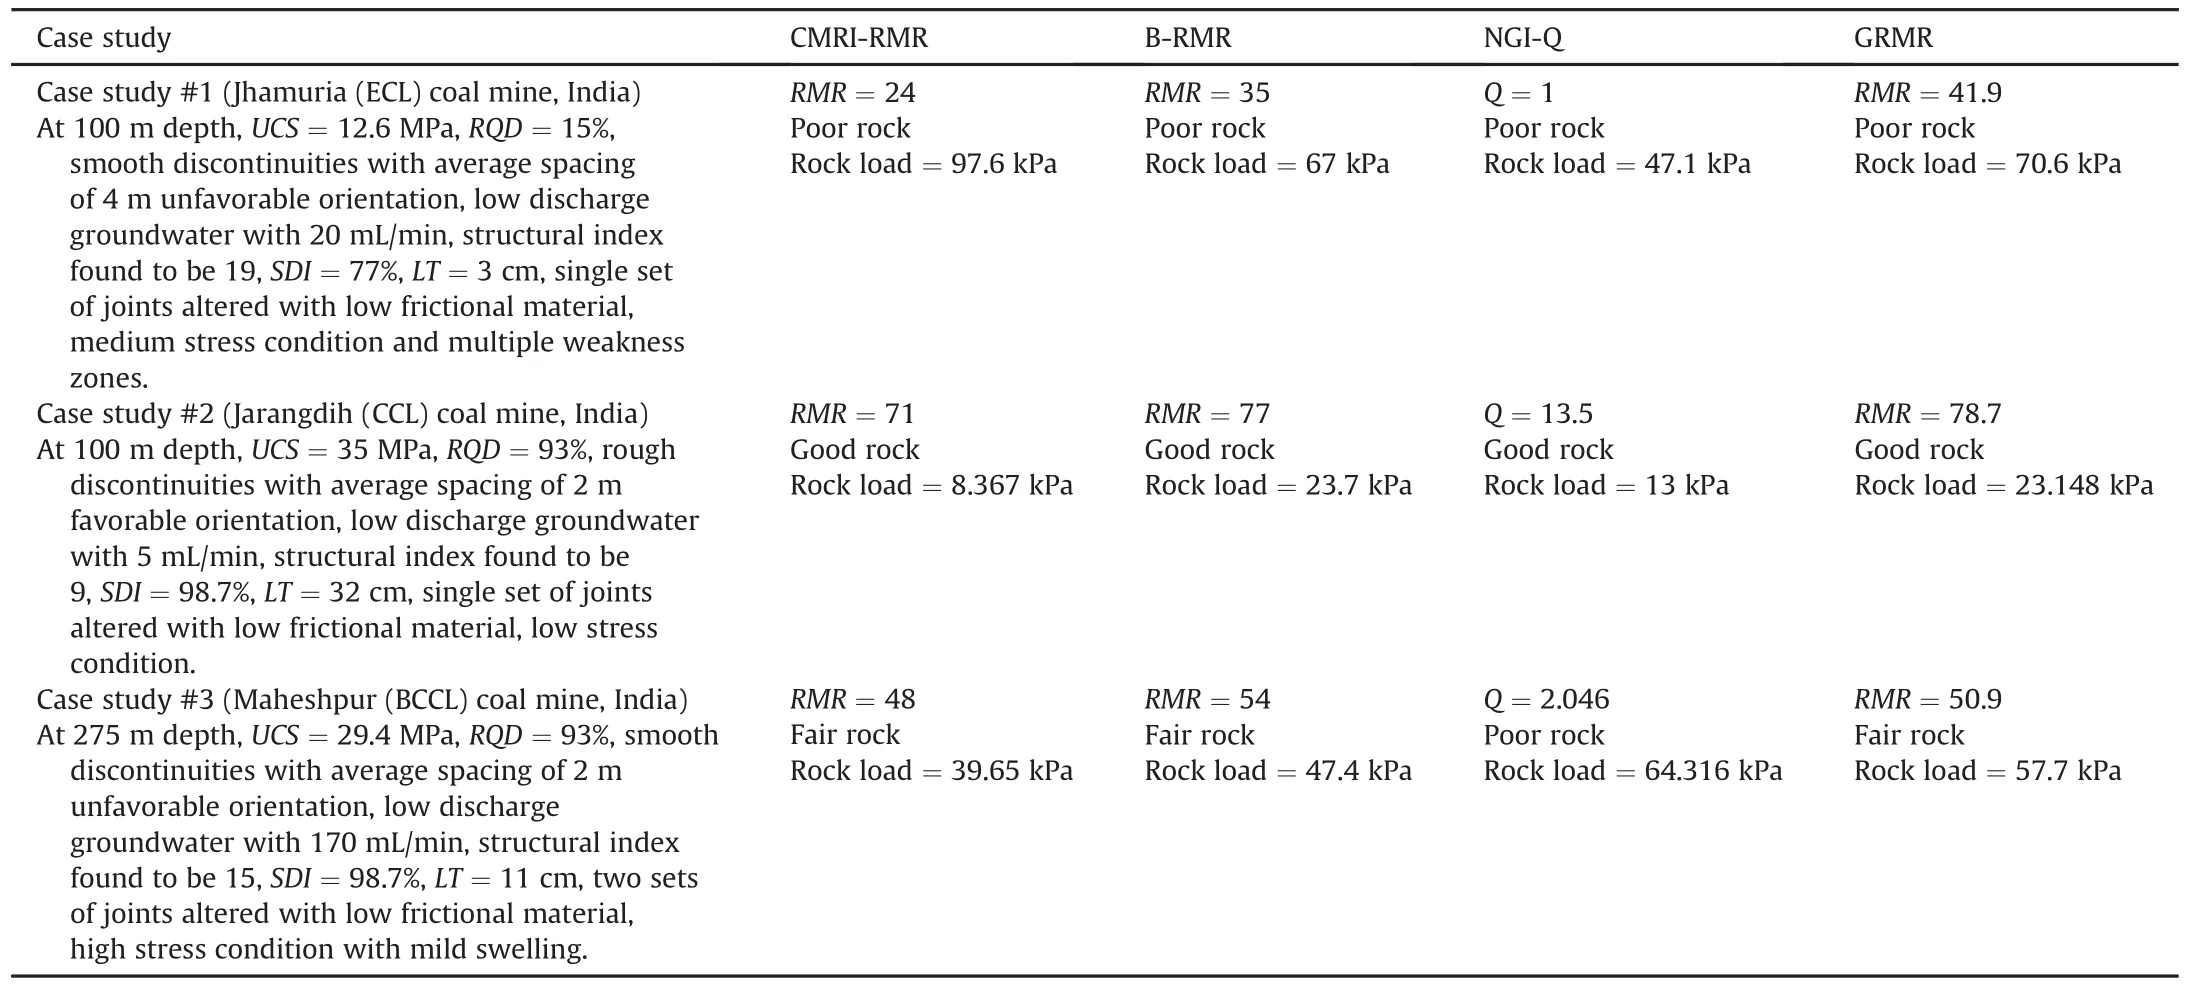
Table 14Comparison of GRMR with other methods based on coal mines data.
5.ANN modeling of GRMR system
RMR systems are basically empirical and nonlinear in nature.This is typically due to the shortage of data available in system development.This makes systems discrete in a given range of input parameter values(e.g.rating is 2 if working depth lies between 250 m and 400 m,and the depths of 250 m and 400 m are treated as the same),which is really not a case in actual scenario.To make the RMR system continuous,an attempt is made to develop a mathematical model using data-driven modeling technique.The effectiveness of ANN has been proved in modeling of such nonlinear systems.Recently,ANN is widely used in the area of rock engineering.Hong et al.(2017)used ANN to model geological strength index(GSI)system.ANN is a biologically inspired system that mimics the human nervous system.Similar to human brain,it possesses a number of neurons connected together with weighted connections(Homik et al.,1989).In this study,we used single hidden layer network with ten neurons.
Various ANN variables(such as training-learning algorithms and activation function)are selected based on a study conducted by Khatik et al.(2017).The activation function,satlins(symmetric saturating linear transfer function)whose output falls in between-1 and 1(for a given input vector,the output of activation function turns to 1 when the function input is 1 or greater,and-1 when it is-1 or less),is used for both input-output layer neurons of ANN.The total data available(1.5?107datasets,each dataset contains 15 inputs(rock parameters)and 1 output(RMR value))were randomly divided into two parts.Seventy percent data are used for training the network,and 30%of data are used for testing and validation of the network.The batch training was used with Levenberg Marquardt back-propagation(trainlm)algorithm.During learning of ANN,the values of weight and bias of the network are updated according to the learning rules which are defined byan appropriate algorithm(Homik et al.,1989).Here,Learngd(gradient descent weight/bias based learning function)with a constant learning rate(0.01)was used to minimize error function.The error function is mathematically represented as

wherexkis the vector of current weight and bias,dkis the current gradient,andαkis the learning rate.
The final(trained)ANN structure and the corresponding network weight-bias values are presented in Fig.3 and Table 15,respectively.In Fig.3,the notations of network inputs correspond to the rock parameters,as presented in Table 16.It is noted that the sequence of inputs is different from that of Table 1.ILN,HLN and OLN represent the input,hidden and output layer neurons,respectively.The weight values are mentioned between two successive layer neurons,e.g.-0.0694 is the weight between ILN1 and HLN1(1 represents the neuron number).BHL and BOL show the bias values for hidden and output neurons,respectively.No bias is used for input layer neurons.
Based on the network structure(Fig.3)and weight and bias values(Table 15),GRMR value can be determined directly for any arbitrary values of 15 rock mass parameters(within the range mentioned in Table 9).The ANN result is calculated by

wheregis thesatlinsactivation function;Wijandare the weight values between input-hidden and hidden-output layers,respectively;W0j=b1jandx0=1.
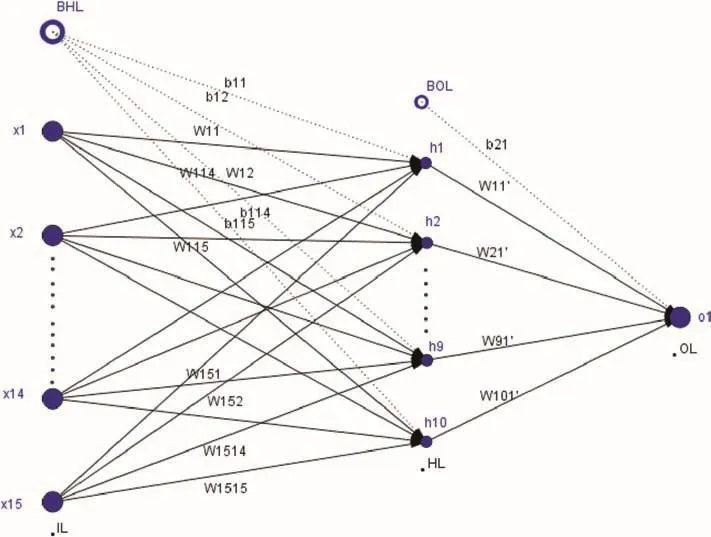
Fig.3.ANN structure for modeling of GRMR method.

Table 15Weight and bias values for ANN structure.
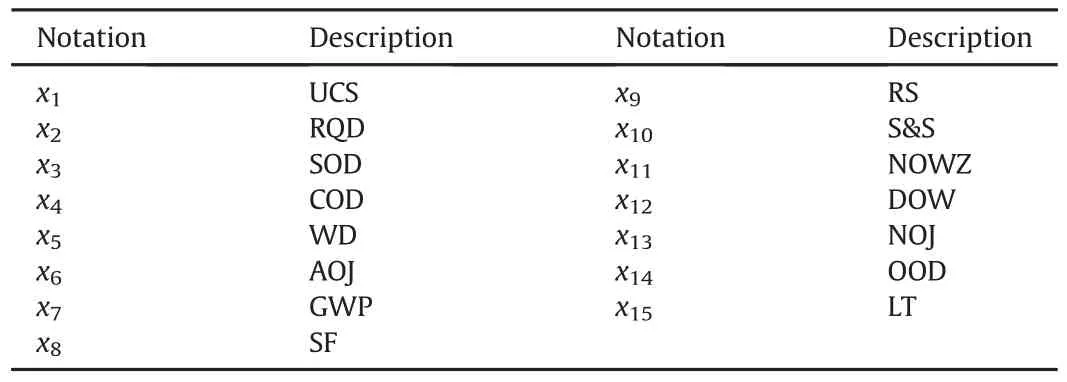
Table 16Notations for ANN inputs corresponding to rock parameters.
The performance of GRMR model was observed for all rock parameters.Two of them,UCS and RS,are plotted in Figs.4 and 5,respectively.We can see from Fig.4 that GRMR predicted by ANN model shows a linear relationship with UCS.For UCS between 75 MPa and 175 MPa,the GRMR predicted by ANN model is very similar to that of proposed method.In Fig.5,the rock stress factor up to 150(inversely proportional to rock stresses)increases GRMR and then reduces for both proposed method and ANN model.Similar study was also conducted considering other rock parameters,and the model predictions were found very close to the analytical method of GRMR(with accuracy of 85%-95%).
6.Conclusions
Based on the rock load analysis of three most commonly used rock mass classification systems and with additional case histories,a new GRMR is presented.The GRMR system takes into account the effects of 15 rock parameters,and the order of importance of these parameters is decided from their sensitivities to rock load.Consideration of more number of parameters makes the system more reliable.Two equations have been suggested to find the rock load in GRMR system,in which the first one(Eq.(20))should be used when all 15 rock parameters have influence;whereas,if few of the 15 parameters are sensitive,then the second equation(Eq.(21))can be used.The accuracy of the proposed method can be further improved by adding a number of case studies.An ANN-based semiempirical model is developed for the GRMR method.The ANN model results are found to be very close to that of the analytical GRMR predictions.
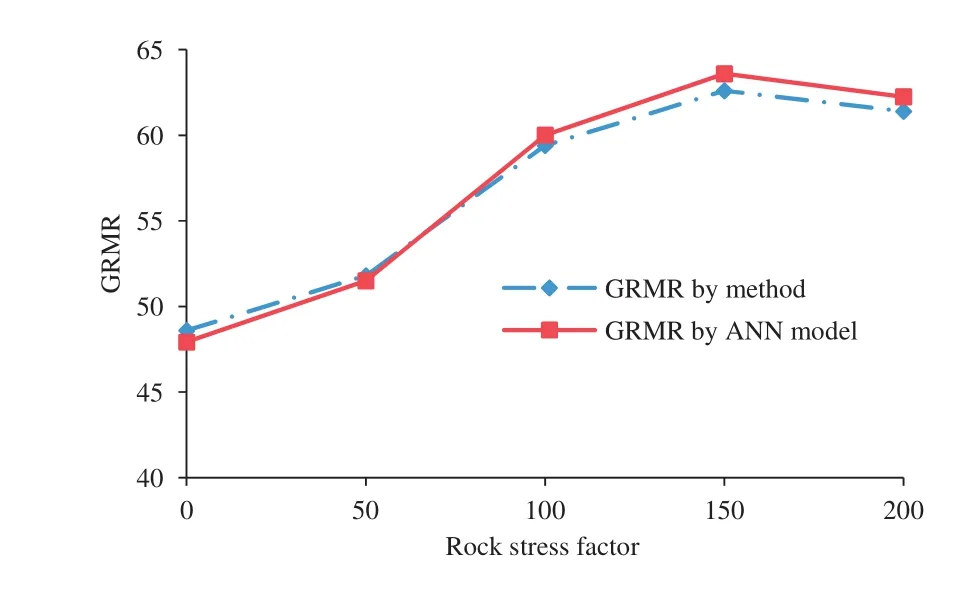
Fig.5.Variations of GRMR with rock stress factor.
Conflicts of interest
The authors wish to confirm that there are no known conflicts of interest associated with this publication and there has been no significant financial support for this work that could have influenced its outcome.
Acknowledgement
This work is an outcome of the Network project(Project No.ESC0303)of CSIR,New Delhi,India.The authors also wish to thank Mr.Leeladhar Rajput of Industrial and Production Engineering Department,Institute of Technology,Guru Ghasidas University,Bilaspur and Prof.Harish Hirani,Director of CSIR-Central Mechanical Engineering Research Institute,Durgapur for their constant support and encouragement for this work.Authors are also thankful to scientists of CSIR-Central Institute of Mining and Fuel Research,India for providing real coal mine data to carry out the validation work of the proposed GRMR system.The authors are thankful to the reviewers and editor for their valuable suggestions to improve the quality of the paper.
Akin M.Slope stability problems and back analysis in heavily jointed rock mass:a case study from Manisa,Turkey.Rock Mechanics and Rock Engineering 2013;46(2):359-71.
Aksoy CO.Review of rock mass rating classification:historical developments,applications,and restrictions.Journal of Mining Science 2008;44(1):51-63.
Barton N,Lien R,Lunde J.Engineering classification of rock masses for design of tunnel support.Rock Mechanics 1974;6(4):189-236.
Bieniawski ZT.Engineering classification of jointed rock masses.Transaction of South African Institution of Civil Engineering 1973;15(12):335-44.
Bieniawski ZT.Estimating the strength of rock materials.Journal of the South African Institute of Mining and Metallurgy 1974;3:312-20.
Bieniawski ZT.Rock mechanics design in mining and tunneling.Rotterdam:A.A.Balkema;1984.
Bieniawski ZT.Engineering rock mass classifications:a complete manual for Engineers and Geologists in Mining,Civil and Petroleum Engineering.Wiley;1989.
Bieniawski ZT.Classification of rock masses for engineering:the RMR system and future trends.In:Hudson JA,editor.Comprehensive Rock Engineering,vol.3.New York:Pergamon Press;1993.p.553-73.
Central Mining Research Institute(CMRI).Geomechanical classification of roof rocks vis-à-vis roof supports.S&T Project Report.Dhanbad,India:CMRI;1987.
Deere DU.Technical description of rock cores.Rock Mechanics and Engineering Geology 1964;1:16-22.
Deere DU,Hendron AJ,Patton FD,Cording EJ.Design of surface and near surface construction in rock.In:Failure and breakage of rock.Of the 8th US Symposium on Rock Mechanics.American Rock Mechanics Association;1967.p.237-302.
Goldberg DE.Genetic algorithms for search,optimization,and machine learning.Reading,MA,USA:Addision-Wesley;1989.
Homik K,Stinchcombe M,White H.Multilayer feed forward networks are universal approximators.Neural Networks 1989;2(5):359-66.
Hong K,Han E,Kang K.Determination of geological strength index of jointed rock mass based on image processing.Journal of Rock Mechanics and Geotechnical Engineering 2017;9(4):702-8.
Hudson JA,Harris JP.Engineering rock mechanics.Elsevier;1997.
Khatik VM,Rajput L,Nandi AK.A study on finding optimal ANN model for rock mass classification.In:Proceedings of International Conference on Next Generation Mining&Fuel Research;2017.p.565-74.
Li X,Gong F,Tao M,Dong L,Du K,Ma C,Zhou Z,Yin T.Failure mechanism and coupled static-dynamic loading theory in deep hard rock mining:a review.Journal of Rock Mechanics and Geotechnical Engineering 2017;9(4):767-82.
Miščevi′c P,Vlastelica G.Impact of weathering on slope stability in soft rock mass.Journal of Rock Mechanics and Geotechnical Engineering 2014;6(3):240-50.
National Institute of Rock Mechanics(NIRM).Annual report(2008-09).NIRM,Ministry of mines.Government of India;2008.
Noorian Bidgoli M,Zhao ZH,Jing L.Numerical evaluation of strength and deformability of fractured rocks.Journal of Rock Mechanics and Geotechnical Engineering 2013;5(6):419-30.
Palmstrom A.Comparing the RMR,Q and RMi classification systems.2008.http://www.rockmass.net.
Palmstron A,Broch E.Use and misuse of rock mass classification systems with particular reference to the Q-system.Tunnels and Underground Space Technology 2006;21(6):575-93.
Panthee S,Singh PK,Kainthola A,Singh TN.Control of rock joint parameters on deformation of tunnel opening.Journal of Rock Mechanics and Geotechnical Engineering 2016;8(4):489-98.
Paul A,Murthy VMSR,Singh AK.Rock load estimation in development galleries and junctions for underground coal mines:a CMRI-ISM rock mass rating approach.Journal of Mining 2014.https://doi.org/10.1155/2014/618719.
Sen Z,Sadagah BH.Modified rock mass classification system by continuous rating.Engineering Geology 2003;67(3/4):269-80.
Venkateswarlu V,Ghose AK,Raju NM.Rock mass classification for design of roof support-a statistical evaluation of parameters.Mining Science and Technology 1989;8(2):97-107.
Zhang L.Determination and applications of rock quality designation(RQD).Journal of Rock Mechanics and Geotec hnical Engineering 2016;8(3):389-97.
 Journal of Rock Mechanics and Geotechnical Engineering2018年1期
- Journal of Rock Mechanics and Geotechnical Engineering的其它文章
- Anisotropy effect on strengths of metamorphic rocks
- Influence of loading and heating processes on elastic and geomechanical properties of eclogites and granulites
- Geomechanical characterization of volcanic rocks using empirical systems and data mining techniques
- Investigation of creep behaviours of gypsum specimens with flaws under different uniaxial loads
- Effects of lime addition on geotechnical properties of sedimentary soil in Curitiba,Brazil
- Corrigendum to“Back-analysing rock mass modulus from monitoring data of two tunnels in Sydney,Australia”[J Rock Mech Geotech Eng 5(2017)877-891]
