Volumetric analysis of rock mass instability around haulage drifts in underground mines
Shahé Shnorhokian,Bryce MacNeil,Hani S.Mitri
Department of Mining and Materials Engineering,McGill University,Montreal,H3A 0E8,Canada
1.Introduction
Haulage networks comprising drifts and crosscuts are the main ore transportation routes used in underground mining,and their continuous stability during ore extraction is a key requirement for the safety and profitability of a mining operation.For thicker orebodies,drifts are usually excavated parallel to the orebody strike while crosscuts are extended perpendicular to it from the footwall side to the hanging wall contact.They are developed previous to,or concurrently with,mining operations in a given ore block depending on the mining method.In the sublevel open stoping method and its variations,the haulage network needs to be in place prior to the commencement of ore extraction,and therefore constitutes a considerable capital expenditure(Lawrence,1998;Hamrin,2001;Bullock,2011).This also implies that it has to remain stable for a longer period of time under continuously changing mining-induced stresses.Sublevel open stoping is a popular method used in hard rock mines within the Canadian Shield due to the presence of favorable conditions there(Mining Sourcebook,2007).
The initial redistribution of in situ stresses caused by the development of the haulage network-as well as its distance from the orebody-is taken into account when choosing the mining method.Operational and ground control considerations must be addressed when choosing the distance since the best option for one factor might not be desirable for the other.As an example,operational optimization favors a network as close to the orebody as possible to limit the development footage and ore haulage distance.On the other hand,controlling the rock mass behavior and limiting its instability will require a further distance from the stope openings.In terms of stress perturbations,the ones generated due to the excavation of the network are relatively minor when compared to the redistribution caused by ore production and extraction of the much larger stopes.Furthermore,different sequence alternatives will induce stress redistributions that can vary to a great extent in terms of magnitude and orientation,rendering them crucial tools for controlling the overall behavior of a rock mass(Villaescusa,2014).The choice as to the optimum sequence scenario can be made based on ground control(Potvin and Hudyma,2000;Kaiser et al.,2001;Beck and Sandy,2003;Villaescusa,2003;Wiles et al.,2004;Bewick et al.,2009;Trifu and Suorineni,2009;Cepuritis et al.,2010;Laubscher,2011;Perman et al.,2011;Sjöberg et al.,2012;Jooste and Malan,2015),economic(Poniewierski et al.,2003;Manchuk,2007;Nehringet al.,2012;Bai et al.,2013),and operational(Pelley,1994;Pareja,2000)factors and a vast literature exists on guidelines and case studies.In some mining methods,a certain amount of flexibility can be entertained regarding the stope sequence scenario while in others ground conditions,it may present considerable restrictions(Carter,2011;Stephan,2011).
The interaction of the local geological settings with different sequence scenarios is best studied using numerical modeling(Board et al.,2001;Jing,2003;Wiles,2006;Castro et al.,2012).For an entire ore block or implications on a mine-wide scale,three dimensional(3D)models are better suited so as to capture induced stress changes along any of the three axis directions.With the development of computer technology and the availability of affordable commercial codes,the comparison of several sequence scenarios can be accomplished within an acceptable period of time as numerous studies have demonstrated(Diering and Laubscher,1986;Contador and Glavic,2001;Turner and Beck,2002;Beck and Sandy,2003;Wiles,2005;Villaescusa,2008;Yaoand Moreau-Verlaan,2010;Perman et al.,2011;Sjöberg et al.,2012;Counter,2014;Jooste and Malan,2015).However,it is vital for the model to first be calibrated and validated based on site observations of rock behavior,rock mass properties,and stress measurements(Beck et al.,1997;Diederichs et al.,2002;Wiles,2007). Variations in properties used as input parameters for the model have impacts on the final results and there are suggested guidelines as to how to address the issue(Wiles,2006;Bewick and Kaiser,2009;Idris et al.,2011;Cai,2011).Once the calibration step has been completed,the model can then be used for the prediction of future stress and deformation developments in the rock mass,and compared to instability criteria to verify if any potential issues are likely to occur.
The main type of instability encountered around haulage networks is dependent on the rock mass properties,the presence of nearby geological structures,and in situ stress regimes.Relaxation or concentration of redistributed stresses at locations around an ore block is a result of interactions between the geological formations and structures,the stope openings,and the principal stresses.For example,gravity-related instability is expected in zones where a drop is recorded in confining stress(Hoek et al.,1995;Hudson and Harrison,1997;Martin et al.,1999a),compressive or shear failure may occur where the major principal component increases without added confinement(Martin,1997;Castro et al.,1997;Martin et al.,1999b;Kaiser et al.,2000;Brady and Brown,2006;Cai and Kaiser,2014),and tensile conditions result in failure as well as significant rock mass damage(Cai et al.,1998;Diederichs and Kaiser,1999;Diederichs et al.,2004).Hence,while numerical modeling will provide displacement and stress redistribution contours in the vicinity of an underground haulage network,these should then be compared to instability criteria based on the prevailing geological conditions(Martin et al.,2003)as has been done for numerous case studies(Martin et al.,1999b;Kaiser et al.,2001;Wiles et al.,2004;Zhang and Mitri,2008;Raju et al.,2015;Cai and Kaiser,2014;Hoek and Martin,2014).An excellent summary is provided by Kaiser et al.(2000)regarding potential modes of instability for underground haulage networks under different stress conditions.
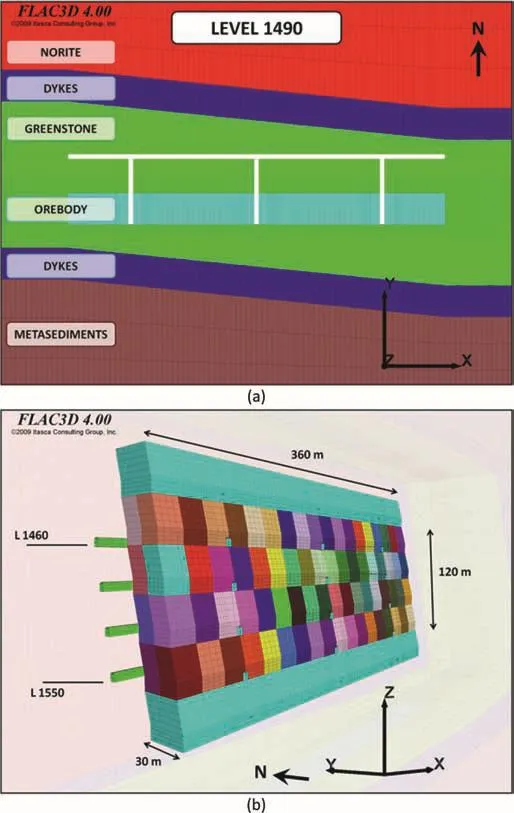
Fig.1.(a)Plan view of the simplified model showing all geological formations on L 1490;(b)3D view of the orebody showing the active levels,stopes,and dimensions.
In this paper,a 3D numerical model of a typical hard rock mine in the Canadian Shield was constructed in the finite difference code FLAC3D(Itasca,2006).The geological formations represented,their rock mass properties,and the premining stress magnitudes and orientations were based on a case study mine.Volumetric analysis was conducted for the three rock mass instability criteria compression,tension,and shear-to provide a quantitative assessment for two stope sequence scenarios.The focus of the study was the main haulage drift and three crosscuts on one of the levels,as well as the stopes above and below them.
2.Methodology
In order to conduct a realistic study of rock mass instability around a haulage network,a FLAC3Dmodel was constructed with simplified geological formations typically found in the Canadian Shield.
2.1.Model setup
A tabular orebody was constructed that extended 360 m along an EW strike and dipped steeply at 80°to the south.The host rocks comprised metavolcanic deposits dominated by a green stone formation.A stiff norite formation was located in the north and a more ductile one made up of metasediments bordered it in the south.Two igneous dyke intrusions striking WNW-ENE ran sub-parallel to the orebody on either side.
Based on common dimensions in mining methods using the sublevel open stoping approach,the vertical distance between levels was set at 30 m.Mining was implemented from the bottom up on four active levels-L 1550,L 1520,L 1490,and L 1460-from a depth of 1550 m to 1430 m.A plan view of all the geological formations on L 1490 is presented in Fig.1a.
Stopes were dimensioned at 20 m in length along the strike,15 m in width,and 30 m in height.Given the dimensions and tabular shape of the orebody,this translated into 18 stopes along the strike and 2 stopes perpendicular to it from hanging wall to footwall per level for a total of 36.Since there were four active levels,the total numberof stopes mined in the simulations was 144,each one having a volume of 9000 m3for a total of 324,000 m3per level and a grand total of 1,296,000 m3for all active levels.This is visually presented in Fig.1b.
The haulage network on each level was excavated in the footwall part of the green stone formation and consisted of a single EW drift along the orebody strike.Three crosscuts perpendicular to it were also extended through the stopes until the contact with the hanging wall.The drift was constructed at a constant distance of 30 m from the orebody contact on all levels.The three crosscuts were located 120 m from one another in the western,central,and eastern sections of the footwall.Crosscuts are more numerous in mines,and provide access to each mining block;however,only three were used in this study to keep the model relatively simple.They were 60 m in length with the first half in the green stone formation and the second half in the orebody.Drift and crosscut dimensions were based on those typically used in Canadian mines with a 5 m×5 m cross-section and a 1-m arch above the center of the roof.Details of the haulage network are shown in Fig.2a.
The model dimensions were 840 m along the EW axis,390 m along the NS one,and 300 m in depth.A total of 862,400 zones were created with the mesh density increasing in the zones of interest such as the drifts,crosscuts,and stopes,and decreasing away from them towards the external boundaries.A 3D view of the model with the four active levels is presented in Fig.2b.
2.2.Premining stresses
The generation of premining stresses is a crucial step in the setup of a numerical model since it influences subsequent mining induced stresses and deformations.If in situ stress measurements or rock mass displacement data are available,model readings can be compared to them and fine-tuned to achieve final calibration.Several techniques are mentioned in the literature for generating premining stresses,such as using rollers on all six boundaries with displacement restricted in directions perpendicular to them.Another technique is the use of rollers on the vertical and bottom boundaries with stress applied at the top of the model.In this study,a third approach was used where the bottom boundary was placed on rollers and stresses were applied on the remaining ones(McKinnon,2001;Shnorhokian et al.,2014).Since the geological formations and geometries were based on a case study mine at similar depths,boundary stresses were modified such that readings in the model were comparable to two in situ measurement points at a depth of 1490 m within the norite formation and north dyke.Comparisons were also made with readings in these two geological units on L 1400 and L 1580 to verify that stress variation with depth occurred at rates measured within the Canadian Shield(Brown and Hoek,1978;Arjang and Herget,1997).The values on all three levels and the in situ measurements on L 1490 are presented in Table 1,with the proximity of the model readings to the field ones reported as a percentage in the final row.This is obtained by converting the ratio of model to in situ reading of each of the six stress components on L 1490 to a percentage value.
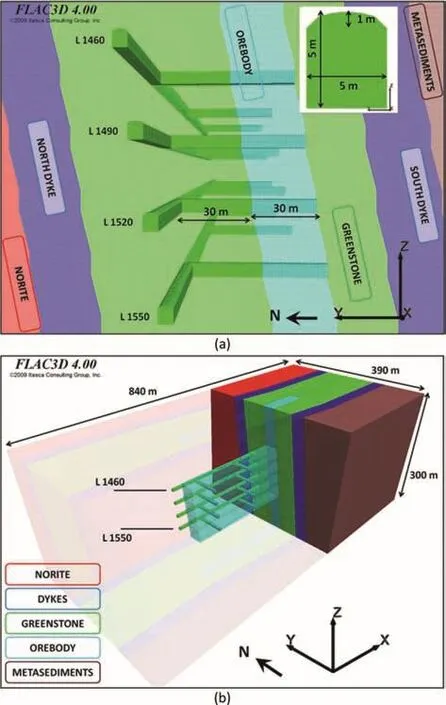
Fig.2.(a)Vertical cross-section showing the drifts and crosscuts and their dimensions;(b)3D cut-view showing the geological formations and the studied ore block.
2.3.Rock mass properties
Similar to the geometry of the geological formations in this study,the rock mass properties for the model were based on a case study mine in the Canadian Shield.Laboratory test results from intact rock samples-including density,unconfined compressive strength(UCS),Young’s modulus(Ei),and Poisson’s Ratio(ν)-were analyzed in terms of magnitude range intervals and frequency of occurrence.The results were classified into minimum,average,maximum,and most likely values,the last one being based on the interval with the highest frequency of results.Borehole logs indicating the rock mass rating(RMR)for different formations were also analyzed and classified in a similar fashion.The most likely values from the laboratory results and borehole logs were then combined to derive the most likely properties,such as the rock mass modulus(Erm),and these were used as input parameters for the numerical model as presented in Table 2.In order to maximize stress readings and conduct a more conservative analysis,the model was run in linear elastic mode in this initial phase of the study;comparisons with runs conducted in elastoplastic Mohr-Coulomb mode will be conducted in a separate study.

Table 1In situ stress measurements and model readings.

Table 2Rock and rock mass properties of geological formations.
2.4.Stope sequence scenarios
Once the premining stresses were generated,drifts and crosscuts on all active levels were simultaneously excavated in a single step.Two stope sequence scenarios,moving from the bottom up,were then implemented for the orebody.In the first one,ore extraction proceeded in an alternating manner from its western and eastern boundaries towards the center,forming a diminishing pillar that was eventually mined out.In the second case,the stopes were mined starting from the center and-alternating between the eastern and western fronts-moved out towards the sides.Ore extraction was conducted at a rate of six stopes per stage for both scenarios and resulted in a total of 24 mining stages,after which all 144 stopes were extracted.A graphical presentation of the two stope sequence scenarios is shown in Fig.3a and b,with each stage comprising mining and backfilling the six designated stopes.Paste backfill properties were used based on values reported by Pierce(1997)and it was simulated as an elastic-perfectly plastic Mohr-Coulomb material(Table 2).
2.5.Instability criteria
Rock mass instability near underground openings is a topic that has been extensively studied due to its applications in civil and mining engineering.Failure occurs in the rock mass because of compressive,tensile,or shear mechanisms,or various combinations thereof.A rich literature exists for many case studies and there are a number of instability criteria that attempt to predict potential issues under similar stress conditions.The topic has also been studied at length for drifts and tunnels in Canadian underground mining and research applications,especially as related to induced seismicity(Kaiser,1993;Martin et al.,1998,1999b;Andrieux and Simser,2001;Cai et al.,2001;Young and Collins,2001;Diederichs et al.,2004;Malek et al.,2008;Bewick et al.,2009;Trifu and Suorineni,2009;Yao et al.,2009;Hudyma and Potvin,2010;Cai and Kaiser,2014).A graphical summary categorized instability into four regions based on the relationship between the major(σ1)and minor(σ3)principal stresses(Diederichs,1999).Induced seismicity was observed to occur when the differential stress(σ1-σ3)exceeded 0.3 to 0.4 of the UCS of the rock(Castro and McCreath,1996;Martin et al.,1999b).Castro et al.(2012)indicated that brittle shear failure occurred when this difference exceeded a value of 0.7 when compared to the UCS.The ratio of differential stress to the UCS is commonly used as an indicator of induced seismicity and rockburst based on these guidelines.The formula for brittle failure is given as(Castro et al.,2012):
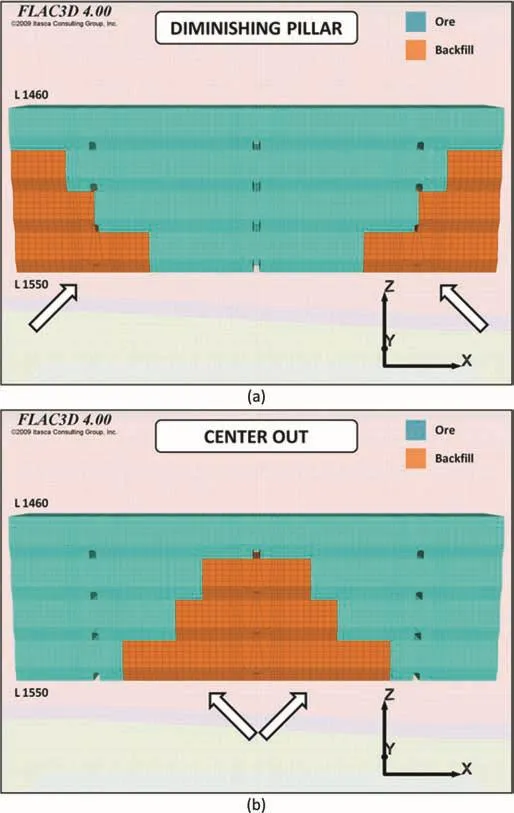
Fig.3.(a)Front view of the studied ore block at Stage 6-diminishing pillar sequence scenario;(b)Front view of the studied ore block at Stage 6-center-out sequence scenario.

whereBSRis the brittle shear ratio.
In addition to shear-related instability,conditions for the occurrence of compressive and tensile failures were also given in the same reference.These types are particularly important in the proximity of underground openings due to their requirement for low confinement or tensile stress that occurs because of stress redistributions around the void space.
Instability indicators used in this study were thus based on these three mechanisms.TheBSRwas monitored during each of the 24 mining stages based on the UCS of the geological formation in which it occurred.Zones of low compressive(0-1 MPa)and tensile(less than 0)stresses for the minor principal stress(σ3)were also taken into consideration for all mining stages.The major principal stress(σ1)in the former was compared to the UCS value of the rock for potential compressive failure as indicated in Eq.(2),while the presence of tension in any zone rendered the rock mass unstable due to the very weak tensile strength of all geological formations.Eq.(3)presents the condition for tensile failure using the rock mechanics convention with tension considered as negative.Although calculations were conducted for the entire model,detailed analysis focused on unstable rock mass around drift,crosscut,or stope openings.

2.6.Volumetric analysis
Numerical modeling can be used to study the presence of potential instability around underground mine openings based on several criteria,and can also provide quantitative data regarding the unstable rock mass encountered(Cai et al.,2001;Wiles,2006;Cepuritis et al.,2010;Shnorhokian et al.,2015).In this paper,numerical modeling was combined with volumetric analysis to conduct a quantitative comparison of instability between two different sequence scenarios.The volume of zones in the model with stress values above a given instability threshold were noted but detailed analysis was restricted to those within the region of interest.Due to the locations of the drifts and crosscuts,this comprised zones within the orebody and greenstone formation only.Hence,the total volume of all unstable zones within the stopes was compared-in percentage form-to that of the orebody in the region of interest.For those within the greenstone formation,the sums of unstable rock mass were reported in cubic meters as the very large volume of this geological unit resulted in small values when percentages were used.
In addition to these,the total volume of extracted ore from the region of interest was reported at each stage as a percentage of the orebody.While these values were identical for the two stope sequence scenarios-albeit the stopes being located in different sections of the orebody-this was a useful parameter to relate instability on a given level to the volume of ore mined below,alongside,or above it.
2.7.Geographical regions
The model was constructed and simplified in such a way that all geological formations,including the orebody,were symmetrical in shape and trend.The only anomalies were the north and south dykes with their WNW-ESE orientations.The orebody and the greenstone formation hosting it were therefore divided into three geographical regions for combined numerical-volumetric analysis:western,central,and eastern regions.Each of these comprised 120 m of the haulage drift and orebody along the strike,as well as one of the three crosscuts.In the western part,the north dyke lay further from the drift at 44 mwhile the southern dyke was closer to the stopes at 28 m.In the easternpart,the conditions were reversed and the northern dyke was closer to the drift at 20 m and the southern dyke lay further from the stopes at 52 m,as can be seen in Fig.1a.However,it is important to note that the relative proximity of the formations in the eastern and western sections remained consistent with depth.Hence,the distance of 44 m between the north dyke and the drift remained the same on all levels.
3.Results and discussion
An initial review of the modeling results indicated that trends were very similar on all four mining levels,with a relatively small increase in instability with depth due to a higher premining stress regime.This was due to the overall symmetry of the formations,the constant distance of 30 m between the drifts and the orebody,and the consistency in the north and southdyke distances from the drift and orebody,respectively.A general assessment was first conducted regarding the location of unstable rock mass based on the three criteria and their implications.A more detailed volumetric analysis was then performed,which was restricted to the two intermediate active levels(between depths of 1520-1460 m)and the haulage network on L 1490 between them.Since the drifts and crosscuts occupied the first 5-6 m on a given level,the stopes between L 1490 and L 1460 were adjacent to and above the network being studied,while the stopes between L 1520 and L 1490 were below them.
3.1.Shear failure(BSR)
TheBSRis a useful indicator of instability caused by a shear mechanism,with values of 0.3 and 0.7 being given as the thresholds for microseismic activity related to rock mass damage and major seismicity,respectively(Martin et al.,1999b;Kaiser et al.,2000;Castro et al.,2012).A qualitative assessment of the modeling results indicated that regions above the 0.7 threshold were mostly restricted to the mining fronts within the orebody.Rock mass withBSRvalues above 0.3 was naturally more voluminous and extended into the greenstone formation in the foot wall and hanging wall.Regions affected by theBSRthreshold of 0.7 are shown in Fig.4a and b for the diminishing pillar(Stage 8)and the center-out(Stage 16)sequences,respectively.These stages were chosen as they constituted the period immediately prior to mining the stopes hosting the western and eastern crosscuts on L 1490.In addition to the orebody,relatively small regions immediately adjacent to it within the green stone formation also indicated stresses above theBSRthreshold during several stages.However,the bulk of potential shear instability was restricted to the orebody itself.
Table 3 presents a quantitative evaluation of the total volume of instability due to highBSRvalues within the orebody(in%)and greenstone formation(in m3)at key stages for the two stope sequence scenarios.The assessment was conducted separately for L 1520 and L 1490 in terms of percentage of extracted ore and the volume of unstable rock mass.An initial trend that emerged from the analysis was that the quantities were negligibly small for the greenstone formation.For example,the largest volume obtained in the diminishing pillar sequence was 170m3at Stage 24where as the orebody hosted approximately 55,000 m3(17%out of 324,000 m3ore per level)of unstable rock mass at Stage 16 in the same scenario.A second observation is that the values onL 1520 were within the same range but somewhat lower than the ones on L 1490 in both sequence scenarios.This is to be expected because of the direction in which the mining fronts moved from the bottom upwards.With ore depletion on each successive lower level,mining induced stresses were pushed into the remaining rock mass on top of it and led to an increase inσ1values.Since the bulk of the instability was located within the orebody,the percentages there could be used for comparison between the two sequence scenarios.
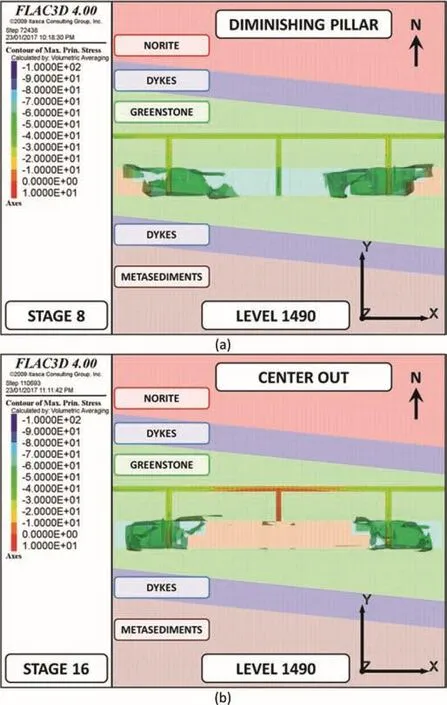
Fig.4.(a)Plan view showing shear instability(BSR≥0.7)in dark green at Stage 8-diminishing pillar sequence scenario;(b)Plan view showing shear instability(BSR≥0.7)in dark green at Stage 16-center-out sequence scenario.
Fig.5 graphically presents the volume of ore above theBSRthreshold for both options on the two levels studied.As mentioned above,L 1520 consistently comprised a smaller volume of unstable rock mass than L 1490 with Stage 2 comprising the sole exception.This was due to the ore extraction on L 1550 below since no mining had yet taken place on L 1520 at that time.With continuous extraction between Stages 2 and 8,as well as the commencement of mining on L 1490 at Stage 6,the volume of unstable rock mass on L 1520 decreased,fluctuating between 5%and 10%for the remainder of the sequence scenarios.The percentages on L 1490 increased sharply between Stages 4 and 8 and similarly fluctuated-albeit within a higher interval between 8%and 21%-until Stage 20,after which they decreased to zero upon depletion of all remaining ore.
On both levels,the center-out sequence scenario presented a larger volume of ore with stresses above theBSRthreshold of 0.7 during most of the mining stages.The quantitative differences between the two approaches can be read from Table 3 and range between 0.5%and 4.5%.The diminishing pillar option values were lowered by 0.5%-2%from Stage 16 onwards.While a maximum difference of 5%is not an overly significant one,it translates into a volume of approximately 14,000 m3or the size of 1.5 stopes out of the original 72 on both levels.To understand the reason for these differences between the sequence scenarios,it is important to determine their locations within the orebody and the three sections(western,central,and eastern),a topic that will be examined in a future publication.
3.2.Compressive failure
Under very low to non-existent confinement conditions that exist near underground openings,high compressive stresses result in spalling or slabbing(Diederichs, 1999;Kaiser et al.,2000;Cai and Kaiser,2014;Hoek and Martin,2014).The mechanism at work is similar to an unconfined compression test and therefore a comparison can be made between the major principal stress(σ1)and the rock strength as to whether this might cause potential instability.Similar to the trends noted forBSRconditions above 0.7,it was observed that the volume of rock mass where compressive stress exceeded its strength was restricted to the mining fronts within the orebody.No potentially unstable zones were detected within the greenstone formation due to its much higher UCS value of 277 MPa;the magnitude of mining-inducedσ1rarely reached a value of 260 MPa during the sequence scenarios.
Table 4 presents the volume of unstable rock mass within the orebody since the results confirmed that these were restricted to stopeslocated at the eastern and western mining fronts.Furthermore,when compared to the volume under unstableBSRconditions,the quantities for compressive instability under very low confinement were relatively negligible.The largest values obtained were in the range of 650 m3for a given level,and similar trends to the ones in theBSRanalysis were noted when comparing L 1490 and L 1520.The quantity of potentially unstable rock mass on the upper level was mostly larger than the ones below.This can be seen graphically in Fig.6 where another similarity with theBRSresults was noted,which was that the center-out sequence exhibited a larger volume of instability than the diminishing pillar one in general,except during Stages 8 and 20.Additional analysis is required to determine the location(s)whence these differences originate,and this will be covered in a separate study.

Table 3Volumetric comparison of shear instability(BSR≥0.7).
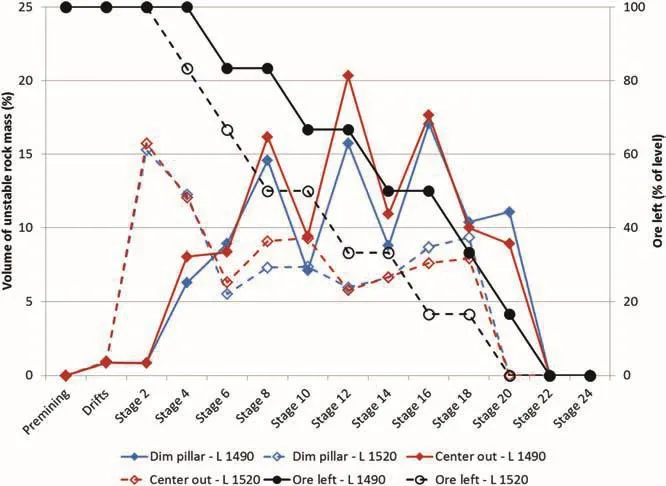
Fig.5.Volumetric comparison of shear instability(BSR≥0.7)in orebody and ore left-L 1490 and L 1520.

Table 4Volumetric comparison of compressive instability-orebody(m3).
3.3.Tensile failure
It is well-known that,in general,rock mass is a very weak material in tension.In order to be conservative in approach,the relatively small tensile strength of the geological formations obtained from laboratory tests and borehole logs was ignored.Instability was deemed to occur when the minor principal stress(σ3)crossed the no-confinement threshold into the tensile region.Fig.7a and b presents theσ3distribution at Stage 12 for both the diminishing pillar and center-out options near the western and central crosscuts,respectively.The key observation is that unlike the shear and compressive mechanisms,tensile instability was not restricted to the orebody.It extended into the greenstone formation on the footwall and hanging wall sides and therefore constituted the only instability mechanism that also occurred within the host rock.The extent and relative volume of unstable rock mass in the greenstone formation would have several practical implications for the mining operation.Instability in the footwall section would affect the crosscuts and-depending on its lateral extent-could even reach the intersection with the haulage drift.In addition,unstable rock mass immediately adjacent to the orebody on either side would fall into the stopes and create unplanned ore dilution.Volumetric analysis would therefore be also useful in quantifying dilution from the host rock.
Table 5 provides a quantitative evaluation of instability due to tensile failure for the two sequence scenarios.As with the qualitative approach,it indicates that significant volumes of the greenstone formation were affected throughout the mining stages.Apart from the fact that it was the sole major instability mechanism in the host rock,the analysis highlights a crucial characteristic regarding unstable rock mass in the footwall and hanging wall.As shown in Table 5,while this volume fluctuated during the mining stages within the orebody and was reduced to zero upon ore depletion,instability in the greenstone formation persisted even at the end of Stage 24 once all the stopes had been backfilled.This is because other geological formations were not mined out and any instability condition that might have been induced due to ore extraction remained locked in the rock mass.
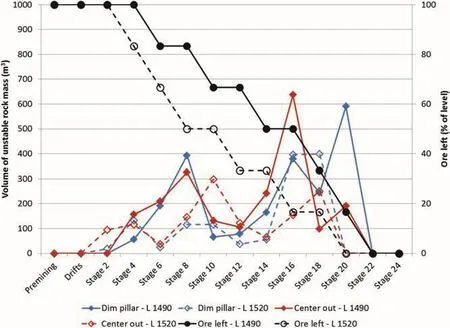
Fig.6.Volumetric comparison of compressive instability in orebody and ore left-L 1490 and L 1520.
In terms of a quantitative analysis,a number of interesting points can be observed.First,the total volume of tensile instability was larger for L 1520 than for L 1490 in the orebody and the greenstone formation during several stages,in contrast to the trends with theBSRand compressive criteria.This is expected because higher stresses were induced in the upperlevels,leading to elevatedBSRand compressive stress magnitudes.These same conditions naturally led to lower stresses on L 1520,resulting in more voluminous zones in tension there.Second,in terms of sequence scenarios,the trends were reversed with the diminishing pillar option resulting in larger volumes of instability especially in the greenstone formation.In the orebody,the percentages were similar between the two sequence scenarios and higher values alternated between the two as the stages progressed.However,as can be seen graphically in Fig.8,the diminishing pillar sequence consistently exceeded the center-out one in potential instability within the greenstone formation on both L 1520 and L 1490.
Based on the findings above,the need for a more detailed volumetric analysis is obvious so as to identify the locations where these differences are concentrated.Tensile instability,unlike theBSRand compressive mechanisms,extends to the host rock and has the potential to remain in place even after mining operations have been completed on a given level.Furthermore,it has dual ground stability and economic implications,with a potential to disrupt operations in the ore haulage network and to cause unplanned ore dilution.Hence,further analysis was conducted in which the total volume of unstable rock mass was considered on L 1520 and L 1490,but a distinction was made between the footwall and hanging wall sides.
3.4.Impact on footwall and hanging wall
With the existing symmetry in all formations except the north and south dykes,and the steep dip of the orebody,the only difference between the footwall and hanging wall was the haulage network located in the former.Hence,a comparison of instability on either side of the orebody would assess the impact of the network on mining-induced stresses and vice versa.In Fig.9,a graphical presentation is given of potential tensile instability for the two sequence scenarios,and the numerical values of key stages are provided in Table 6.
The first observation is that the volume of unstable rock mass was consistently larger in the footwall,which is to be expected because of the presence of the haulage network there.The maximum difference was 3500 m3for the diminishing pillar and 3200 m3for the center-out sequence during all the stages except the final one.An interesting point is that the trend was reversed at Stage 24 and instability in the hanging wall exceeded that of the footwall.The reason for this is that this volume is related to that ofBSRinstability in the orebody,based on a comparison of the location of these zones.The sections of the orebody with a highBSRvalue were observed to lie adjacent to areas of tensile instability in the footwall.Therefore,with the depletion of stopes at Stage 24 and the disappearance of zones withBSR>0.7,the volume of tensile instability in the host rock decreased significantly.
The second observation is that the instability in the footwall was at a maximum at Stage 12 for the two sequence scenarios,and remained elevated until the end when it decreased down to a lower value at Stage 24.As for the hanging wall,it exhibited maximum tensile instability at Stages 16 and 8 for the diminishing pillar and center-out sequences,respectively.These coincide with extraction taking place in the central portion of the orebody and the presence of elevated levels ofBSRthere,as can be observed from Table 3.A third characteristic is that despite the large volume of potentially unstable orebody with respect to theBSR,the shear criterion does not seem to be very influential in the host rock for either stope sequence option.The volume of rock mass withBSR>0.7 does not exceed 215 m3in the footwall or hanging wall.
Based on these findings,several important operational implications can be derived.First,where tensile instability is concerned,the diminishing pillar sequence was potentially riskier for the footwall and the haulage network there,in addition to economic concerns with respect to unplanned dilution.Second,this option was also more unfavorable of the two in the hanging wall despite the fact that a sudden rise in instability there at Stage 24 would not be of much concern from a safety point of view.Thirdly,the sudden decrease in the volume of unstable rock mass in the footwall was observed to be related to the one within the orebody despite the fact that the instability criterion was different in each formation.
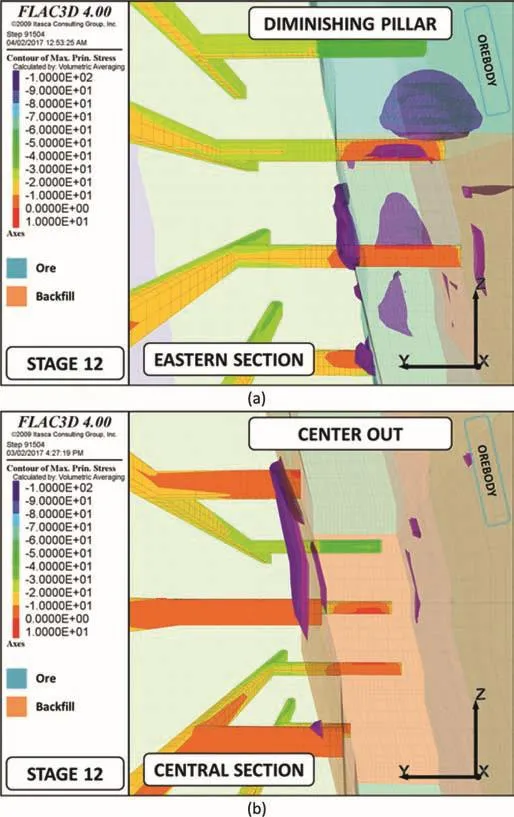
Fig.7.(a)Cross-sectional view showing locations of tensile instability in purple at Stage 12 at the eastern crosscut-diminishing pillar sequence scenario;(b)Cross sectional view showing locations of tensile instability in purple at Stage 12 at the central crosscut-center-out sequence scenario.
With the differences in tensile instability clarified between the two sequence scenarios in terms of the footwall and hanging wall,further analysis is required to examine the impact of relative proximity to the dykes on the percentages.This is especially important for theBSRand compressive instability criteria as these were restricted to the orebody,and considerations regarding the footwall or hanging wall did not apply for them.These differences will be examined in the future along with the impact of variations in rock mass properties of individual formations.
The larger volume of unstable rock mass in the orebody with respect to the shear and tensile mechanisms required reporting them in percentages in Tables 3 and 5.For the center-out sequence,the cumulative volume of instability(in m3)for the even numbered stages presented in Figs.5,6,and 8 were626,065 m3(625,477m3in the orebody;588 m3in the host rock),3383 m3(only in the orebody),and 196,489 m3(128,834 m3in the orebody;67,655 m3in the host rock)for the shear,compressive,and tensile mechanisms,respectively.For the diminishing pillar sequence,these same numbers read 587,177 m3(586,774 m3in the orebody;403 m3in the host rock),3462 m3(only in the orebody),and 225,645 m3(134,298 m3in the orebody;91,347 m3in the host rock),respectively.Hence,in terms of overall shear instability,the center-out sequence was more voluminous with virtually all of the unstable rock mass found within the orebody itself.The diminishing pillar hosted a larger volume where the tensile mechanism was active,with about 60%of instability occurring in the orebody and the rest in the host rock.In terms of the compressive mechanism,the values were virtually identical for both sequences and instability was observed in the orebody only.
4.Conclusions
Based on typical geological settings in the Canadian Shield,a simplified numerical model of an underground hard rock mine was constructed in the finite difference code FLAC3D.The geometry of the orebody and surrounding formations was based on a case study mine,which also provided the rock mass properties and the in situ stress tensor.Two stope sequence scenarios were implemented from the bottom upwards on four active levels between the depths of 1430-1550 m.Mining alternated between two fronts in the eastern and western sides of the orebody,moving to the center in a diminishing pillar pattern in the first sequence scenario.In the second one,they moved from the center outwards,and both comprised a total of 24 stages.Three instability criteria comprising theBSR,UCS,and tensile stress were selected for a combined numerical-volumetric analysis.A haulage network was excavated in the footwall on all active levels,consisting of a drift parallel to the orebody at a distance of 30 m from it and three crosscuts perpendicular in its western,central,and eastern sections.
An initial overview indicated that the patterns were relatively similar for all the levels and subsequent analysis was confined to the network on L 1490 and the stopes above and below it.The locations of theBSRand compressive instability were restricted mainly to theorebody,while the tensile one also extended into the surrounding greenstone formation.It was observed that the volume of unstable rock mass was larger in the upper stopes for theBSRand compressive criteria due to induced stresses being transferred to the remaining ore there with the progression of mining from the bottom upwards.For the tensile criterion,the reverse trend prevailed with the presence of a larger volume on the lower level.In addition,it was the only criterion that affected the greenstone formation as well,requiring further comparisons between the footwall and hanging wall sides.The center-out sequence resulted in a larger volume of instability in the orebody and host rock based on theBSRcriterion,while the diminishing pillar option exceeded it based on tensile stress considerations in the greenstone formation.

Table 5Volumetric comparison of tensile instability(σ3 < 0).
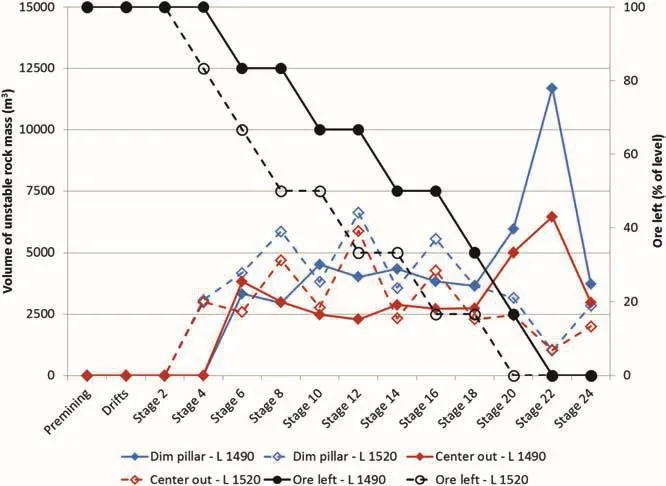
Fig.8.Volumetric comparison of tensile instability(σ3 < 0)in greenstone and ore left-L 1490 and L 1520.
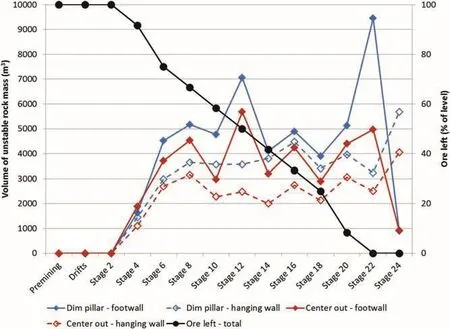
Fig.9.Volumetric comparison of tensile instability(σ3 < 0)in greenstone and ore left-footwall and hanging wall.
A comparison between tensile instability in the footwall and hanging wall revealed that the former comprised more voluminous regions of unstable rock mass due to the presence of the haulage network.In addition,the diminishing pillar sequence resulted in a consistently larger volume of instability in the host rock-especially towards the end of operations-that would remain in place even after mining was completed.The volumetric analysis was useful both from a ground control perspective with respect to the haulage network,and from an economic one with respect to unplanned ore dilution.
The combined numerical-volumetric analysis proved to be a useful planning tool for comparing alternate sequence scenarios with respect to potential instability generated by the main rockmass instability criteria.In addition,it was also able to identify the location and timing of these events,which would be very practical in the design and implementation of preventive measures.

Table 6Volumetric comparison of tensile(σ3< 0)and shear instability(BSR ≥ 0.7)-footwall and hanging wall.
Conflict of interest
The authors wish to confirm that there are no known conflicts of interest associated with this publication and there has been no significant financial support for this work that could have influenced its outcome.
This work was financially supported by the Natural Science and Engineering Research Council of Canada(NSERC)with grant No.223079.The authors are grateful for their support.
Andrieux P,Simser B.Ground-stability-based mine design guidelines at the Brunswick Mine.In:Hustrulid WA,Bullock RL,editors.Underground mining methods:engineering fundamentals and international case studies.Littleton:Society for Mining,Metallurgy,and Exploration,Inc.(SME);2001.p.207-14.
Arjang B,Herget G.In situ ground stresses in the Canadian hardrock mines:an update.International Journal of Rock Mechanics and Mining Sciences 1997;34(15):1-16.
Bai X,Marcotte D,Simon R.Underground stope optimization with network flow method.Computers&Geosciences 2013;52:361-71.
Beck DA,Brady BHG,Grant DR.Induced stress and microseismicity in the 3000 orebody,Mount Isa.Geotechnical&Geological Engineering 1997;15(3):221-33.
Beck DA,Sandy MP.Mine sequencing for high recovery in Western Australian mines.In:Proceedings of the 12th international symposium on mine planning and equipment selection,2003.Kalgoorlie,Carlton:AIMM;2003.p.137-44.
Bewick RP,Kaiser PK.Influence of rock mass anisotropy on tunnel stability.In:Proceedings of ROCKENG09-the 3rd CANUS rock mechanics symposium,Toronto;2009(Paper 3995).
Bewick RP,Valley B,Runnalls S,Whitney J,Krynicki Y.Global approach to managing deep mining hazards.In:Proceedings of ROCKENG09-the 3rd CANUS rock mechanics Symposium,Toronto;2009(Paper 3994).
Board M,Brummer R,Seldon S.Use of numerical modeling for mine design and evaluation.In:Hustrulid WA,Bullock RL,editors.Underground mining methods:Engineering Fundamentals and international case studies.Littleton:SME;2001.p.483-91.
Brady BHG,Brown ET.Rock mechanics for underground mining.3rd ed.Dordrecht:Springer;2006.
Brown ET,Hoek E.Trends in relationships between measured in-situ stresses and depth.International Journal of Rock Mechanics and Mining Sciences and Geomechanics Abstracts 1978;15(4):211-5.
Bullock RL.Comparison of underground mining methods.In:Darling P,editor.SME mining engineering handbook.3rd ed.Englewood:SME;2011.p.385-403.
Cai M,Kaiser PK,Martin CD.A tensile model for the interpretation of microseismic events near underground openings.Pure and Applied Geophysics 1998;153(1):67-92.
Cai M,Kaiser PK,Martin CD.Quantification of rock mass damage in underground excavations from microseismic event monitoring.International Journal of Rock Mechanics and Mining Sciences 2001;38(8):1135-45.
Cai M.Rock mass characterization and rock property variability considerations for tunnel and cavern design.Rock Mechanics and Rock Engineering 2011;44(4):379-99.
Cai M,Kaiser PK.In-situ rock spalling strength near excavation boundaries.Rock Mechanics and Rock Engineering 2014;47(2):659-75.
Carter PG.Selection process for hard-rock mining.In:Darling P,editor.SME mining engineering handbook.3rd ed.Englewood:SME;2011.p.357-76.
Castro LAM,McCreath DR.Rock mass damage initiation around the Sudbury Neutrino Observatory cavern.In:Proceedings of the 2nd North American rock mechanics symposium,Montreal.Rotterdam:A.A.Balkema;1996.p.1589-95.
Castro LAM,Grabinsky MW,McCreath DR.Damage initiation through extension fracturing in a moderately jointed brittle shear rock mass.International Journal of Rock Mechanics and Mining Sciences 1997;34(3-4):1-13.
Castro LAM,Bewick RP,Carter TG.An overview of numerical modelling applied to deep mining.In:Azevedo R,editor.Innovative numerical modelling in geomechanics.London:CRC Press;2012.p.393-414.
Cepuritis PM,Villaescusa E,Beck DA,Varden R.Back analysis of over-break in a longhole open stope operation using non-linear elasto-plastic numerical modelling.In:Proceedings of the 44th US rock mechanics symposium and 5th US-Canada rock mechanics symposium,2010.Salt Lake City.Salt Lake City:American Rock Mechanics Association(ARMA);2010(Paper 10-124).
Contador NV,Glavic MF.Sublevel open stoping at El Soldado mine:a geomechanic challenge.In:Hustrulid WA,Bullock RL,editors.Underground mining methods:engineering fundamentals and international case studies.Littleton:SME;2001.p.263-9.
Counter DB.Kidd mine-dealing with the issues of deep and high stress miningpast,present and future.In:Proceedings of the 7th international conference on deep and high stress mining,Sudbury.Crawley:Australian Centre for Geomechanics(ACG);2014.p.3-22.
Diederichs MS,Kaiser PK.Tensile strength and abutment relaxation as failure control mechanisms in underground excavations.International Journal of Rock Mechanics and Mining Sciences 1999;36:69-96.
Diederichs MS.Instability of hard rock masses:the role of tensile damage and relaxation.PhD Thesis.Waterloo,Ontario:University of Waterloo;1999.
Diederichs MS,Coulson A,Falmagne V,Rizkalla M,Simser B.Application of rock damage limits to pillar analysis at Brunswick Mine.In:Proceedings of the 5th North American rock mechanics symposium and 17th Tunnelling Association of Canada conference-NARMS-TAC 2002,Toronto;2002.p.1325-32.
Diederichs MS,Kaiser PK,Eberhardt E.Damage initiation and propagation in hard rock during tunneling and the influence of near-face stress rotation.International Journal of Rock Mechanics and Mining Sciences 2004;41(5):785-812.
Diering JAC,Laubscher DH.Practical approach to the numerical stress analysis of mass mining operations.In:Proceedings of the mining Latin America Conference,Santiago.Dordrecht:Springer;1986.p.87-99.
Hamrin H.Underground mining methods and applications.In:Hustrulid WA,Bullock RL,editors.Underground mining methods:engineering fundamentals and international case studies.Littleton:SME;2001.p.3-14.
Hoek E,Kaiser PK,Bawden WF.Support of underground excavations in hard rock.Rotterdam:A.A.Balkema;1995.
Hoek E,Martin CD.Fracture initiation and propagation in intact rock-a review.Journal of Rock Mechanics and Geotechnical Engineering 2014;6(4):287-300.
Hudson JA,Harrison JP.Engineering rock mechanics:an introduction to the principles.Oxford:Elsevier;1997.
Hudyma MR,Potvin Y.An engineering approach to seismic risk management in hardrock mines.Rock Mechanics and Rock Engineering 2010;43(6):891-906.
Idris MA,Saiang D,Nordlund E.Probabilistic analysis of open stope stability using numerical modelling.International Journal of Mining and Mineral Engineering 2011;3(3):194-219.
Itasca.Itasca software products-FLAC3D.Minneapolis:Itasca Consulting Group Inc.;2006.
Jing L.A review of techniques,advances and outstanding issues in numerical modelling for rock mechanics and rock engineering.International Journal of Rock Mechanics and Mining Sciences 2003;40(3):283-353.
Jooste Y,Malan DF.Rock engineering aspects of a modified mining sequence in a dip pillar layout at a deep gold mine.Journal of the South African Institute of Mining and Metallurgy 2015;115:1097-112.
Kaiser PK.Keynote address:support of tunnels in burst-prone ground-toward a rational design methodology.In:Proceedings of the 3rd international symposium on rockbursts and seismicity in mines,Kingston.Rotterdam:A.A.Balkema;1993.p.13-27.
Kaiser PK,Diederichs MS,Martin CD,Sharpe J,Steiner W.Underground works in hard rock tunnelling and mining.In:Proceedings of ISRM international symposium.Melbourne:Technomic Publishing Company;2000.p.841-926.
Kaiser PK,Yazici S,Maloney S.Mining-induced stress change and consequences of stress path on excavation stability-a case study.International Journal of Rock Mechanics and Mining Sciences 2001;38(2):167-80.
Laubscher DH.Cave mining.In:Darling P,editor.SME mining engineering handbook.3rd ed.Englewood:SME;2011.p.1385-97.
Lawrence BW.Considerations for sublevel stoping.In:Gertsch RE,Bullock RL,editors.Techniques in underground mining.Littleton:SME;1998.p.227-47.
Malek F,Trifu C,Suorineni FT,Espley S,Yao M.Management of high stress and seismicity at Vale Inco Creighton mine.In:Proceedings of the 42nd US rock mechanics symposium and 2nd US-Canada rock mechanics symposium.San Francisco:ARMA;2008(Paper 08-386).
Manchuk J.Stope design and sequencing.MS Thesis.Edmonton,Alberta:University of Alberta;2007.
Martin CD.Seventeenth Canadian geotechnical colloquium:the effect of cohesion loss and stress path on brittle rock strength.Canadian Geotechnical Journal 1997;34(5):698-725.
Martin CD,Kaiser PK,Maybee G.A failure criterion for the stability of drifts and pillars.In:Proceedings of the 100th CIM annual general meeting,Montreal;1998.
Martin CD,Tannant DD,Yazici S,Kaiser PK.Stress path and instability around mine openings.In:Proceedings of the 9th ISRM congress.Paris:ISRM;1999a.p.1-5.
Martin CD,Kaiser PK,McCreath DR.Hoek-Brown parameters for predicting the depth of brittle failure around tunnels.Canadian Geotechnical Journal 1999b;36(1):136-51.
Martin CD,Kaiser PK,Christiansson R.Stress,instability and design of underground excavations.International Journal of Rock Mechanics and Mining Sciences 2003;40(7-8):1027-47.
McKinnon SD.Analysis of stress measurements using a numerical model methodology.International Journal of Rock Mechanics and Mining Sciences 2001;38(5):699-709.
Mining Sourcebook. Canadian Mining Journal 2007. http://www.canadianminingjournal.com.
Nehring M,Topal E,Kizil M,Knights P.Integrated short-and medium-term underground mine production scheduling.Journal of the South African Institute of Mining and Metallurgy 2012;112:365-78.
Pareja LD.Deep underground hard-rock mining-issues,strategies,and alternatives.PhD Thesis.Kingston,Ontario:Queen’s University;2000.
Pelley CW.A study of sequencing strategy for steep,tabular,hardrock orebodies.PhD Thesis.Montreal,Quebec:McGill University;1994.
Perman F,Sjöberg J,Dahner C.Detailed three-dimensional stress analysis of complex orebody geometry-model setup and results for the Malmberget mine.In:Proceedings of the 2nd international FLAC/DEM symposium,Melbourne;2011(Paper#02-04).
Pierce ME.Laboratory and numerical analysis of the strength and deformation behaviour of paste backfill.PhD Thesis.Kingston,Ontario:Queen’s University;1997.
Poniewierski J,MacSporran G,Sheppard I.Optimisation of cut-off grade at Mount Isa Mines Limited’s enterprise mine.In:Proceedings of the 12th international symposium on mine planning and equipment selection.Carlton:AusIMM;2003.p.531-8.
Potvin Y,Hudyma MR.Open stope mining in Canada.In:Proceedings of the Mass Min2000,Brisbane.Carlton:AusIMM;2000.p.661-74.
Raju GD,Mitri H,Thibodeau D,Moreau-Verlaan L.Numerical modelling and in situ monitoring of drift support performance with respect to mining sequence.International Journal of Mining,Reclamation and Environment 2015;29(2):83-95.
Shnorhokian S,Mitri HS,Thibodeau D.A methodology for calibrating numerical models with a heterogeneous rock mass.International Journal of Rock Mechanics and Mining Sciences 2014;70:353-67.
Shnorhokian S,Mitri HS,Moreau-Verlaan L.Stability assessment of stope sequence scenarios in a diminishing ore pillar.International Journal of Rock Mechanics and Mining Sciences 2015;74:103-18.
Sjöberg J,Perman F,Quinteiro C,Malmgren L,Dahner-Lindkvist C,Boskovic M.Numerical analysis of alternative mining sequences to minimise potential for fault slip rockbursting.Transactions of the Institution of Mining and Metallurgy,Section A:Mining Technology 2012;121(4):226-35.
Stephan G.Cut-and-fill mining.In:Darling P,editor.SME mining engineering handbook.3rd ed.Englewood:SME;2011.p.1365-73.
Trifu CI,Suorineni F.Use of microseismic monitoring for rockburst management at Vale Inco Mines.In:Proceedings of the 7th international symposium on rockburst and seismicity in mines-RaSiM7.Rinton Press;2009.p.1105-14.
Turner MH,Beck DA.Monitoring the onset of seismicity.In:Proceedings of ACG international seminar on deep and high stress mining.Perth:ACG;2002.
Villaescusa E.Global extraction sequences in sublevel stoping.In:Proceedings of the 12th international symposium on mine planning and equipment selection.Carlton:AusIMM;2003.p.9-17.
Villaescusa E.Geotechnical considerations for planning and design of open stopes.In:Proceedings of the 5th international conference and exhibition on mass mining.Lulea:Lulea University of Technology Press;2008.p.341-52.
Villaescusa E.Geotechnical design for sublevel open stoping.Boca Raton:CRC Press;2014.
Wiles TD,Villaescusa E,Windsor CR.Rock reinforcement design for overstressed rock using three dimensional numerical modeling.In:Proceedings of the 5th international symposium on ground support.London:Taylor and Francis Group;2004.p.483-9.
Wiles TD.Rockburst prediction using numerical modelling:realistic limits for failure prediction accuracy.In:Proceedings of the 6th international conference on rockburst and seismicity in mines.Nedlands:ACG;2005.p.57-63.
Wiles TD.Reliability of numerical modelling predictions.International Journal of Rock Mechanics and Mining Sciences 2006;43(3):454-72.
Wiles TD.Evidence based model calibration for reliable predictions.In:Proceedings of the 4th international seminar on deep and high stress mining.Nedlands:ACG;2007.p.3-20.
Yao M,Chinnasane DR,Harding D.Mitigation plans for mining in highly burstprone ground conditions at Vale Inco Copper Cliff North Mine.In:Proceedings of ROCKENG09-the 3rd CANUS rock mechanics symposium;2009(Paper 4045).
Yao M,Moreau-Verlaan L.Strategies for mining in highly burst-prone ground conditions at Vale Garson mine.In:Proceedings of the 5th international seminar on deep and high stress mining.Crawley:ACG;2010.
Young RP,Collins DS.Seismic studies of rock fracture at the underground research laboratory,Canada.International Journal of Rock Mechanics and Mining Sciences 2001;38(6):787-99.
Zhang Y,Mitri HS.Elastoplastic stability analysis of mine haulage drift in the vicinity of mined stopes.International Journal of Rock Mechanics and Mining Sciences 2008;45(4):574-93.
 Journal of Rock Mechanics and Geotechnical Engineering2018年1期
- Journal of Rock Mechanics and Geotechnical Engineering的其它文章
- Anisotropy effect on strengths of metamorphic rocks
- Influence of loading and heating processes on elastic and geomechanical properties of eclogites and granulites
- Geomechanical characterization of volcanic rocks using empirical systems and data mining techniques
- Investigation of creep behaviours of gypsum specimens with flaws under different uniaxial loads
- Effects of lime addition on geotechnical properties of sedimentary soil in Curitiba,Brazil
- Corrigendum to“Back-analysing rock mass modulus from monitoring data of two tunnels in Sydney,Australia”[J Rock Mech Geotech Eng 5(2017)877-891]
