Diagnostic Integrated Geoscience In 4D, A Case Study
2017-10-17 07:04:36JianguoZhangIanFinnie
中国海洋大学学报(自然科学版) 2017年10期
Jianguo Zhang ,Ian Finnie
(1.Senior Principal Engineer, Fugro AG Pty Ltd, Perth WA6009, Australia; 2.Shandong Provincial Key Laboratony of Marine Environment and Geological Engineering, Ocean University of China,Qingdao 266100,China)
Diagnostic Integrated Geoscience In 4D, A Case Study
Jianguo Zhang1,2,Ian Finnie1
(1.Senior Principal Engineer, Fugro AG Pty Ltd, Perth WA6009, Australia; 2.Shandong Provincial Key Laboratony of Marine Environment and Geological Engineering, Ocean University of China,Qingdao 266100,China)
Abstract: This paper presents an emergent best-practice process that is referred to as a (DIG) approach, in which a 4 dimensional (4D) engineering geological model can be developed for marine sites.This state-of-the-art approach integrates the geophysical data, geotechnical data and geological data (plus metocean data where necessary) in a Geographical Information System (GIS) environment. The 4D model accounts for not only for 3D spatial variability of the seabed stratigraphy, but also temporally relevant geomorphological processes on the seabed, with time being the fourth dimension. The general principles are discussed first, followed by a case study demonstrating how DIG works in 4D and the engineering benefits this approach can offer.
Key words: diagnostic; integrate; geoscience
A comprehensive understanding of the seabed engineering geology is vital for any offshore oil and gas or renewable energy development. This understanding is based on the knowledge of regional geology, the interpretation of site specific geological, geophysical and geotechnical data, and as an offshore development, the understanding of prevailing metocean conditions. The process to achieve such an understanding can be best described by a Diagnostic Integrated Geoscience (DIG) approach.
1 The Process of a DIG Approach
The process of a DIG approach involves the integration of various data-sets with the diagnostic expertise in all relevant geo-disciplines. These data-sets normally include:
Geophysical data-set. The geophysical data-set primarily comprises of multibeam echosounder (MBES) bathymetric data, seismic reflection sub-bottom profiler (SBP) data, side scan sonar (SSS) data and, in some cases, seismic refraction sub-bottom data. This data-set gives full coverage of the seabed surface over the surveyed area and continued line coverage on vertical profiles penetrating to a certain depth BSF.Appropriate interpretation of geophysical data with adequate quality allows a primary appreciation of the sea floor morphology, seabed stratigraphy and their spatial variability.
·Geologicaldata-set. The geological data-set consists of regional geological conditions, site specific geological and geohazard logs and specific quantification such as14C dating, mineral composition and thin section Scan Electron Microscopy (SEM) images of the cores or seabed sediment samples. While site specific geological logs provide detailed description of the sediments, other geological information such as regional settings, seismic history, source of sediment supply, impact of sea level changes on seabed morphology and sedimentary process explains why the seabed is what we see today, and provides supplementary insight in the interpretation of site specific geological conditions within an appropriate framework.
·Geotechnicaldata-set. The geotechnical data-set includes field measurements such as piezocone penetration testing (with continuous pore pressure measurement and dissipation test at selected depth intervals), T-bar testing (with cyclic loading at selected depth ranges), ball penetrometer testing (with continuous pore pressure measurement, dissipation test and cyclic loading at selected depth),Standard Penetrometer Testing (SPT) and onshore laboratory tests such as soil classification index, shear strength, soil stiffness and soil compressibility parameters. Data obtained at each individual test location effectively quantifies the variability of seabed sediment with depth BSF and grounds truth the geophysical data.
·GeographicInformationSystem(GIS). GIS is a powerful tool which can be used to overlay and integrate all geophysical, geological and geotechnical data-sets on the same map using its “layering” system and to present all data in a 2 dimension (2D) or 3 dimension (3D) model.
Although combining all available data in a GIS environment appears to be a straight-forward activity, it demands expertise input from Geophysicists, Geologists and Geotechnical Engineers; generally with the geotechnical engineer leading the integration process such that the DIG outcome is oriented purposely to provide the most needed engineering input for any offshore development project[1]. This process is illustrated effectively by a 4G data integration model[2]as shown in Figure 1.
2 The Life Cycle of DIG
The process of a DIG approach involves the integration of various data-sets at different stages of an offshore project. These may include early concept selection stage, front end engineering (FEED) stage, execution, procurement, construction and installation (EPCI) stage and operation and expansion stage(s).
At the early concept selection stage, or some time called the pre-FEED stage, it is common that project specific geophysical, geological and geotechnical data may not be available. It is therefore vital that a desktop study is performed at this stage in order to provide high level, big picture, yet vital input to assist the project since the outcome from the desktop study may identify key issues such as geohazard events that may ultimately dictate the development concept. Following the DIG approach, the desktop study is expected to integrate regional geological data such as regional settings and earthquake records published by the international or national geoscience society, geophysical data such as 2D or 3D seismic data published by the local government for development block release or acquired by the operator for reservoir exploration, other relevant data published in scientific research papers or acquired for other projects in the surrounding area that is made available by the client. The resolution of these data-sets is often variable but would normally be relatively limited. For example the MBES bathymetric data could be in the order of 20 m bin size (i.e. one elevation data point every 20 m width). Through this DTS, a basic geological model is expected to be developed, with data gaps identified, which then forms a framework to guide the planning of further work such as project specific data collection, geological model development and design parameters determination.
Following the recommendations of the DTS, site specific geophysical, geological and geotechnical data acquisition is expected to be executed before the project transitioning into the FEED stage. The FEED stage is normally required for large offshore development projects in order to firm up the development concept through a preliminary engineering design and cost analysis. As one of the key components of FEED, the site specific geo-data collected should be integrated into the basic geological model, through the DIG approach, to achieve an improved understanding of the seabed conditions particularly the 3D variability of the stratigraphy and to update the basic geological model to a preliminary model. In order to achieve this target, the geophysical data is expected to have much higher resolution than the public domain data, e.g. the MBES bathymetric data may have a resolution in the order of 5 to 10 m.

Figure 1 The DIG Process Model图 1 会诊式数据整合过程模型
In addition to the 3D variability of seabed conditions, the geological data-set obtained from paleo logging, or sedimentary logging,14C dating and geohazard logging of the geological cores, is expected to provide chronological time history data of the seabed sediments. Further to that, the metocean data and probabilistic seismic hazard analysis (PSHA) data are expected to give implications of the anticipated interaction between the seabed and the environments and how these environmental events may alter the seabed conditions with time through soil liquefaction, erosion or slope failures. This essentially adds a time axial to the 3D geological model and extends it to 4D. This is an important addition because the interpretation of this data-set will derive key information such as the rate of sedimentation, likelihood of detrimental event occurrence and the influence zone of such an event.
Depending on the quality and quantity of the available site specific geo-data and the findings from the FEED stage, more detailed geophysical survey may be required to collect even higher resolution data, e.g. less than 1 m bin size MBES bathymetry, for localised zones or special features that could not be confidently characterised in the preliminary geological model, or more in-situ geotechnical testing, additional sediment samples and laboratory testing are necessary for improved definition of engineering parameters. The additional data collected will further enrich the 3G database to allow the 4D preliminary geological model be updated, refined, improved and “finalised”. This “finalised” 4D model and all relevant engineering parameters defined in this model will form a key part in the tender package as “to-rely-upon” data for the EPCI contractors to carry out detailed engineering, design and installation analysis.
During the EPCI stage, it is common practice that a pre-installation survey, installation monitoring and as-built surveys are performed as often stipulated in the contract. These surveys and monitoring acquire high resolution data-sets including ROV video footages on local seabed, foundation skirt penetration, foundation stability, pipeline as-laid embedment, etc., and are expected to supplement the “finalised” 4D model. The supplemented model is ideal for the operator to efficiently and cost effectively plan the regular inspection, monitoring/ maintenance and rectification/ repair program to minimise the operational expenditure during project operation.
During the operational stage, the information gathered from inspection and monitoring provides time-dependent seabed data such as local scour, sediment accumulation, foundation settlement and pipeline free span and self-burial status. Integration of this data-set into the existing 4D model will give the model timely update and more importantly an opportunity of validation from observed data. This is invaluable in evaluating the impact of time on the seabed, in improving the engineering assessment methodology and for life extension or de-commissioning of the project towards the end of its design life, or at any time during project operation, planning and executing the expansion or the next phase development of the project.
The life cycle of DIG as discussed above is summarised in Figure 2 below.
3 A Case Study
A case study is presented in this section to demonstrate how the DIG approach was adopted for the development of the seabed geological model and the update of this model in supporting the installation work for an offshore pipeline project. This pipeline is 20″ in diameter and its offshore section is approximately 40 km long.
The whole offshore pipeline section is in shallow water with a maximum water depth of about 20 m. A smaller diameter gas pipeline exists in the surrounding area which has been in operation for about 20 years at the time this new pipeline was designed. Variably cemented or weathered calcarenite overlain by a veneer of surficial carbonate sand was found dominating the seabed along this existing pipeline. Rock bolts, i.e. drilled and grouted pin piles were used along the existing pipeline, in combination with concrete weight coating, to ensure its stability since the metocean conditions are rather severe with tropical cyclones travel across the site every summer.
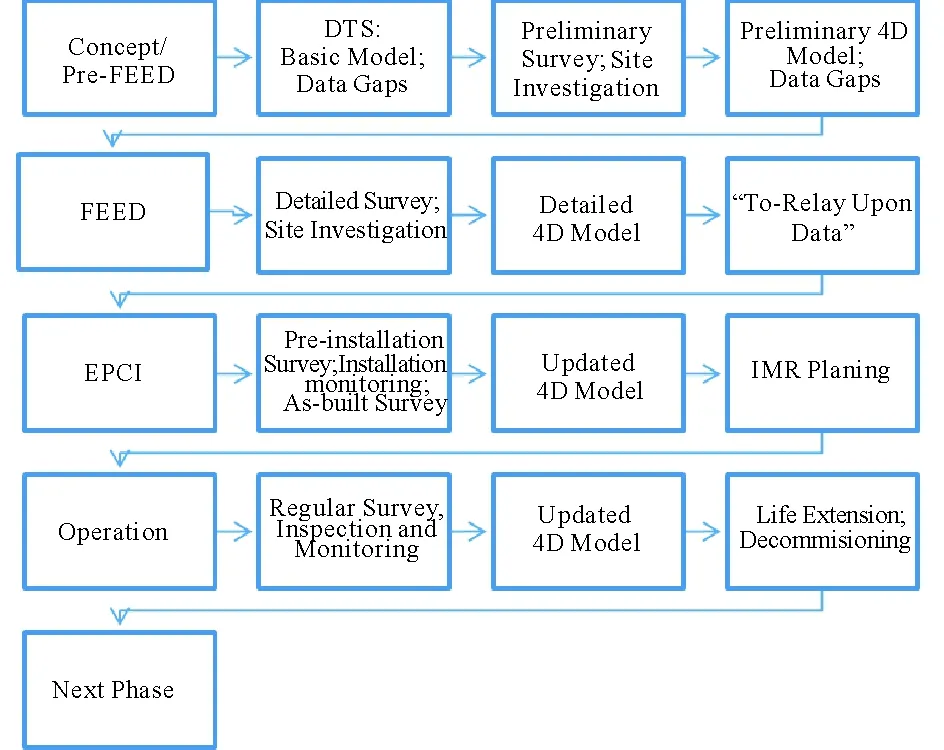
Figure 2 The DIG Life Cycle图2 会诊式数据整合的完整循环
While it is common that a preliminary geophysical survey would be performed initially to collect MBES bathymetric data, side scan sonar data, seismic reflection sub-bottom data and grab samples followed by a geotechnical investigation, the regional knowledge and project experience has allowed a hybrid survey be confidently executed for the new pipeline to acquire geophysical (supplemented by seismic refraction) data, shallow PCPT data and shallow geotechnical samples in the same campaign.
As examples Figure 3 and Figure 4 present a summary of these data-sets for two typical pipeline sections. Figure 3 suggests that the seabed in this pipeline section is dominated by relatively competent rock, as interpreted from relatively high seismic wave velocities of 2500 to 3000 m/sec, with a thin veneer of surficial sand. The CPT data in general confirmed the embedment of the first reflector, corresponding to the surface of the rock layer. This data-set provided the rock bolts design team with high confidence in capacity evaluation which is a governing factor in determining rock bolt spacing along the pipeline.
In contrast, Figure 4 shows a section of seabed that is dominated by a thicker layer of sand overlying weakly cemented and most likely heavily weathered rock, as interpreted from the recorded seismic wave velocities of 1900 to 2100 m/s and extremely irregular embedment of the first reflector. The data-set also shows inconsistency in the thickness of the surficial sand layer interpreted from the refraction data and CPT data, which has led to high uncertainty in the selection of rock bolt spacing. As a result, a conservative design was inevitably produced based on the worst possible seabed stratigraphy scenario.
In order to improve the confidence level in rock bolt spacing selection, the drilling record during rock bolt installation was used to calculate a drilling work index (DWI).
The DWI profile was then compared with the refraction data and CPT data in the vicinity, as illustrated in Figure 5, to validate the correlation between DWI and seabed material category, ie, uncemented, weakly cemented or well cemented. This correlation was then applied to all proposed rock bolt locations by the site engineer during drilling and rock bolt installation.
It is also noticeable in Figure 4 that the refraction data indicates the presence of relatively thick surficial sand in two short sections, each measured more than 1 km long. This was confirmed by BH15_PCPT and BH18_PCPT with 3.8 m and 3.1 m penetrations respectively. Due to the demanding lateral capacity requirements, it was not viable to use rock bolts in these two short sections. Post lay trenching was subsequently considered as an alternative secondary stabilisation method at these two sections and other sections with significant sand cover.
However, the seabed morphology at these locations shows typical sand-wave characteristics which raised a concern to the trenching solution that may not work if the sandy sediments are mobile, and more expensive solutions such as rock dumping may be required. Detailed geological logging of the drop core samples was therefore carried out to address this concern.

Figure 3 Section A-Geophysical and Geotechnical Data Suggesting Surficial Sand on Top of Competent Rock图3 剖面A-物探和地勘数据显示表层薄砂覆盖完整性较好岩层

Figure 4 Section B-Geophysical and Geotechnical Data Suggesting Surficial Sand on Top of Weakly Cemented or Weathered Rock图4 剖面B-物探和地勘数据显示表层薄砂覆盖弱胶结或风化岩层
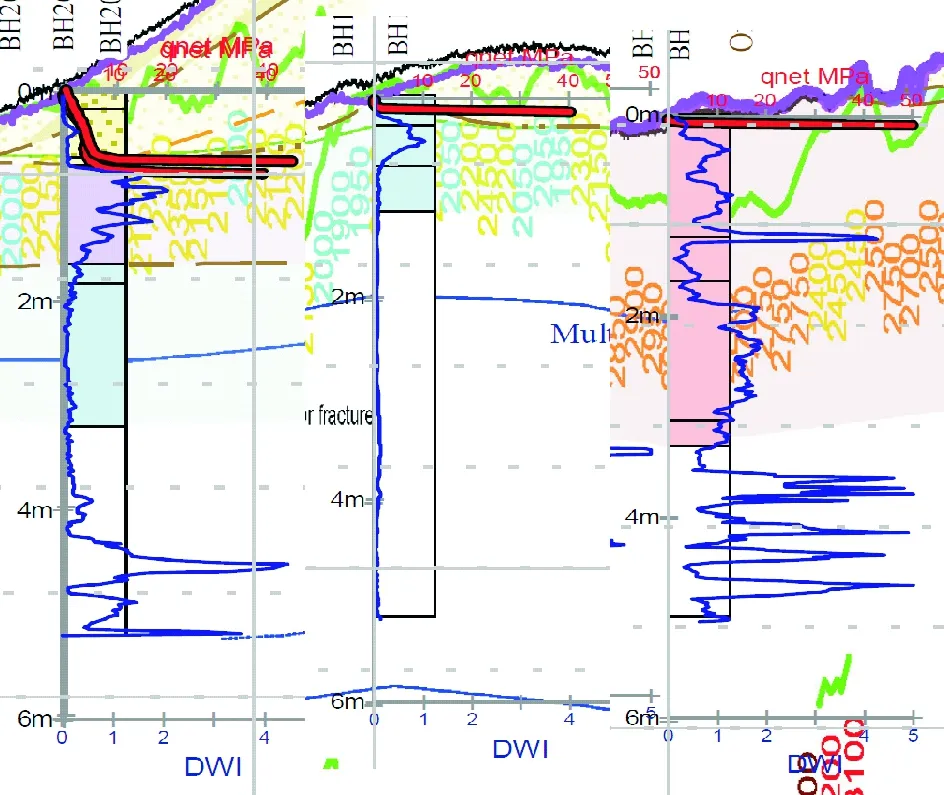
Figure 5 Correlation between DWI, Seismic Wave Velocity and Cone Tip Resistance图5 DWI,地震波速与静力触探阻力的相关性
The detailed geological logging found regular sequence of sand deposits consisting of, from bottom to top as shown on the updated geological model presented in Figure 6, sands filled in the gaps of weathered rock, i.e., “lagoonal deposits” and uniform sandy sediments, i.e., “paleo-channel deposits”.Only a very thin surficial layer of paleo-channel deposits was anticipated to be mobile based on the cone tip resistance measured in the sandy deposits.Based on updated geological model, the project adopted post-lay jet trenching as secondary stabilisation solution for these sections.
The project has been operational since late 2015. The contribution from the geo-disciplines particularly the development of the integrated 3D model and the timely update of this model in supporting the optimisation of secondary stabilisation design at the installation stage, was highlighted throughout this project. This approach always adds value and, in this example, led to hundreds of millions of dollars of savings in construction, and an improved level of operational risk assurance.
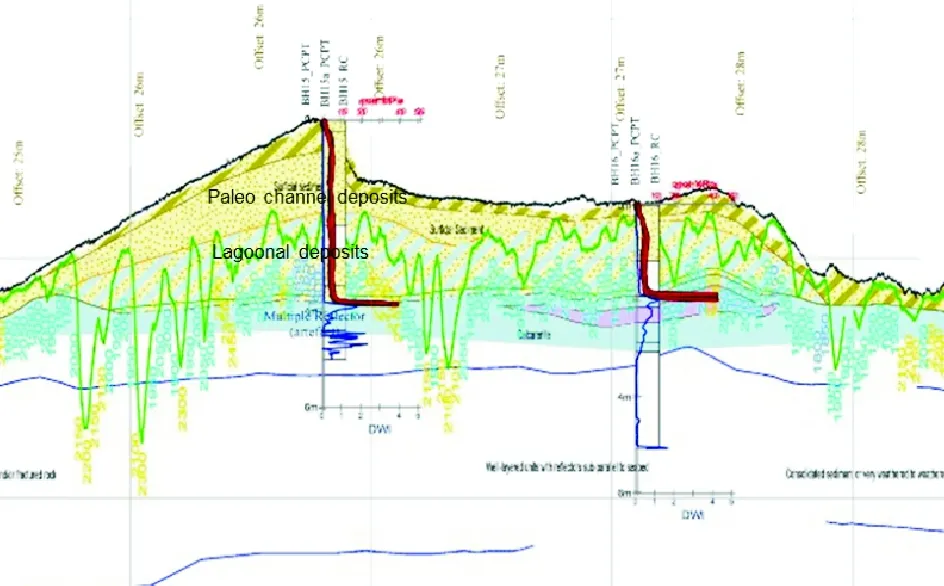
Figure 6 Updated Model with Detailed Geological Logging图6 经详细的土样地质分析的改进模型
4 Conclusions
DIG is an emergent best-practice process that has
been proven to successfully integrate 3G data-sets in a GIS environment to develop a 4D geological model that can add value through all stages of a project development.
Acknowledgement
The great effort and contribution from the integrated geoscience group at Fugro AG, both in the development of the DIG approach and in its successful application in the case study, is acknowledged. The authors also thank Professor Yonggang Jia for his invitation to submit a paper to the 2017 National Engineering Geology Conference.
[1] Finnie I M, Kortekaas J Carlton, et al. EMOE 519 in Encyclopedia of Marine Offshore Engineering[M]. Wiley: Chichester. 2017.
[2] Zhang J, Finnie I M. Integrated geoscience in marine site characterisation[C]. Qingdao, China: The 1stInternational Symposium in Marine Engineering Geology, Conference Proceedings, 2016.
P642
A
1672-5174(2017)10-148-06
四维空间中的会诊式数据整合
张建国1,2,Ian Finnie1
(1.辉固(澳大利亚)私人有限公司,澳大利亚 珀斯, WA6009;2.山东省海洋环境地质工程重点实验室,中国海洋大学, 山东 青岛 266100)
本文展现了海洋工程地质领域 一种新兴的数据整合方法。即会诊式地学数据整合(DIG)。此方法可广泛用于四维(4D)工程地质模型的建立。该方法利用地理信息系统(GIS)将物探数据、岩土工程勘察数据和地质资料(如有必要还可包括海况数据)整合为一个数据库并建立四维模型。此四维模型不仅可展现海床地层在三维空间的变化,还能揭示海床地貌随时间(第四维)的演变过程。论文首先讨论一般原理,然后通过一个实例演示如何使用此方法以及此方法可带来的工程效益。
会诊式;整合;地学
Jianguo Zhang,Ian Finnie.Diagnostic integrated geoscience in 4D, a case study[J].Periodical of Ocean University of China, 2017, 47(10): 148-153.
山东着重点研发计划(重大关键技术)资助项目(2016DJS09A03);国家自然科学基金委员会-山东省人民政府海洋科学研究中心联合资助项目(U160640);国家自然科学基金项目(41427803) Supported by the Key Research and Development Program of Shandong province,China(2016 DJS09A03);NSFC-Shandong Joint Find for Marine Scionce Research Centers(U1606401);National Natural Science Fandation of China(41427803)
2010-05-30;
2017-07-03
张建国(1965-),男,高工,教授,主要从事海洋环境岩土工程方面工作。E-mail:g.zhang@fugw.com
责任编辑 徐 环
10.16441/j.cnki.hdxb.20160484
猜你喜欢
科技进步与对策(2024年12期)2024-06-30 14:31:00
石油物探(2022年6期)2022-12-03 08:22:42
中学生数理化·高一版(2022年3期)2022-04-15 04:03:16
Chinese Physics B(2021年11期)2021-11-23 07:25:56
中国海洋大学学报(自然科学版)(2018年11期)2018-10-15 05:39:18
中国海洋大学学报(自然科学版)(2017年7期)2017-06-05 15:08:46
物探化探计算技术(2016年6期)2017-01-12 03:24:41
当代音乐(下旬刊)(2016年5期)2016-05-30 01:14:23
云南地质(2015年3期)2015-12-08 07:00:16
应用海洋学学报(2014年4期)2014-11-22 07:44:08